Table of Contents

Filed Pursuant to Rule 424(b)(3)
Registration Statement No. 333-256453

Finance of America Companies Inc.

186,461,906 Shares of Class A Common Stock offered by Selling Securityholders

Up to 14,374,971 Shares of Class A Common Stock offered by Finance of America Companies Inc.


This prospectus relates to the offer and sale from time to time by the selling securityholders named in this prospectus (the “Selling Securityholders”) of up to 186,461,906 shares of our Class A Common Stock. This includes up to 131,318,286 shares of Class A Common Stock that we may issue from time to time to the Selling Securityholders upon exchange of an equal number of limited liability company interests (“FoA Units”) in Finance of America Equity Capital LLC (“FoA”), held by them. We will not receive any proceeds from the sale of shares of Class A Common Stock by the Selling Securityholders pursuant to this prospectus.

Our registration of the securities covered by this prospectus does not mean that the Selling Securityholders will offer or sell any of the shares. The Selling Securityholders may sell the shares of Class A Common Stock covered by this prospectus in a number of different ways and at varying prices. We provide more information about how the Selling Securityholders may sell the shares in the section entitled “Plan of Distribution.”

In addition, this prospectus relates to the offer and sale by us of up to an aggregate of 14,374,971 shares of our Class A Common Stock that are issuable upon the exercise of 14,374,971 Warrants originally issued in the initial public offering of Replay. We intend to use the proceeds from the exercise of any Warrants for cash for general corporate purposes as described herein.

Our Class A Common Stock and our Warrants are listed on the New York Stock Exchange, or NYSE, under the symbols “FOA” and “FOA.WS,” respectively. On May 18, 2021, the closing price of our Class A Common Stock was $10.44 and the closing price for our Warrants was $1.48.

We are an “emerging growth company” as defined under the federal securities laws and, as such, may elect to comply with certain reduced public company reporting requirements for future filings. See “Summary—Implications of Being an Emerging Growth Company.”


See the section entitled “Risk Factors” beginning on page 7 of this prospectus to read about factors you should consider before buying our securities.

Neither the Securities and Exchange Commission nor any other regulatory body has approved or disapproved of these securities or passed upon the accuracy or adequacy of this prospectus. Any representation to the contrary is a criminal offense.


The date of this prospectus is June 4, 2021.    


Table of Contents

Table of Contents


     Page  

Summary

     1  

Risk Factors

     7  

Use of Proceeds

     56  

Determination of Offering Price

     57  

Market Information for Class A Common Stock and Dividend Policy

     58  

Unaudited Pro Forma Combined Consolidated Financial Information

     60  

Management’s Discussion and Analysis of Financial Condition and Results of Operations

     79  

Business

     140  

Management

     162  
     Page  

Certain Relationships and Related Person Transactions

     184  

Principal Securityholders

     192  

Selling Securityholders

     195  

Description of Securities

     203  

Plan of Distribution

     216  

Material U.S. Federal Income Tax Considerations

     221  

Legal Matters

     224  

Experts

     224  

Where You Can Find More Information

     224  

Index to Financial Statements

     F-1  


You should rely only on the information provided in this prospectus, as well as the information incorporated by reference into this prospectus and any applicable prospectus supplement. Neither we nor the Selling Securityholders have authorized anyone to provide you with different information. Neither we nor the Selling Securityholders are making an offer of these securities in any jurisdiction where the offer is not permitted. You should not assume that the information in this prospectus, any applicable prospectus supplement or any documents incorporated by reference is accurate as of any date other than the date of the applicable document. Since the respective dates of this prospectus and the documents incorporated by reference into this prospectus, our business, financial condition, results of operations and prospects may have changed.

Unless the context indicates otherwise, references in this prospectus to the “Company,” “we,” “us,” “our” and similar terms refer to Finance of America Companies Inc. and its consolidated subsidiaries.

EXPLANATORY NOTE

On April 1, 2021, Replay Acquisition LLC (f/ka/ Replay Acquisition Corp.) (“Replay”) domesticated into a Delaware limited liability company (the “Domestication”) and consummated a series of transactions that resulted in the business combination of Replay with Finance of America Equity Capital LLC, a Delaware limited liability company (“FoA”), pursuant to a Transaction Agreement dated as of October 12, 2020 (as amended or supplemented from time to time, the “Transaction Agreement”) among Replay, FoA, Finance of America Companies Inc., a Delaware corporation (the “Company”); RPLY Merger Sub LLC, a Delaware limited liability company and wholly owned subsidiary of the Company (“Replay Merger Sub”); RPLY BLKR Merger Sub LLC, a Delaware limited liability company and wholly owned subsidiary of the Company (“Blocker Merger Sub”); Blackstone Tactical Opportunities Fund (Urban Feeder) – NQ L.P., a Delaware limited partnership (“Blocker”); Blackstone Tactical Opportunities Associates – NQ L.L.C., a Delaware limited liability company (“Blocker GP”); BTO Urban Holdings L.L.C., a Delaware limited liability company (“BTO Urban”), Blackstone Family Tactical Opportunities Investment Partnership – NQ – ESC L.P., a Delaware limited partnership (“ESC”), Libman Family Holdings LLC, a Connecticut limited liability company (“Family Holdings”), The Mortgage Opportunity Group LLC, a Connecticut limited liability company (“TMO”), L and TF, LLC, a North Carolina limited liability company (“L&TF”), UFG Management Holdings LLC, a Delaware limited liability company (“Management Holdings”), and Joe Cayre (each of BTO Urban, ESC, Family Holdings, TMO, L&TF, Management Holdings and Joe Cayre, a “Seller” and, collectively, the “Sellers” or the “Continuing Unitholders”); and BTO Urban and Family Holdings, solely in their joint capacity as the representative of the Sellers pursuant to Section 12.18 of the Transaction Agreement (as defined below) (the “Seller Representative”),


i


Table of Contents

following the approval of the business combination contemplated by the Transaction Agreement and related matters at the extraordinary general meeting of the shareholders of Replay held on March 25, 2021 (the “Shareholders Meeting”). As a result of the Business Combination, the Company became a publicly-traded company on the New York Stock Exchange (the “NYSE”) and controls FoA in an “UP-C” structure.

In connection with the closing of the Business Combination (the “Closing”), each ordinary share, par value $0.0001 per share, of Replay (“Ordinary Shares”) issued and outstanding immediately prior to the Domestication converted, upon the effectiveness of the Domestication, into a unit representing a limited liability interest in Replay (each, a “Replay LLC Unit”) and then converted, upon the effectiveness of the merger of Replay Merger Sub with and into Replay (the “Replay Merger”) with Replay surving the Replay Merger as a direct wholly owned subsidiary of the Company, into the right to receive shares of Class A common stock of the Company, par value $0.0001 per share (“Class A Common Stock”). In addition, in connection with the Domestication and as a result of the approval of an amendment to Replay’s Warrant Agreement, dated April 8, 2019, by and between Replay and Continental Stock Transfer & Trust Company (“Replay Warrant Agreement”), Replay’s warrants to purchase Ordinary Shares as contemplated under the Replay Warrant Agreement (“Warrants”) automatically converted, upon the effectiveness of the Domestication and on a one-for-one basis, into Warrants to purchase Replay LLC Units, and upon the effectiveness of the Replay Merger, each such Warrant to purchase a Replay LLC Unit automatically converted into one Warrant to purchase a share of Class A Common Stock. In connection with the closing of the Business Combination, the warrants to purchase one Ordinary Share, as contemplated under the Replay Warrant Agreement, that were purchased in a private placement in connection with Replay’s initial public offering (“Private Placement Warrants”) owned by Replay Sponsor LLC, a Delaware limited liability company (the “Sponsor”), were cancelled in exchange for 775,000 Ordinary Shares (which ultimately converted into 775,000 shares of Class A Common Stock).

Our Class A Common Stock and our Warrants are currently traded on the NYSE under the symbols “FOA” and “FOA.WS,” respectively.

About This Prospectus

This prospectus is part of a registration statement on Form S-1 that we filed with the Securities and Exchange Commission (the “SEC”) using the “shelf” registration process. Under this shelf registration process, the Selling Securityholders may, from time to time, sell the securities offered by them described in this prospectus. We will not receive any proceeds from the sale by such Selling Securityholders of the securities offered by them described in this prospectus. This prospectus also relates to the issuance by us of the shares of Class A Common Stock issuable upon the exercise of any Warrants. We will receive proceeds from any exercise of the Warrants for cash.

Neither we nor the Selling Securityholders have authorized anyone to provide you with any information or to make any representations other than those contained in this prospectus or any applicable prospectus supplement or any free writing prospectuses prepared by or on behalf of us or to which we have referred you. Neither we nor the Selling Securityholders take responsibility for, and can provide no assurance as to the reliability of, any other information that others may give you. Neither we nor the Selling Securityholders will make an offer to sell these securities in any jurisdiction where the offer or sale is not permitted.

We may also provide a prospectus supplement or post-effective amendment to the registration statement to add information to, or update or change information contained in, this prospectus. You should read both this prospectus and any applicable prospectus supplement or post-effective amendment to the registration statement together with the additional information to which we refer you in the sections of this prospectus entitled “Where You Can Find More Information.”


ii


Table of Contents

Cautionary Note Regarding Forward-Looking Statements

Certain statements in this prospectus, any accompanying prospectus supplement and the documents incorporated by reference herein and therein may constitute “forward-looking statements” for purposes of the federal securities laws. The Company’s forward-looking statements include, but are not limited to, statements regarding its or its management team’s expectations, hopes, beliefs, intentions or strategies regarding the future. In addition, any statements that refer to projections, forecasts or other characterizations of future events or circumstances, including any underlying assumptions, are forward-looking statements. The words “anticipate,” “appear,” “approximate,” “believe,” “continue,” “could,” “estimate,” “expect,” “foresee,” “intends,” “may,” “might,” “plan,” “possible,” “potential,” “predict,” “project,” “seek,” “should,” “would” and similar expressions (or the negative version of such words or expressions) may identify forward-looking statements, but the absence of these words does not mean that a statement is not forward-looking. Forward-looking statements in this prospectus may include, for example, statements about:


the expected benefits of the Business Combination;


the Company’s financial performance following the Business Combination;


changes in the Company’s strategy, future operations, financial position, estimated revenues and losses, projected costs, margins, cash flows, prospects and plans;


the impact of health epidemics, including the COVID-19 pandemic, on the Company’s business and the actions the Company may take in response thereto;


expansion plans and opportunities; and


the outcome of any known and unknown litigation and regulatory proceedings.

These forward-looking statements are based on information available as of the date of this prospectus, and current expectations, forecasts and assumptions, and involve a number of judgments, risks and uncertainties. Accordingly, forward-looking statements should not be relied upon as representing the Company’s views as of any subsequent date, and the Company does not undertake any obligation to update forward-looking statements to reflect events or circumstances after the date they were made, whether as a result of new information, future events or otherwise, except as may be required under applicable securities laws.

As a result of a number of known and unknown risks and uncertainties, the Company’s actual results or performance may be materially different from those expressed or implied by these forward-looking statements. Some factors that could cause actual results to differ include:


the risk that the recently consummated Business Combination disrupts current plans and operations of the Company;


the ability to recognize the anticipated benefits of the Business Combination, which may be affected by, among other things, competition and the ability of the combined business to grow and manage growth profitably;


costs related to the Business Combination, including costs associated with reporting requirements of a public company under the Exchange Act of 1934, as amended (the “Exchange Act”), the Sarbanes-Oxley Act of 2002 (“Sarbanes-Oxley”), and the rules and regulations of the applicable listing standards of the NYSE;


changes in applicable laws or regulations;


the effect of the COVID-19 pandemic on the Company’s business;


the possibility that the Company may be adversely affected by other economic, business, and/or competitive factors, including changes in interest rates;


the inability to maintain the listing of the Company’s shares of Class A Common Stock or Warrants on the NYSE; and


other risks and uncertainties set forth in the the section entitled “Risk Factors” included elsewhere in this prospectus.


iii


Table of Contents

SUMMARY

This summary highlights selected information appearing elsewhere in this prospectus or the documents incorporated by reference herein. Because it is a summary, it may not contain all of the information that may be important to you. To understand this offering fully, you should read this entire prospectus, the registration statement of which this prospectus is a part and the documents incorporated by reference herein carefully, including the information set forth under the heading “Risk Factors” and our financial statements.

The Company

Finance of America is a vertically integrated, diversified lending platform that connects borrowers with investors. We operate our Company with the goal of minimizing risk; we offer a diverse set of high-quality consumer loan products and distribute that risk to investors for an up-front cash profit and typically some future performance-based participation. We believe we have a differentiated, less volatile strategy than monoline mortgage lenders who focus on originating interest rate sensitive traditional mortgages and retain significant portfolios of mortgage servicing rights with large potential future advancing obligations. In addition to our profitable lending operations, we provide a variety of services to lenders through our Lender Services segment, which augments our lending profits with an attractive fee-oriented revenue stream.

Background

On April 1, 2021, Replay domesticated into a Delaware limited liability company and consummated a series of transactions that resulted in the combination of Replay with FoA, pursuant to the Transaction Agreement following its approval at the Shareholders Meeting. As a result of the Business Combination, the Company became a publicly-traded company on the NYSE and controls FoA in an “UP-C” structure.

In connection with the Closing, each Ordinary Share issued and outstanding immediately prior to the Domestication converted into a Replay LLC Unit and then converted into the right to receive shares of Class A Common Stock. In addition, in connection with the Domestication and as a result of the approval of an amendment to the Replay Warrant Agreement, the Warrants automatically converted, on a one-for-one basis, into Warrants to purchase Replay LLC Units, and upon the effectiveness of the Replay Merger, each such Warrant automatically converted into one Warrant to purchase a share of Class A Common Stock. In connection with the closing of the Business Combination, the Private Placement Warrants owned by the Sponsor were cancelled in exchange for 775,000 Ordinary Shares (which ultimately converted into 775,000 shares of Class A Common Stock).

Our Class A Common Stock and our Warrants are currently traded on the NYSE under the symbols “FOA” and “FOA.WS,” respectively.

The rights of holders of our Class A Common Stock and Warrants are governed by our amended and restated certificate of incorporation, our amended and restated bylaws and the Delaware General Corporation Law (the “DGCL”), and in the case of the Warrants, the Replay Warrant Agreement, as amended by the Assignment, Assumption and Amendment Agreement, dated as of April 1, 2021, by and among Replay, the Company and Continental Stock Transfer & Trust Company (as amended, the “Warrant Agreement”). See the sections entitled “Description of Securities” and “Selling Securityholders—Material Relationships with Selling Securityholders.”


1


Table of Contents

Implications of Being an Emerging Growth Company

We are an “emerging growth company” as defined in Section 2(a) of the Securities Act of 1933, as amended (the “Securities Act”), as modified by the Jumpstart Our Business Startups Act of 2012 (the “JOBS Act”). As an emerging growth company, we may take advantage of specified reduced disclosure and other requirements that are otherwise applicable generally to public companies that are not emerging growth companies. These provisions include:


presentation of only two years of audited financial statements and only two years of related management’s discussion and analysis of financial condition and results of operations in this prospectus;


reduced disclosure about our executive compensation arrangements;


no non-binding stockholder advisory votes on executive compensation or golden parachute arrangements;


exemption from any requirement of the Public Company Accounting Oversight Board regarding mandatory audit firm rotation or a supplement to the auditor’s report providing additional information about the audit and the financial statements (i.e., an auditor discussion and analysis); and


exemption from the auditor attestation requirement in the assessment of our internal control over financial reporting.

We may take advantage of these exemptions until December 31, 2026 or such earlier time that we are no longer an emerging growth company. We will cease to be an emerging growth company upon the earliest of: (1) December 31, 2026; (2) the first fiscal year after our annual gross revenues are $1.07 billion or more; (3) the date on which we have, during the previous three-year period, issued more than $1.0 billion in non-convertible debt securities; or (4) the date on which we are deemed to be a “large accelerated filer” under the Exchange Act. We may choose to take advantage of some but not all of these reduced disclosure obligations in future filings. If we do, the information that we provide stockholders may be different than you might get from other public companies in which you hold stock.

Investment Risks

An investment in shares of our Class A Common Stock and Warrants involves substantial risks and uncertainties that may materially adversely affect our business, financial condition and results of operations and cash flows. Some of the more significant challenges and risks relating to an investment in our company include, among other things, the following:


The COVID-19 pandemic poses unique challenges to our business and the effects of the pandemic could adversely impact our ability to originate and service mortgages, manage our portfolio of assets and provide lender services and could also adversely impact our counterparties, liquidity and employees.


Our business is significantly impacted by interest rates. Changes in prevailing interest rates or U.S. monetary policies that affect interest rates may have a detrimental effect on our business.


Our geographic concentration could materially and adversely affect us if the economic conditions in our current markets should decline or we could face losses in concentrated areas due to natural disasters.


2


Table of Contents
   

We use estimates in measuring or determining the fair value of the majority of our assets and liabilities. If our estimates prove to be incorrect, we may be required to write down the value of these assets or write up the value of these liabilities, which could adversely affect our business, financial condition and results of operations.


If we are unable to obtain sufficient capital to meet the financing requirements of our business, or if we fail to comply with our debt agreements, our business, financing activities, financial condition and results of operations will be adversely affected.


A disruption in the secondary home loan market, including the mortgage-backed securities (“MBS”) market, could have a detrimental effect on our business.


Finance of America Reverse LLC’s (“FAR”) status as an approved non-supervised Federal Housing Administration (“FHA”) mortgagee and an approved Government National Mortgage Association (“Ginnie Mae”) issuer, and Finance of America Mortgage LLC’s (“FAM”) status as an approved seller-servicer for Federal National Mortgage Association (“Fannie Mae”) and Federal Home Loan Mortgage Corp. (“Freddie Mac”), an approved Ginnie Mae issuer and an approved non-supervised FHA and U.S. Department of Veterans Affairs (“VA”) mortgagee, are subject to compliance with each of their respective guidelines and other conditions they may impose, and the failure to meet such guidelines and conditions could have a material adverse effect on our overall business and our financial position, results of operations and cash flows.


The engagement of our Lender Services business by our loan originator businesses may give appearance of a conflict of interest.


Third party customers of our Lender Services Businesses may be concerned about conflicts of interest within our Lender Services Businesses, due to their affiliation with the Company.


Our Lender Services business has operations in the Philippines that could be adversely affected by changes in political or economic stability or by government policies.


We operate in heavily regulated industries, and our mortgage loan origination and servicing activities (including lender services) expose us to risks of noncompliance with an increasing and inconsistent body of complex laws and regulations at the U.S. federal, state and local levels.


We are subject to legal proceedings, federal or state governmental examinations and enforcement investigations from time to time. Some of these matters are highly complex and slow to develop, and results are difficult to predict or estimate.


Unlike competitors that are national banks, our lending subsidiaries are subject to state licensing and operational requirements that result in substantial compliance costs.


Our substantial leverage could adversely affect our financial condition, our ability to raise additional capital to fund our operations, our ability to operate our business, our ability to react to changes in the economy or our industry or our ability to pay our debts, and could divert our cash flow from operations to debt payments.


The Company is a holding company and its only material asset is its interest in FoA, and it is accordingly dependent upon distributions from FoA to pay taxes, make payments under the Tax Receivable Agreements (as defined below) and pay dividends.


Due to the listing of the Company’s Class A Common Stock on the NYSE, the Company is a “controlled company” within the meaning of NYSE rules and, as a result, qualifies for exemptions from certain corporate governance requirements. The stockholders of the Company do not have the same protections afforded to stockholders of companies that are subject to such requirements.


3


Table of Contents

Please see “Risk Factors” for a discussion of these and other factors you should consider before making an investment in shares of our Class A Common Stock.

Additional Information

Our principal executive offices are located at 909 Lake Carolyn Parkway, Suite 1550, Irving, Texas 75039. Our telephone number is (972) 865-8114. Our website address is www.financeofamerica.com. Information contained on our website or connected thereto does not constitute part of, and is not incorporated by reference into, this prospectus or the registration statement of which it forms a part.


4


Table of Contents

The Offering


Issuer

Finance of America Companies Inc.


Shares of Class A Common Stock Offered by us

Up to 14,374,971 shares of Class A Common Stock issuable upon exercise of the Warrants.


Shares of Class A Common Stock Offered by the Selling Securityholders

Up to 186,461,906 shares.


Shares of Class A Common Stock Outstanding Prior to Exercise of All Warrants as of May 24, 2021

64,140,214 shares.


Shares of Class A Common Stock Outstanding Assuming Exercise of All Warrants as of May 24, 2021

78,515,185 shares.


Use of proceeds

We will not receive any proceeds from the sale of shares of Class A Common Stock by the Selling Securityholders. We will receive up to an aggregate of approximately $165.3 million from the exercise of the Warrants, assuming the exercise in full of all of the Warrants for cash. We expect to use the net proceeds from the exercise of the Warrants for general corporate purposes. See “Use of Proceeds.”


Dividend Policy

The declaration, amount and payment of any future dividends will be at the sole discretion of our board of directors. Our board of directors may take into account general economic and business conditions, our financial condition and operating results, our available cash and current and anticipated cash needs, capital requirements, contractual, legal, tax and regulatory restrictions and implications on the payment of dividends by us to our stockholders or by our subsidiaries (including FoA) to us, and such other factors as our board of directors may deem relevant. Shares of Class B common stock will not entitle their holders to any dividends.


  Finance of America Companies Inc. is a holding company and has no material assets other than its equity interest in FoA. We intend to cause FoA to make distributions to us in an amount sufficient to cover cash dividends, if any, declared by us. If FoA makes such distributions to Finance of America Companies Inc., the other holders of FoA Units will be entitled to receive equivalent pro rata distributions.


Market for Common Stock and Warrants

Our Class A Common Stock and Warrants are currently traded on the NYSE under the symbols “FOA” and “FOA.WS,” respectively.


Risk factors

See “Risk Factors” and other information included in this prospectus for a discussion of factors you should consider before investing in our securities.


5


Table of Contents

In this prospectus, unless otherwise indicated, the number of shares of Class A Common Stock outstanding as of May 24, 2021 and the other information based thereon does not reflect:


21,250,000 shares of Class A Common Stock and FoA Units reserved for issuance under the 2021 Omnibus Incentive Plan.


18,000,000 shares of Class A Common Stock and FoA Units issuable to the Sellers as an additional earnout payment in connection with the Business Combination (the “Earnout Securities”) consisting of:


9,000,000 Earnout Securities, in the aggregate, in the event that the average trading price of the Class A Common Stock is $12.50 or greater for any 20 trading days within a period of 30 consecutive trading days prior to the sixth anniversary of the Closing (the date when the foregoing is first satisfied, the “First Earnout Achievement Date”); and


9,000,000 Earnout Securities, in the aggregate, in the event that the average trading price of the Class A Common Stock is $15.00 or greater for any 20 trading days within a period of 30 consecutive trading days prior to the sixth anniversary of the Closing (the date when the foregoing is first satisfied, the “Second Earnout Achievement Date”).


Such Earnout Securities will also be issued under certain circumstances if an agreement with respect to a sale of the Company is entered into prior to the sixth anniversary of the Closing. If the First Earnout Achievement Date or the Second Earnout Achievement Date, as applicable, or a sale of the Company that results in vesting of such shares has not occurred prior to the sixth anniversary of the Closing, the applicable Earnout Securities will not be issuable.


4,258,500 shares of Class A Common Stock held by the Sponsor that are subject to vesting and forfeiture in accordance with the following terms and consitions:


Upon the First Earnout Achievement Date (should it occur), 35% of the unvested shares as of immediately prior to the Closing will vest;


Upon the Second Earnout Achievement Date (should it occur), 25% of the unvested shares as of immediately prior to the Closing will vest; and


Such shares will also vest under certain circumstances if an agreement with respect to a sale of the Company is entered into prior to the sixth anniversary of the Closing. If the First Earnout Achievement Date or the Second Earnout Achievement Date, as applicable, or a sale of the Company that results in vesting of such shares has not occurred prior to the sixth anniversary of the Closing, the applicable shares that were eligible to vest will not vest and will be forfeited.

For additional information concerning the offering see “Plan of Distribution.”


6


Table of Contents

RISK FACTORS

The following risk factors apply to the business and operations of the Company. These risk factors are not exhaustive, and investors are encouraged to perform their own investigation with respect to the business, financial condition and prospects of the Company and our business, financial condition and prospects. You should carefully consider the following risk factors in addition to the other information included in this prospectus, including matters addressed in the section entitled “Cautionary Note Regarding Forward-Looking Statements.” We may face additional risks and uncertainties that are not presently known to us, or that we currently deem immaterial, which may also impair our business or financial condition. The following discussion should be read in conjunction with our and the Company’s financial statements and notes to the financial statements included herein. For the purposes of the following risk factors, “the Company,” “we,” “us” or “our” refers to the Company and its subsidiaries, collectively.

Risks Related to the Business of the Company

Risks Related to COVID-19

The COVID-19 pandemic poses unique challenges to our business and the effects of the pandemic could adversely impact our ability to originate and service mortgages, manage our portfolio of assets and provide lender services and could also adversely impact our counterparties, liquidity and employees.

On March 13, 2020, the World Health Organization declared SARS-CoV-2, and the related disease it causes in humans (“COVID-19”) a pandemic. This outbreak of COVID-19 has led and is likely to continue to lead to disruptions in the global securities markets and capital markets and the economies of all nations where COVID-19 has arisen and may in the future arise, and is resulting in adverse impacts on the global economy in general. The economic impact of COVID-19 has led to extreme volatility in the stock market and capital markets. In March 2020, the U.S. Federal Reserve took emergency action to further cut its benchmark rate down to a range of between 0% and 0.25%, to inject additional funds into the short-term lending markets and to implement quantitative easing and other measures to support financial institutions, other businesses and the credit markets. In addition, beginning in March 2020, the U.S. Federal Reserve in conjunction with the Treasury Department announced an extensive series of measures to provide liquidity and support the economy. Although it cannot be predicted, additional action by the U.S. Federal Reserve as well as other federal and state agencies is possible.

The long-term impacts of the social, economic and financial disruptions caused by the COVID-19 pandemic are unknown. While the U.S. Federal Reserve, the U.S. government and other governments have implemented unprecedented financial support or relief measures in response to concerns surrounding the economic effects of the COVID-19 pandemic, the likelihood of such measures calming the volatility in the financial markets or preventing a long-term national or global economic downturn cannot be predicted.

The federal government has enacted a series of laws, including the Coronavirus Aid, Relief and Economic Security Act (the “CARES Act”), providing for economic relief to states, businesses and individuals affected by COVID-19. Some of these laws create burdens on employers for compliance with respect to their employees. Failure to comply with these laws could create liability on the part of the Company.

Additionally, in 2020, the U.S. federal government, as well as many state and local governments adopted a number of emergency measures and recommendations in response to the COVID-19 outbreak, including imposing travel bans, “shelter in place” restrictions, curfews, banning large gatherings, closing non-essential businesses, and generally promoting social distancing (including in the workplace, which has resulted in a significant increase in employees working remotely). Although certain states and localities have begun easing some of these measures and providing recommendations regarding recommencing economic activity, there have been recent upticks in cases in many locations across the world, resulting in new or renewed


7


Table of Contents

restrictions. It cannot be predicted whether there will be increased outbreaks in the future, or whether such outbreaks would result in new restrictions. The COVID-19 outbreak (and any future outbreaks of COVID-19) and resulting emergency measures has led (and may continue to lead) to significant disruptions in the global supply chain, global capital markets, and the economy of the United States. Concern about the potential effects of the COVID-19 outbreak and the effectiveness of measures being put in place by governmental bodies and reserve banks at various levels as well as by private enterprises (such as workplaces and schools) to contain or mitigate its spread has adversely affected economic conditions and capital markets globally.

Our Company and many of our counterparties have transitioned all or a substantial portion of their operations to remote working environments (as a result of state or local requirements or otherwise in response to COVID-19). Our work-from-home environment is anticipated to continue through the second quarter of 2021, with certain exceptions. While the Company has not seen reduced productivity from this transition to work from home, there can be no assurance that such transition of material business operations will not have an adverse effect on our Company in the long term. Specifically, recruiting, vetting and training employees is more difficult in a work-from-home environment. The ongoing nature of the COVID-19 outbreak could also adversely impact the continued service and availability of skilled personnel, including our executive officers and other members of our management team, employees at our origination and servicing businesses and the servicers and subservicers that we engage and other third-party vendors. To the extent our service partners and vendors, management or other personnel, are impacted in significant numbers by the outbreak and are not available to conduct work, our business and operating results could be negatively impacted. The extent of the spread of COVID-19, as well as the effects on the world and local economies, including the credit and capital markets, is not quantifiable as of the date of this prospectus.

We are subject to guidelines issued by the Federal Housing Finance Agency (the “FHFA”), U.S. Department of Housing and Urban Development (“HUD”) and/or the Government-Sponsored Enterprises (“GSEs”) in connection with management and servicing of mortgage loans insured by such agency or sold through a GSE sponsored securitization or on a whole loan basis to the related GSE. HUD and the GSEs have taken several actions in response to the COVID-19 pandemic to provide temporary relief and protections for homeowners facing financial hardship due to the COVID-19 pandemic including, without limitation, by announcing foreclosure and eviction moratoriums and forbearance on borrower payment of mortgage loans, and by providing mortgage servicers with an expanded set of loss mitigation tools to help homeowners. Further, HUD and the GSEs have also enacted servicing and origination related waivers and provided for alternative methods to conduct certain origination and servicing practices (for example, such as those relating to notaries, inspections, and appraisals) to address concerns relating to the COVID-19 pandemic. While HUD and the GSE have continued to extend the dates for various moratoriums and continued to allow alternatives to servicing and origination practices, no assurance can be given as to how long they will continue to make such extensions and allowances.

We believe that we have effective systems in place for identifying and implementing changes in agency policies and procedures. However, any changes to the rules applying to origination and servicing of both traditional and reverse mortgages insured by HUD and the origination and servicing of loans sold to or backed by Fannie Mae and Freddie Mac may increase the risk to our Company of originating and servicing these loans, which make up a majority of our Company’s loan production. The forbearance requirements and the moratoria on foreclosures may delay foreclosure and recovery timelines, potentially increasing expense and reducing income to our Company. Further, no assurance can be given as to how the moratoria will affect the Company’s (and its various subservicers’ and subcontractors’) ability to service the mortgage loans once the moratoria are lifted, in particular, with respect to reverse mortgage loans where HUD timelines are applicable for liquidating non-performing assets. See “—Risks Related to our Lending Businesses—FAR’s status as an approved non-supervised FHA mortgagee and an approved Ginnie Mae issuer, and FAM’s status as an approved seller-servicer for Fannie Mae and Freddie Mac, an approved Ginnie Mae issuer and an approved non-supervised FHA and VA mortgagee, are subject to compliance with each of their respective guidelines and other conditions they


8


Table of Contents

may impose, and the failure to meet such guidelines and conditions could have a material adverse effect on our overall business and our financial position, results of operations and cash flows.”

It is unclear how many borrowers have been adversely affected by the COVID-19 pandemic. It is expected that many borrowers will be (or continue to be) adversely affected by the COVID-19 pandemic. As a result, borrowers may not and/or may be unable to meet their payment obligations under the mortgage loans, which may result in shortfalls in distributions of interest and/or and losses on the loans. Shortfalls and losses will be particularly pronounced to the extent that the related mortgaged properties are located in geographic areas with significant numbers of COVID-19 cases or relatively restrictive COVID-19 countermeasures. Some borrowers may seek forbearance arrangements at some point in the near future (if they have not already made such request). It is possible that a significant number of borrowers will not make timely payments on their mortgage loans at some point during the continuance of the COVID-19 pandemic. In response, we may implement a range of actions with respect to affected borrowers and the related mortgage loans to forbear or extend or otherwise modify the loan terms consistent with our customary servicing practices. With respect to FAM, approximately 0.93% of our serviced mortgage loans by units (0.9% of our serviced mortgage loans by unpaid principal balance (“UPB”)) are in forbearance as of December 31, 2020.

In response to the COVID-19 pandemic and related business closures, numerous states and other jurisdictions have imposed moratoria on foreclosures and evictions as well. Our Company intends to comply (and to cause its subservicers to comply) with any such foreclosure and eviction restrictions or moratoriums, if applicable, as well as any related guidelines imposed by applicable law or regulatory authorities or otherwise in accordance with accepted servicing practices, and may, in the future, choose to offer other loss mitigation options to avoid such borrowers going into foreclosure. Any of these types of laws, regulations, rules, moratoria or proceedings could result in substantial delays in, or prevention of, the foreclosure process, and may lead to increased reimbursable servicing expenses, reduced proceeds from further depressed home prices and additional defaults. The moratoria on evictions extends to landlords in leased properties as well; these may adversely impact performance of our mortgages on investor-owned residential properties, since the underlying tenants may cease to make rental payments and cannot be evicted. In this event, our borrower would face reduced cash flows and be more likely to default.

There can be no assurance that any measures undertaken by the federal government, or by state or local governments, will be effective to mitigate the impact of the COVID-19 outbreak. There is little certainty as to when the COVID-19 outbreak will abate, or when and to what extent the United States economy will fully recover from the disruption caused by the COVID-19 outbreak. If the COVID-19 pandemic significantly worsens, we or our counterparties may experience further disruptions, such as impacts on access to capital and funding sources, temporary closure of offices, suspension of services and/or unusually high volume of borrower defaults, which may materially and adversely affect our business, financial condition, results of operations or ability to perform under the transaction documents. The duration of any such business disruptions and related financial or commercial impact cannot be reasonably estimated at this time, but may materially affect such parties’ ability to operate their respective business and result in additional costs.

Risks Related to Our Business and Industry

Our business is significantly impacted by interest rates. Changes in prevailing interest rates or U.S. monetary policies that affect interest rates may have a detrimental effect on our business.

Our financial performance is directly affected by changes in prevailing interest rates. Our financial performance may decrease or be subject to substantial volatility because of changes in prevailing interest rates. Due to the unprecedented events surrounding the COVID-19 pandemic along with the associated severe market dislocation, there is an increased degree of uncertainty and unpredictability concerning current interest rates, future interest rates and potential negative interest rates.


9


Table of Contents

With regard to the portion of our business that focuses on refinancing existing mortgages, the refinance market generally experiences more significant fluctuations than the purchase market as a result of interest rate changes. Long-term residential mortgage interest rates have been at or near record lows for an extended period, but they may increase in the future. As interest rates rise, refinancing generally becomes a smaller portion of the market as fewer consumers are interested in refinancing their mortgages. With regard to our purchase mortgage loan business, higher interest rates may also reduce demand for purchase mortgages as home ownership becomes more expensive. This could adversely affect our revenues or require us to increase marketing expenditures in an attempt to increase or maintain our volume of mortgages. Currently, with sustained low interest rates, refinancing transactions are expected to decline over time, as many clients and potential clients have already taken advantage of the low interest rates. Additionally, an increase in interest rates may over time cause a decrease in the price that the primary issuance market would pay for a given Home Equity Conversion Mortgage-Backed Securities (“HMBS”) or other securitization and could result in a decrease in gain on the securitization earned.

Changes in interest rates are also a key driver of the performance of our servicing business, particularly because the value of our mortgage servicing rights (“MSR”) portfolio is highly sensitive to changes in interest rates. Historically, the value of MSRs has increased when interest rates rise as higher interest rates lead to decreased prepayment rates, and has decreased when interest rates decline as lower interest rates lead to increased prepayment rates. As a result, decreases in interest rates could have a detrimental effect on the valuation of our MSRs.

Borrowings under our warehouse facilities and other financing lines of credit are generally at variable rates of interest, which also expose us to interest rate risk. If interest rates increase, our debt service obligations on certain of our variable-rate indebtedness will increase even though the amount borrowed remains the same, and our net income and cash flows, including cash available for servicing our indebtedness, will correspondingly decrease. We generally use interest rate swaps or other derivative instruments that involve the exchange of floating for fixed-rate interest payments to reduce interest rate volatility. However, we may not maintain interest rate swaps with respect to all of our variable-rate indebtedness, and any such swaps may not fully mitigate our interest rate risk, may prove disadvantageous or may create additional risks. See “—Risks Related to Our Lending Businesses—Our hedging strategies may not be successful in mitigating our risks associated with changes in interest rates.”

In addition, our business is materially affected by the monetary policies of the U.S. government and its agencies. For instance, Fannie Mae and Freddie Mac began charging lenders an “adverse market refinance fee” or “market condition credit fee” of 0.50% on certain refinancings of mortgage loans beginning in December 2021. We are also particularly affected by the policies of the U.S. Federal Reserve, which influence interest rates and impact the size of the loan origination market. In response to the COVID-19 pandemic in 2020, the U.S. Federal Reserve announced programs to increase its purchase of certain MBS products mortgage-backed securities to sustain smooth market functioning and help foster accommodative financial conditions, thereby supporting the flow of credit to households and businesses. The duration of these U.S. Federal Reserve programs is unknown at this time; a reversal of this policy could have a negative impact on the liquidity of MBS in the future.

Our geographic concentration could materially and adversely affect us if the economic conditions in our current markets should decline or we could face losses in concentrated areas due to natural disasters.

Based on data from CoreLogic, the California mortgage market represents approximately 20% of the entire market in the United States. For the year ended December 31, 2020, 46% of our originations in mortgage, reverse, and commercial loans (by UPB) were secured by properties in the state of California. As a result of this geographic concentration, our results of operations are largely dependent on economic conditions in this area. Decreases in real estate values could adversely affect the value of property used as collateral for loans to our borrowers and adverse changes in the economy caused by inflation, recession, unemployment, state or local real estate laws and regulations or other factors beyond our control may also continue to have a negative side effect on the ability of borrowers to make timely mortgage or other loan payments, which would have an adverse


10


Table of Contents

impact on earnings. Consequently, deterioration in economic conditions in California could have a material adverse impact on the quality of our loan portfolio, which could result in increased delinquencies, decreased interest income results as well as an adverse impact on loan loss experience with probable increased allowance for loan losses. Such deterioration also could disproportionately impact the demand for our products and services as compared to other lenders with more geographically diversified operations, and, accordingly, further negatively affect results of operations.

In addition, properties located in California may be more susceptible to certain natural disasters, such as wildfires and mudslides, and certain natural disasters not covered by standard hazard insurance, such as earthquakes. Even for properties located in an earthquake prone area, we and other lenders in the market area may not require earthquake insurance as a condition of making a loan. If there is a major earthquake, fire, mudslide, or other natural disaster, we face the risk that many of our borrowers may experience uninsured property losses, or sustained job interruption and/or loss which may materially impair their ability to meet the terms of their loan obligations. Any such natural disasters could materially increase our costs of servicing and also disrupt our ability to make loans in such region. See “—Our business is subject to the risks of earthquakes, fires, floods and other natural catastrophic events and to interruption by man-made issues such as strikes and civil unrest.”

We use estimates in measuring or determining the fair value of the majority of our assets and liabilities. If our estimates prove to be incorrect, we may be required to write down the value of these assets or write up the value of these liabilities, which could adversely affect our business, financial condition and results of operations.

We use financial models that utilize, wherever possible, market participant data to value certain of our assets and liabilities, including warrants arising out of the merger with Replay Acquisition Corp., our mortgage loans held for investment, MSRs and HMBS related obligations for purposes of financial reporting. We also use models to estimate the change in value of loans held for investments due to market or model input assumptions as an addback to calculate Adjusted EBITDA. These models are complex and use asset-specific collateral data and market inputs for interest and discount rates. In addition, the models are complex because of the high number of variables that drive cash flows in each of the respective assets and related liabilities.

Our ability to measure and report our financial position and operating results is influenced by the need to estimate the impact or outcome of future events based on information available at the time of our financial statements. Further, some of our loans and financial assets held for investment do not trade in an active market with readily observable prices and therefore, their fair value is determined using valuation models that calculate the present value of estimated net future cash flows, using estimates of draws or advances, prepayment speeds, home price appreciation, forward interest rates, loss rates, discount rates, cost to service, float earnings, contractual servicing fee income and ancillary income and late fees.

Fair value determinations require many assumptions and complex analyses, especially to the extent there are not active markets for identical assets. Even if the general accuracy of our valuation models is validated, valuations are highly dependent upon the reasonableness of our assumptions and the predictability of the relationships that drive the results of the models. In particular, models are less dependable when the economic environment is outside of historical experience, as was the case from 2008-2010 or during the present COVID-19 pandemic.

If the assumptions we use in our models prove to be inaccurate, if market conditions change or if errors are found in our models or weaknesses in our model governance, we may be required to write down the value of such assets or the value of certain of our assets may decrease, which could adversely affect our business, financial condition and results of operations. The fair value of the assets and liabilities related to our securitizations rely on forward rates of interest. Further, the durations of assets and liabilities may not match, resulting in sensitivities to specific portions of the forward curve for interest rates. If these assumptions prove to be wrong or the market for interest rates changes, we may be required to write down the net value of our securitizations.


11


Table of Contents

We continue to monitor the markets and make necessary adjustments to our models and apply appropriate management judgment in the interpretation and adjustment of the results produced by our models. This process takes into account updated information while maintaining controlled processes for model updates, including model development, testing, independent validation and implementation. As a result of the time and resources, including technical and staffing resources, that are required to perform these processes effectively, it may not be possible to replace existing models quickly enough to ensure that they will always properly account for the impacts of recent information and actions.

Our business could suffer if we fail to attract, or retain, highly skilled employees, and changes in our executive management team may be disruptive to our business.

Our future success will depend on our ability to identify, hire, develop, motivate and retain highly qualified and skilled personnel for all areas of our organization. Trained and experienced personnel in the mortgage industry are in high demand and may be in short supply. Companies with which we compete may be able to offer more attractive terms of employment. In addition, we invest significant time and expense in training our employees, which increases their value to competitors who may seek to recruit them. We may not be able to attract, develop and maintain the skilled workforce necessary to operate our businesses, and labor expenses may increase as a result of a shortage in the supply of qualified personnel.

Additionally, the experience of our executive management team is a valuable asset to us. Our executive management team has significant experience in the financial services industry and would be difficult to replace. Disruptions in management continuity could result in operational or administrative inefficiencies and added costs, which could adversely impact our business, financial condition and results of operations, and may make recruiting for future management positions more difficult or costly. We cannot assure you that we will be able to attract and retain key personnel or members of our executive management team, which may impede our ability to implement our current strategy or take advantage of strategic acquisitions or other growth opportunities that may be presented to us, which could materially affect our business, financial condition and results of operations. Additionally, to the extent our personnel and members of our executive management team are impacted in significant numbers by the outbreak of pandemic or epidemic disease, such as the COVID-19 pandemic, our business and operating results may be negatively impacted.

Our failure to implement and maintain effective internal control over financial reporting could require us to restate financial statements and cause investors to lose confidence in our reported financial information.

As a public company, we are subject to the reporting requirements of the Exchange Act, Sarbanes-Oxley, and the rules and regulations of the applicable listing standards of the NYSE. We expect that the requirements of these rules and regulations will continue to increase our legal, accounting and financial compliance costs, make some activities more difficult, time-consuming and costly, and place significant strain on our personnel, systems and resources. Sarbanes-Oxley requires, among other things, that we maintain effective disclosure controls and procedures and internal control over financial reporting.

We are continuing to improve our internal control over financial reporting. In order to develop, maintain and improve the effectiveness of our disclosure controls and procedures and internal control over financial reporting, we have expended, and anticipate that we will continue to expend, significant resources, including accounting-related and audit-related costs and significant management oversight. Our internal controls, including any new controls that we develop, may become inadequate because of changes in conditions in our business. Further, weaknesses in our disclosure controls and internal control over financial reporting may be discovered in the future. Any failure to maintain effective disclosure controls and internal control over financial reporting could have a material and adverse effect on our business, results of operations and financial condition and could cause a decline in the trading price of our securities.


12


Table of Contents

We may fail to identify or adequately assess the magnitude of certain liabilities, shortcomings or other circumstances prior to acquiring or investing in a company or business, including potential exposure to regulatory sanctions or liabilities resulting from an acquisition target’s previous activities, internal controls and security environment.

The risks associated with acquisitions include, among others:


failing to identify or adequately assess the magnitude of certain liabilities, shortcomings or other circumstances prior to acquiring or investing in a company, including potential exposure to regulatory sanctions or liabilities resulting from an acquisition target’s previous activities, internal controls and information security environment;


significant costs and expenses, including those related to retention payments, equity compensation, severance pay, intangible asset amortization and asset impairment charges, assumed litigation and other liabilities, and legal, accounting and financial advisory fees;


unanticipated issues in integrating information, management style, controls and procedures, servicing practices, communications and other systems including information technology systems;


unanticipated incompatibility of purchasing, logistics, marketing and administration methods;


failing to retain key employees or clients;


inaccuracy of valuation and/or operating assumptions supporting our purchase price; and


representation and warranty liability relating to a target’s previous lending activities.

Before making acquisitions, we conduct due diligence that we deem reasonable and appropriate based on the known facts and circumstances applicable to each acquisition, and we negotiate purchase agreements which we believe adequately protect us from undisclosed—and frequently, disclosed—existing liabilities. Nevertheless, we cannot be certain that the due diligence investigation that we carry out with respect to any acquisition opportunity will reveal or highlight all relevant facts that may be necessary or helpful in evaluating the target. As a result, we may fail to identify or adequately assess the magnitude of certain liabilities, shortcomings or other circumstances prior to acquiring, investing in or partnering with a company, including potential exposure to regulatory sanctions or liabilities resulting from an acquisition target’s previous activities, internal controls and security environment. For example, in December 2018, FAM agreed to pay $14.5 million to fully resolve allegations that its predecessor violated the False Claims Act by knowingly originating and underwriting deficient mortgage loans insured by HUD. All loans at issue were originated prior to our acquisition of FAM, and the seller indemnified us and paid the full settlement amount. Additionally, in March 2020, FAR signed a Settlement Agreement with the U.S. Department of Justice (“DOJ”) and HUD’s Office of Inspector General agreeing to pay $2.47 million to fully resolve allegations relating to loans originated by our predecessor company in 2007-2009. While this matter is subject to an indemnification claim against the seller, it illustrates that unanticipated liabilities associated with acquisitions or the inability to successfully collect on our indemnification claims could have a material adverse effect on our business.

Our capital investments in technology may not achieve anticipated returns.

Our business is becoming increasingly reliant on technology investments, and the returns on these investments are not always predictable. We are currently making, and will continue to make, significant technology investments to support our service offerings and to implement improvements to our customer-facing technology and information processes in order to more efficiently operate our business and remain competitive and relevant to our customers. These technology initiatives might not provide the anticipated benefits or may provide them on a delayed schedule or at a higher cost. Selecting the wrong technology, failing to adequately support development and implementation, or failing to adequately oversee third party service providers, could result in damage to our competitive position and adversely impact our business, financial condition and results of operations.


13


Table of Contents

A security breach or a cyber-attack could adversely affect our results of operations and financial condition.

We collect and store certain personal and financial information from customers, employees, and other third parties. Security breaches or cyber-attacks involving our systems or facilities, or the systems or facilities of our service providers, could expose us to a risk of loss of personally identifiable information of customers, employees and third parties or other confidential, proprietary or competitively sensitive information, which could potentially have an adverse impact on our future business with current and potential customers, results of operations and financial condition.

We rely on encryption and other information security technologies licensed from third parties to provide security controls necessary to help in securing online transmission of confidential information pertaining to customers, employees and other aspects of our business. A failure in our information security technologies may result in a compromise or breach of the technology that we use to protect sensitive data. A party who is able to circumvent our security measures by methods such as hacking, fraud, trickery or other forms of deception could access sensitive personal and financial information or cause interruption in our operations. We may be required to expend capital and other resources to protect against such security breaches or cyber-attacks or to remediate problems caused by such breaches or attacks. Our security measures are designed to protect against security breaches and cyber-attacks, but our failure to prevent such security breaches and cyber-attacks could subject us to liability, decrease our profitability and damage our reputation. Even if a failure of, or interruption in, our systems or facilities is resolved timely or an attempted cyber incident or other security breach is successfully avoided or thwarted, it may require us to expend substantial resources or to take actions that could adversely affect customer satisfaction or behavior and expose us to reputational harm.

We could also be subjected to cyber-attacks that could result in slow performance and loss or temporary unavailability of our information systems. Information security risks have increased because of new technologies, the use of the internet and telecommunications technologies (including mobile devices) to conduct financial and other business transactions, and the increased sophistication and activities of organized crime, perpetrators of fraud, hackers, terrorists, and others. We may not be able to anticipate or implement effective preventative measures against all security breaches of these types, especially because the techniques used change frequently and because attacks can originate from a wide variety of sources.

The occurrence of any of these events could adversely affect our business, results of operations and financial condition.

Technology disruptions or failures, including a failure in our operational or security systems or infrastructure, or those of third parties with whom we do business, could disrupt our business, cause legal or reputational harm and adversely impact our results of operations and financial condition.

We are dependent on the secure, efficient, and uninterrupted operation of our technology infrastructure, including computer systems, related software applications and data centers, as well as those of certain third parties and affiliates. Our websites and computer/telecommunication networks must accommodate a high volume of traffic and deliver frequently updated information, the accuracy and timeliness of which is critical to our business. Our technology must be able to facilitate a loan application experience that equals or exceeds the experience provided by our competitors. We have or may in the future experience service disruptions and failures caused by system or software failure, fire, power loss, telecommunications failures, team member misconduct, human error, computer hackers, computer viruses and disabling devices, malicious or destructive code, denial of service or information, as well as natural disasters, terrorism, war, health pandemics and other similar events, and our disaster recovery planning may not be sufficient for all situations. This is especially applicable in the current response to the COVID-19 pandemic and the shift we have experienced in having most of our employees work from their homes for the time being, as our employees access our secure networks through their home networks. The implementation of technology changes and upgrades to maintain current and integrate new technology systems may also cause service interruptions. Any such disruption could interrupt or delay our ability to provide services to our clients and loan applicants, and could also impair the ability of third parties to provide critical services to us.


14


Table of Contents

Our business is subject to the risks of earthquakes, fires, floods and other natural catastrophic events and to interruption by man-made issues such as strikes and civil unrest.

Our systems and operations are vulnerable to damage or interruption from earthquakes, fires, floods, power losses, telecommunications failures, strikes, health pandemics and similar events. Disease outbreaks have occurred in the past, and any prolonged occurrence of infectious disease or other adverse public health developments could have a material adverse effect on the macro economy and/or our business operations. We believe that our risks in this area are somewhat mitigated due to the lack of concentration of our employees or business in one building or metro area; however, this geographic diversity may make us more vulnerable to disruptions in technology. See “—Technology disruptions or failures, including a failure in our operational or security systems or infrastructure, or those of third parties with whom we do business, could disrupt our business, cause legal or reputational harm and adversely impact our results of operations and financial condition.” In addition, strikes and other geopolitical unrest could cause disruptions in our business and lead to interruptions, delays or loss of critical data. We may not have sufficient protection or recovery plans in certain circumstances, and our business interruption insurance may be insufficient to compensate us for losses that may occur.

These types of catastrophic events may also affect loan origination which have been locked and loans which we are holding for sale or investment. Such events could also affect our loan servicing costs, increase our recoverable and our non-recoverable servicing advances, increase servicing defaults and negatively affect the value of our MSRs. We may also incur losses when a borrower passes away prior to completing repairs following a natural disaster, because we are required to reduce our claim to FHA by the unrepaired damage amount. Mortgagee properties securing loans which we make are required to be covered by hazard insurance customary to the area in which the property is located. In certain areas, such as California, earthquake insurance is not required by HUD or other lenders generally. There could also be circumstances where insurance premiums have not been timely paid, or the insurance coverage otherwise fails. In these events, we could suffer losses. For loans which have been sold, we would be exposed to such losses generally only if we have breached a representation or warranty under the related purchase and sale agreement. However, in cases where we have retained some credit risk, we could suffer losses. In addition, catastrophic events often lead to increased delinquencies, which create additional risk for us. For example, FAR has suffered losses and faced increased costs following a series of natural disasters in Puerto Rico, including Hurricane Maria in 2017. See “—A significant increase in delinquencies on the mortgage loans we originate could have a material impact on our revenues, expenses and liquidity and on the valuation of our MSR portfolio.”

Climate change increases the risk/severity of weather-related natural disasters which can lead to more frequent and higher losses, lack of affordable insurance for borrowers, uninsured flood losses (the National Flood Insurance Program caps at $250,000), and longer timelines to liquidate or assign loans to HUD.

Our risk management efforts may not be effective.

We could incur substantial losses and our business operations could be disrupted if we are unable to effectively identify, manage, monitor, and mitigate financial risks, such as credit risk, interest rate risk, prepayment risk, liquidity risk, and other market-related risks, as well as operational and legal risks related to our business, assets, and liabilities. We are also subject to various laws, regulations and rules that are not industry specific, including employment laws related to employee hiring, termination, and pay practices, health and safety laws, environmental laws and other federal, state and local laws, regulations and rules in the jurisdictions in which we operate. Our risk management policies, procedures, and techniques may not be sufficient to identify all of the risks to which we are exposed, mitigate the risks we have identified, or identify additional risks to which we may become subject in the future. Expansion of our business activities may also result in our being exposed to risks to which we have not previously been exposed or may increase our exposure to certain types of risks, and we may not effectively identify, manage, monitor, and mitigate these risks as our business activities change or increase.


15


Table of Contents

Risks Related to Our Lending Businesses

If we are unable to obtain sufficient capital to meet the financing requirements of our business, or if we fail to comply with our debt agreements, our business, financing activities, financial condition and results of operations will be adversely affected.

We require significant leverage in order to fund mortgage originations, make servicing advances and finance our investments. Accordingly, our ability to fund our mortgage originations, to make servicing advances and to continue investments depends on our ability to secure financing on acceptable terms and to renew and/or replace existing financings as they expire. These financings may not be available on acceptable terms or at all. If we are unable to obtain these financings, we may need to raise the funds we require in the capital markets or through other means, any of which may increase our cost of funds.

As of December 31, 2020, we have entered into 33 warehouse lines of credit, MSR lines of credit, and other secured lines of credit, with an aggregate of $5,038.7 million in borrowing capacity. See “Management’s Discussion and Analysis of Financial Condition and Results of Operations—Summary of Certain Indebtedness.” These financing facilities typically contain, and we expect that other financing facilities that we may enter into in the future will typically contain, covenants that, among other things, require us to satisfy minimum tangible or adjusted tangible net worth, maximum leverage ratio of total liabilities (which may include off-balance sheet liabilities) or indebtedness to tangible or adjusted tangible net worth, minimum liquidity or minimum liquid assets and minimum net income or pre-tax net income. As a result of market disruptions and fair value accounting adjustments taken in March 2020 resulting from the COVID-19 pandemic, our commercial loan origination subsidiary was in violation of its first and second quarter 2020 profitability covenants with two of its warehouse lenders. We received waivers of these covenants violations from both lenders as well as amendments to profitability covenants for the remaining two quarters of 2020 but there is no assurance that lenders would provide waivers for any future covenant violations. We were not in compliance with the April 2020 $145 million commercial warehouse facility’s profitability covenant for the quarter ended September 30, 2020, and we received a waiver from the lender in connection therewith effective as of September 30, 2020. As of December 31, 2020, we were in compliance with all other financial covenants. If we fail to meet or satisfy any of these covenants, we would be in default under these agreements and our lenders could elect to declare all amounts outstanding under the agreements to be immediately due and payable, enforce their respective security interests under such agreements and restrict our ability to make additional borrowings. In addition, our financing agreements may contain other events of default and cross-default provisions, so that if a default occurs under any one agreement, the lenders under certain other agreements could also declare a default. Our financings also have fair value risk pursuant to which our lending counterparties have the right to value the related collateral. In the event the market value of the collateral decreases (typically as determined by the related lender) and a borrowing base deficiency exists, the related lender can require us to prepay the debt or require us to post additional margin as collateral at any time during the term of the related agreement. There can be no assurance that we will be in compliance with our covenants or other requirements under our financing facilities in the future.

We are generally required to renew a significant portion of our debt financing arrangements each year, which exposes us to refinancing and interest rate risks. Furthermore, our counterparties are not required to renew or extend our repurchase agreements or other financing agreements upon the expiration of their stated terms. Our ability to refinance existing debt (including refinancing existing securitization debt) and borrow additional funds is affected by a variety of factors including:


the available liquidity in the credit markets;


prevailing interest rates;


an event of default, a negative ratings action by a rating agency and limitations imposed on us under the agreements governing our current debt that contain restrictive covenants and borrowing conditions that may limit our ability to raise additional debt;


16


Table of Contents
   

the strength of the lenders from which we borrow and the amount of borrowing such lenders will or may legally permit to our various businesses taken a whole; and


limitations on borrowings imposed by the amount of eligible collateral pledged, which may be less than the borrowing capacity of the facility.

In the event that any of our loan funding facilities is terminated or is not renewed, or if the principal amount that may be drawn under our funding agreements that provide for immediate funding at closing were to significantly decrease, we may be unable to find replacement financing on commercially favorable terms, or at all. This could have a material adverse effect on our business, liquidity, financial condition, cash flows and results of operations. Further, if we are unable to refinance or obtain additional funds for borrowing (including through the securitization markets), our ability to maintain or grow our business could be limited.

If we are unable to obtain sufficient capital on acceptable terms for any of the foregoing reasons, this could adversely affect our business, financing activities, financial condition and results of operations.

A disruption in the secondary home loan market, including the MBS market, could have a detrimental effect on our business.

Demand in the secondary market and our ability to complete the sale or securitization of our home loans depends on a number of factors, many of which are beyond our control, including general economic conditions, general conditions in the banking system, the willingness of lenders to provide financing for home loans, the willingness of investors to purchase home loans and MBS, and changes in regulatory requirements. Disruptions in the general MBS market may occur, including, but not limited to in response to the COVID-19 pandemic. Any significant disruption or period of illiquidity in the general MBS market could directly affect our liquidity because no existing alternative secondary market would likely be able to accommodate on a timely basis the volume of loans that we typically sell in any given period. Accordingly, if the MBS market experiences a period of illiquidity, we might be prevented from selling the loans that we produce into the secondary market in a timely manner or at favorable prices, which could be detrimental to our business, including, but not limited to, increasing our cost of funds due to extended dwell time on our warehouse lines, and a negative impact on our liquidity due to write-downs on the value of the loans held on our balance sheet, and the application of large haircuts due to longer dwell times.

FAR’s status as an approved non-supervised FHA mortgagee and an approved Ginnie Mae issuer, and FAM’s status as an approved seller-servicer for Fannie Mae and Freddie Mac, an approved Ginnie Mae issuer and an approved non-supervised FHA and VA mortgagee, are subject to compliance with each of their respective guidelines and other conditions they may impose, and the failure to meet such guidelines and conditions could have a material adverse effect on our overall business and our financial position, results of operations and cash flows.

FAR’s status as an approved non-supervised FHA mortgagee and an approved Ginnie Mae issuer and FAM’s status as an approved seller-servicer for Fannie Mae and Freddie Mac, an approved and an approved non-supervised FHA and VA mortgagee, are subject to compliance with each agency’s respective regulations, guides, handbooks, mortgagee letters and all participants’ memoranda. As a Ginnie Mae issuer, FAR must meet certain minimum capital requirements, including, but not limited to: (i) Ginnie Mae’s requirement that non-depository institutions hold equity capital in the amount of at least 6% of total assets, which technical non-compliance was the result of a change in accounting for HMBS transactions, and (ii) Fannie Mae’s minimum acceptable capital requirement of a 6% minimum tangible capital ratio. Any loss of FAR’s status as a non-supervised FHA mortgagee or an approved Ginnie Mae issuer, of FAM’s status as an approved seller- servicer for Fannie Mae and Freddie Mac, an approved and an approved non-supervised FHA and VA mortgagee, could have a material adverse effect on our overall business and our financial position, results of operations and cash flows.


17


Table of Contents

We are required to follow specific guidelines and eligibility standards that impact the way we service and originate GSE and U.S. government agency loans, including guidelines and standards with respect to:


credit standards for mortgage loans;


our staffing levels and other servicing practices;


the servicing and ancillary fees that we may charge;


our modification standards and procedures;


the amount of reimbursable and non-reimbursable advances that we may make; and


the types of loan products that are eligible for sale or securitization.

These guidelines provide the GSEs and other government agencies with the ability to provide monetary incentives for loan servicers that perform according to their standards for origination and servicing, and to assess penalties for those that do not. At the direction of the FHFA, Fannie Mae and Freddie Mac have aligned their guidelines for servicing delinquent mortgages, which could result in monetary incentives for servicers that perform well and to assess compensatory penalties against servicers in connection with the failure to meet specified timelines relating to delinquent loans and foreclosure proceedings, and other breaches of servicing obligations. We generally cannot negotiate these terms with the agencies, and they are subject to change at any time without our specific consent. A significant change in these guidelines that decreases the fees we charge or requires us to expend additional resources to provide mortgage services could decrease our revenues or increase our costs.

In addition, changes in the nature or extent of the guarantees provided by Fannie Mae, Freddie Mac, Ginnie Mae, the U.S. Department of Agriculture (“USDA”) or the VA, or the insurance provided by the FHA, or coverage provided by private mortgage insurers, could also have broad adverse market implications. Any future increases in guarantee fees by the agencies, the VA or USDA, or increases in the premiums we are required to pay to the FHA or private mortgage insurers for mortgage insurance, could increase mortgage origination costs and insurance premiums for our clients. These industry changes could negatively affect demand for our mortgage services and consequently our origination volume, which could be detrimental to our business. We cannot predict whether the impact of any proposals to move Fannie Mae and Freddie Mac out of conservatorship would require them to increase their fees. For example, on August 12, 2020, Freddie Mac announced that as a result of risk management and loss forecasting precipitated by COVID-19 related economic and market uncertainty, they were introducing a new “market condition credit fee” of 50 basis points for refinanced mortgage loans (with certain exceptions). Similarly, on August 12, 2020, Fannie Mae announced that in light of market and economic uncertainty resulting in higher risk and costs incurred by Fannie Mae, they were implementing a new loan-level price adjustment (“LLPA”) equal to 50 basis points for refinanced mortgage loans (with certain exceptions) on or after September 1, 2020, and loans delivered into MBS pools with issue dates on or after September 1, 2020. While the implementation date for such fees was delayed to December 1, 2021 by both GSEs, such fees have increased the price of GSE loans, and could result in decreased borrower demand for GSE loans.

Our loan origination and servicing revenues are highly dependent on macroeconomic and U.S. residential real estate market conditions.

Our success depends largely on the health of the U.S. residential real estate industry, which is seasonal, cyclical, and affected by changes in general economic conditions beyond our control. Economic factors such as increased interest rates, slow economic growth or recessionary conditions, the pace of home price appreciation or the lack of it, changes in household debt levels, and increased unemployment or stagnant or declining wages affect our clients’ ability to purchase homes or to refinance. National or global events affect macroeconomic conditions. Weak or significant deterioration in economic conditions reduce the amount of disposable income consumers have, which in turn reduces consumer spending and the willingness of qualified potential clients to take out loans. Such economic factors affect loan origination volume. Excessive home building or historically


18


Table of Contents

high foreclosure rates resulting in an oversupply of housing in a particular area may depress to value of homes, potentially increasing the risk of loss on defaulted mortgage loans.

Recently, financial markets have experienced significant volatility as a result of the effects of the COVID-19 pandemic. In the second quarter of 2020, many state and local jurisdictions enacted measures requiring closure of businesses and other economically restrictive efforts to combat the COVID-19 pandemic. The federal government initially responded by adopting a series of measures designed to protect the economy; however, many of the earlier benefits have been exhausted. The full impact of the COVID-19 pandemic on the economy may not be realized for months, or even years. There may be a significant increase in the rate and number of mortgage payment delinquencies, and house sales, home prices, and multifamily fundamentals may be adversely affected, leading to an overall material adverse decrease on our mortgage origination activities. See “—The COVID-19 pandemic poses unique challenges to our business and the effects of the pandemic could adversely impact our ability to originate mortgages, manage our portfolio of assets and provide lender services; our servicing operations; counterparties; liquidity and employees.”

Furthermore, several state and local governments in the United States are experiencing, and may continue to experience, budgetary strain, which will be exacerbated by the impact of COVID-19. One or more states or significant local governments could default on their debt or seek relief from their debt under the U.S. bankruptcy code or by agreement with their creditors. Any or all of the circumstances described above may lead to further volatility in or disruption of the credit markets at any time and adversely affect our financial condition.

Any uncertainty or deterioration in market conditions, including changes caused by COVID-19, that leads to a decrease in loan originations will result in lower revenue on loans sold into the secondary market. Lower loan origination volumes generally place downward pressure on margins, thus compounding the effect of the deteriorating market conditions. Such events could be detrimental to our business. Moreover, any deterioration in market conditions that leads to an increase in loan delinquencies will result in lower revenue for loans we service for the GSEs and Ginnie Mae because we collect servicing fees from them only for performing loans, and may delay collection of servicing fees from some securitizations. Additionally, it is not clear if we will be able to collect such ancillary fees for delinquencies relating to the COVID-19 pandemic as the federal and state legislation and regulations responding to the COVID-19 pandemic continue to evolve.

Additionally, origination of purchase money loans is seasonal. Historically, our purchase money loan origination activity is larger in the second and third quarters of the year, as home buyers tend to purchase their homes during the spring and summer in order to move to a new home before the start of the school year. As a result, our loan origination revenues vary from quarter to quarter.

Increased delinquencies may also increase the cost of servicing the loans and may result in a negative MSR if the cost of servicing the loans exceeds the servicing fees. The decreased cash flow from lower servicing fees could decrease the estimated value of our MSRs, resulting in recognition of losses when we write down those values. In addition, an increase in delinquencies lowers the interest income we receive on cash held in collection and other accounts and increases our obligation to advance certain principal, interest, tax and insurance obligations owed by the delinquent mortgage loan borrower.

Any of the circumstances described above, alone or in combination, may lead to volatility in or disruption of the credit markets at any time and may have a detrimental effect on our business.

We face competition that could adversely affect us and we may not be able to maintain or grow the volumes in our loan origination businesses.

We compete with many third-party businesses in originating traditional, reverse and commercial mortgages and providing certain lender services. Some of our competitors may have more name recognition and greater financial and other resources than we have, including better access to capital. Competitors who originate mortgage loans to retain for investment may have greater flexibility in approving loans.


19


Table of Contents

In our traditional mortgage business, we operate at a competitive disadvantage to federally chartered depository institutions because they enjoy federal preemption. As a result, they conduct their business under relatively uniform U.S. federal rules and standards and are not subject to licensing and certain consumer protection laws of the states in which they do business. Unlike our federally chartered competitors, we are generally subject to all state and local laws applicable to lenders in each jurisdiction in which we originate and service loans. Depository institutions also enjoy regular access to very inexpensive capital. To compete effectively, we must maintain a high level of operational, technological and managerial expertise, as well as access to capital at a competitive cost.

We cannot assure you that we will remain competitive with other originators in the future, a number of whom also compete with us in obtaining financing. In addition, other competitors with similar objectives to our own may be organized in the future and may compete with us in one or more of our business lines. These competitors may be significantly larger than us, may have access to greater capital and other resources or may have other advantages. Furthermore, some competitors may have higher risk tolerances or different risk assessments, which could allow them to consider a wider variety of investments and establish more relationships than us. We cannot assure you that the competitive pressures we face will not have a material adverse effect on our business, financial condition and results of operations.

Our hedging strategies may not be successful in mitigating our risks associated with changes in interest rates.

Our profitability is directly affected by changes in interest rates. The market value of closed loans held for sale and interest rate locks generally change along with interest rates. The value of such assets moves opposite of interest rate changes. For example, as interest rates rise, the value of existing mortgage assets falls.

We employ various economic hedging strategies to mitigate the interest rate and the anticipated loan financing probability or “pull-through risk” inherent in such mortgage assets. Our use of these hedge instruments may expose us to counterparty risk as they are not traded on regulated exchanges or guaranteed by an exchange or its clearinghouse and, consequently, there may not be the same level of protections with respect to margin requirements and positions and other requirements designed to protect both us and our counterparties. Furthermore, the enforceability of agreements underlying hedging transactions may depend on compliance with applicable statutory, commodity and other regulatory requirements and, depending on the domicile of the counterparty, applicable international requirements. Consequently, if a counterparty fails to perform under a derivative agreement we could incur a significant loss.

Our hedge instruments are accounted for as free-standing derivatives and are included on our consolidated balance sheet at fair market value. Our operating results could be negatively affected because the losses on the hedge instruments we enter into may not be offset by a change in the fair value of the related hedged transaction.

Our hedging strategies also require us to provide cash margin to our hedging counterparties from time to time. The Financial Industry Regulatory Authority, Inc. requires us to provide daily cash margin to (or receive daily cash margin from, depending on the daily value of related MBS) our hedging counterparties from time to time. The collection of daily margin between us and our hedging counterparties could, under certain MBS market conditions, adversely affect our short-term liquidity and cash-on-hand. Additionally, our hedge instruments may expose us to counterparty risk—the possibility that a loss may occur from the failure of another party to perform in accordance with the terms of the contract, which loss exceeds the value of existing collateral, if any.

A portion of our assets consist of MSRs, which may fluctuate in value. Although we do not currently, we may in the future hedge a portion of the risks associated with such fluctuations. There can be no assurance such hedges would adequately protect us from a decline in the value of the MSRs we own, or that a hedging strategy utilized by us with respect to our MSRs would be well-designed or properly executed to adequately address such fluctuations. A decline in the value of MSRs may have a detrimental effect on our business.


20


Table of Contents

Our hedging activities in the future may include entering into interest rate lock commitments, forward loan sale commitments, best efforts commitments, forward MBS commitments, interest rate swaps, future contracts and/or other tools and strategies. These hedging decisions will be determined in light of the facts and circumstances existing at the time and may differ from our current hedging strategy. These hedging strategies may be less effective than our current hedging strategies in mitigating the risks described above, which could be detrimental to our business and financial condition.

We have third-party secondary marketing risks and counterparty risks (including mortgage loan brokers) which could have a material adverse effect on our business, liquidity, financial condition and results of operation.

Secondary Marketing Risks: We provide representations and warranties to purchasers and insurers of the loans and in connection with our securitization transactions, as well as indemnification for losses resulting from breaches of representations and warranties. In the event of a breach, we may be required to repurchase a mortgage loan or indemnify the purchaser, and any subsequent loss on the mortgage loan may be borne by us. While our contracts vary, they generally contain broad representations and warranties, including but not limited to representations regarding loan quality and underwriting (including compliant appraisals, calculations of income and indebtedness, and occupancy of the mortgaged property); securing of adequate mortgage and title insurance within a certain period after closing; and compliance with regulatory requirements. We may also be required to repurchase loans if the borrower fails to make certain loan payments due to the purchaser, typically for the first 1-3 payments due to purchaser. These obligations are affected by factors both internal and external in nature, including, the volume of loan sales and securitizations, to whom the loans are sold and the terms of our purchase and sale agreements, the parties to whom our purchasers sell the loans subsequently and the terms of those agreements, actual losses on loans which have breached representations and warranties, our success rate at curing deficiencies or appealing repurchase demands, our ability to recover any losses from third parties, the overall economic condition in the housing market, the economic condition of borrowers, the political environment at investor agencies and the overall U.S. and world economies. Many of the factors are beyond our control and may lead to judgments that are susceptible to change. See “—A significant increase in delinquencies on the mortgage loans we originate could have a material impact on our revenues, expenses and liquidity and on the valuation of our MSR portfolio.”

When engaging in securitization transactions, we also prepare marketing and disclosure documentation, including term sheets, offering documents, and prospectuses, that include disclosures regarding the securitization transactions and the assets being securitized. If our marketing and disclosure documentation is alleged or found to contain material inaccuracies or omissions, we may be liable under federal and state securities laws (or under other laws) for damages to third parties that invest in these securitization transactions, including in circumstances where we relied on a third party in preparing accurate disclosures, or we may incur other expenses and costs in connection with disputing these allegations or settling claims. We have also engaged in selling or contributing loans to third parties who, in turn, have securitized those loans. In these circumstances, we have in the past and may in the future also prepare marketing and disclosure documentation, including documentation that is included in term sheets, offering documents, and prospectuses relating to those securitization transactions. We could be liable under federal and state securities laws (or under other laws) or contractually for damages to third parties that invest in these securitization transactions, including liability for disclosures prepared by third parties or with respect to loans that we did not sell or contribute to the securitization.

Additionally, we typically retain various third-party service providers when we engage in securitization transactions, including underwriters or initial purchasers, trustees, administrative and paying agents, and custodians, among others. We frequently contractually agree to indemnify these service providers against various claims and losses they may suffer in connection with the provision of services to us and/or the securitization trust. To the extent any of these service providers are liable for damages to third parties that have invested in these securitization transactions, we may incur costs and expenses as a result of these indemnities.


21


Table of Contents

Third Party Loan Broker Risk: The brokers through whom we originate have parallel and separate legal obligations to which they are subject. While these laws may not explicitly hold the originating lenders responsible for the legal violations of such brokers, U.S. federal and state agencies could impose such liability. The DOJ, through its use of a disparate impact theory under the FHA, is actively holding home loan lenders responsible for the pricing practices of independent third-party brokers, alleging that the lender is directly responsible for the total fees and charges paid by the borrower even if the lender neither dictated what the broker could charge nor kept the money for its own account. In addition, under TILA (as defined below), and the TILA-RESPA (as defined below) Integrated Disclosure rule, we may be held responsible for improper disclosures made to clients by brokers. We may be subject to claims for fines or other penalties based upon the conduct of the independent home loan brokers with which we do business.

Counterparty Credit Risks: We are exposed to counterparty credit risk in the event of non-performance by counterparties to various agreements, including our lenders, servicers and hedge counterparties. Although certain warehouse and other financing facilities lines are committed, we may experience a disruption in operations due to a lender withholding funding of a borrowing requested on the respective financing facility.

Any of the above could adversely affect our business, liquidity, financial condition and results of operations.

We have risks related to our Subservicers which could have a material adverse effect on our business, liquidity, financial condition and results of operation.

Each of our lending businesses acts as named servicer with respect to MSRs that we retain or acquire or otherwise for loans that we are required to service (including as an issuer of Ginnie Mae securities) and in each such case, the related business contracts with various third parties (collectively, the “Subservicers”) for the subservicing of the loans. In addition, we engage Subservicers to service loans which we hold on our balance sheet. These subservicing relationships present a number of risks to us. FAR has contracted with Compu-Link Corporation (d/b/a Celink), a Michigan corporation (“Celink”), as a subservicer to perform reverse mortgage servicing functions on our behalf. FAM has contracted with Loan Care, LLC, a Virginia limited liability company, and ServiceMac, LLC (the “Traditional Servicers”) as subservicers to perform traditional mortgage servicing functions on our behalf. Loan Care, LLC currently services the majority of our traditional servicing book, but we anticipate using both of them in the future. FACo has contracted with Servis One, Inc. d/b/a BSI Financial Services, Specialized Loan Servicing LLC and Fay Servicing, LLC, each, a Delaware limited liability company (the “Commercial Servicers”), as subservicers to perform commercial mortgage servicing functions. We agree to indemnify our Subservicers for any losses resulting from their subservicing of the mortgage loans in accordance with the related subservicing agreement (so long as such loss does not result from a breach of the related Subservicer under the related subservicing agreement). To the extent that we do not have a right to reimburse ourselves for the same amounts under our servicing agreements or if there are insufficient collections in respect of the mortgage loans for such reimbursements, we may face losses in our servicing business.

We rely on Celink to subservice all of our reverse mortgage portfolio, including the Home Equity Conversion Mortgages (“HECM”) portfolio. Failure by Celink to meet the requirements of the HUD servicing guidelines can result in the assessment of fines and loss of reimbursement of loan related advances, expenses, interest and servicing fees. Moreover, if Celink is not vigilant in encouraging borrowers to make their real estate tax and property insurance premium payments, the borrowers may be less likely to make these payments, which could result in a higher frequency of default for failure to make these payments. If Celink misses HUD and Ginnie Mae timelines for liquidating non-performing assets, loss severities may be higher than originally anticipated, and we may be subject to penalties by HUD and Ginnie Mae, including curtailment of interest. If fines or any amounts lost are not recovered from Celink, such events frequently lead to the eventual realization of a loss by us.

In our reverse mortgage business, we believe the number of viable subservicers with the requisite Ginnie Mae authority and experience is limited. Unless more subservicers enter this space, the quality of


22


Table of Contents

subservicing practices may deteriorate, and we could have limited options in the event of subservicer failure. The failure of a subservicer to effectively service the HECM and proprietary jumbo reverse mortgage loans we own or the loans underlying the Agency HMBS and non-Agency HMBS we issue and hold in our portfolio or sell to third parties could have a material and adverse effect on our business and our financial condition.

Failure by the Traditional Servicers to meet stipulations of the Fannie Mae and Freddie Mac servicing guidelines, when applicable, including forbearance requirements issued as a result of COVID-19, can result in the assessment of fines and loss of reimbursement of loan related advances, expenses, interest and servicing fees. The Traditional Servicers have obligations to promptly apply payments received from borrowers, to properly manage and reconcile tax and insurance escrow accounts, and to comply with obligations to pay taxes and insurance in a timely manner for escrowed accounts. If the Traditional Servicers are not vigilant in encouraging borrowers to make their monthly payments or to keep their hazard insurance premiums or property taxes current, the borrowers may be less likely to make these payments, which could result in a higher frequency of default. If the Traditional Servicers take longer to mitigate losses or liquidate non-performing assets, loss severities may be higher than originally anticipated. If fines or any amounts lost are not recovered from Traditional Servicers, such events frequently lead to the eventual realization of a loss by us.

Failure by the Commercial Servicers to meet stipulations of the servicing and securitization agreements can result in the loss of reimbursement of loan related advances, expenses, interest and servicing fees.

If any of our Subservicers fails to perform its duties pursuant to its related subservicing agreement, our business acting as the named servicer (or for balance sheet loans, the owner of the loan) will be required to perform the servicing functions previously performed by such subservicer or cause another subservicer to perform such duties, to the extent required pursuant to the related servicing agreement. The process of transitioning the functions performed by our Subservicer to a successor subservicer could result in delays in collections and other functions performed by our Subservicer and expose our business to breach of contract and indemnity claims relating to its servicing obligations. Such delays may also adversely affect the value of the residual interests that we own in our securitizations and loans. If any of our Subservicers experiences financial difficulties, including as a result of a bankruptcy, it may not be able to perform its subservicing duties under the related subservicing agreement. There can be no assurance that each of our Subservicers will remain solvent or that such Subservicer will not file for bankruptcy at any time. Any such financial difficulties, insolvency or bankruptcy could have a negative impact on our business.

The recovery process against a Subservicer can be prolonged and is subject to our meeting minimum loss deductibles under the indemnification provisions in our agreements with the Subservicer. The time may be extended as the Subservicer has the right to review underlying loss events and our request for indemnification. The amounts ultimately recovered from the Subservicers may differ from our estimated recoveries recorded based on the Subservicers’ interpretation of responsibility for loss, which could lead to our realization of additional losses. We are also subject to counterparty risk for collection of amounts which may be owed to us by a Subservicer. For example, Reverse Mortgage Solutions (“RMS”), who previously serviced a significant amount of loans for FAR, filed for Chapter 11 bankruptcy protection on February 11, 2019. RMS subsequently rejected its subservicing agreement with FAR. FAR has filed a claim in the RMS bankruptcy for losses and potential future losses resulting from RMS’ failure to service loans in accordance with the terms of the subservicing agreement, and while a recovery is anticipated, it will be far less than the estimated current and future losses.

Our Subservicers may also be required to be licensed under applicable state law, and they are subject to various federal and state laws and regulations, including regulation by the Consumer Financial Protection Bureau (the “CFPB”). (See “Legal and Regulatory Risks—We operate in heavily regulated industries, and our mortgage loan origination and servicing activities (including lender services) expose us to risks of noncompliance with an increasing and inconsistent body of complex laws and regulations at the U.S. federal, state and local levels.”) Failure of the Subservicers to comply with applicable laws and regulations may expose them to fines, responsibility for refunds to borrowers, loss of licenses needed to conduct their business, and third party


23


Table of Contents

litigation, all of which may adversely impact the Subservicers’ ability to perform their responsibilities under the related subservicing agreement. Such occurrences may also impact their financial condition and ability to provide indemnification as agreed in our subservicing agreement. In addition, regulators or third parties may take the position that we were responsible for the Subservicers’ actions or failures to act; in that event, we might be exposed to the same risks as the Subservicers.

Reputational harm, including as a result of our actual or alleged conduct or public opinion, could adversely affect our business, results of operations, and financial condition.

Reputational risk is inherent in our business. Negative public opinion can result from our actual or alleged conduct in any number of activities, including loan origination, loan servicing, debt collection practices, corporate governance and other activities. Negative public opinion can also result from actions taken by government regulators and community organizations in response to our activities, from consumer complaints, including in the CFPB complaints database, from litigation filed against us, and from media coverage, whether accurate or not.

The reverse mortgage origination business as a whole had reputational issues arising after 2007, when home values were decreasing nationwide, and the only products available to consumers were HECM products. Prior to 2015, HECM products were not underwritten to confirm the ability of borrowers to pay taxes and insurance; while the proceeds provided initial cash benefits to the borrowers, if they ultimately were unable or unwilling to pay property taxes and insurance, foreclosures for default would result, and eventually the reverse mortgage borrowers—who by definition, were 62 or older—would be evicted. In addition, for various reasons, borrowers would sometimes not have their spouses on the reverse mortgage, with the result that when the borrower died, the non-borrowing spouse would be facing a due-and-payable balance which they often were not able to refinance. Because absent an event of default, reverse mortgages only become due and payable upon the death of the borrower, and the estate or heirs may not be engaged in the post-termination resolution of the reverse mortgage, reverse mortgages end with foreclosure more often than traditional mortgages. Those public filings are aggregated and come under scrutiny by agenda-driven groups who may not understand that the borrower is not being evicted and simply believe they have spotted a pattern of foreclosure for this type of loan. These issues led to adverse publicity in the reverse mortgage industry. The issuance of specific regulations and guidance requiring that borrowers be clearly informed regarding their obligations to pay taxes and insurance during the application process and the requirement of “financial assessment” by HUD starting in 2015 have greatly decreased the risks of default due to failure to pay taxes and insurance. HUD also provided clear guidance regarding both underwriting and servicing of loans involving non-borrower spouses, significantly decreasing the risks of those situations. FAR’s policy is to follow all applicable marketing guidance and regulations. FAR requires pre-application HUD counseling for non-agency reverse mortgages, and also underwrites these loans for the borrower’s willingness and ability to pay property taxes and hazard insurance premiums. In addition, for non-agency reverse mortgages, FAR has more latitude to employ a variety of loss mitigation solutions to avoid foreclosure when the borrower is still living in the home. Nevertheless, there may be situations where foreclosure is the only resolution to the loan. Foreclosures where the reverse mortgage borrower is still living in the home—or even when the borrower is no longer occupying the home—may lead to increased reputational risk. In addition, negative publicity due to actions by other reverse mortgage lenders could cause regulatory focus on our business as well.

We have historically sold our traditional mortgage loans as whole loans, servicing released, or sold our mortgage servicing rights in a separate sale or co-issue at the time the loan is sold. As a result of COVID-19 and the resulting effect on the market for MSR, we started to retain servicing in March 2020. Going forward, we plan to sell the MSRs but retain the subservicing obligations. We may also retain servicing on our retail originations. We plan to service the loans in our name, using a subservicer for many of the tasks associated with servicing. If there are significant delinquencies in the mortgage portfolio which we service, there are likely to be increased numbers of loans upon which we will be required to foreclose. Larger numbers of foreclosures will increase reputational risk in the mortgage area.


24


Table of Contents

Large-scale natural or man-made disasters may lead to further reputational risk in the servicing area. Mortgage properties are generally required to be covered by hazard insurance in an amount sufficient to cover repairs to or replacement of the residence. However, when a large scale disaster occurs, such as Hurricanes Harvey and Maria in 2017, the demand for inspectors, appraisers, contractors and building supplies may exceed availability, insurers and mortgage servicers may be overwhelmed with inquiries, mail service and other communications channels may be disrupted, borrowers may suffer loss of employment and unexpected expenses which cause them to default on payments and/or renders them unable to pay deductibles required under the insurance policies, and widespread casualties may also affect the ability of borrowers or others who are needed to effect the process of repair or reconstruction or to execute documents. Loan originations may also be disrupted, as lenders are required to reinspect properties which may have been affected by the disaster prior to funding. In these situations, borrowers and others in the community may believe that servicers and originators are penalizing them for being the victims of the initial disaster and making it harder for them to recover, potentially causing reputational damage to us.

Moreover, the proliferation of social media websites as well as the personal use of social media by our employees and others, including personal blogs and social network profiles, also may increase the risk that negative, inappropriate or unauthorized information may be posted or released publicly that could harm our reputation or have other negative consequences, including as a result of our employees interacting with our customers in an unauthorized manner in various social media outlets.

In addition, our ability to attract and retain clients is highly dependent upon the external perceptions of our level of service, trustworthiness, business practices, financial condition and other subjective qualities. Negative perceptions or publicity regarding these matters—even if related to seemingly isolated incidents, or even if related to practices not specific to the origination or servicing of loans, such as debt collection—could erode trust and confidence and damage our reputation among existing and potential clients. In turn, this could decrease the demand for our products, increase regulatory scrutiny and detrimentally effect our business, financial condition and results of operations.

Our decentralized traditional mortgage origination branches operate under multiple brand names, which may put us at a competitive disadvantage compared with nationally branded competitors.

Our decentralized traditional mortgage origination branches operate under multiple brand names. Many of these branches have been operating locally under their branch name for many years, and they have built brand recognition on a local basis. However, a number of our mortgage origination competitors have invested considerable resources to build nationally recognized brands. Our competitors that operate under a national brand may have a competitive advantage due to name recognition. If we are unable to maintain and/or increase our name recognition under our multiple brand names in the mortgage origination market, we may experience adverse effects to our customer retention and market share.

A significant increase in delinquencies on the mortgage loans we originate could have a material impact on our revenues, expenses and liquidity and on the valuation of our MSR portfolio.

An increase in delinquency rates could adversely affect our business, financial condition and results of operations.


Revenue. An increase in delinquencies will result in lower revenue for loans we service for GSEs and Ginnie Mae through Subservicers because we only collect servicing fees from GSEs and Ginnie Mae for performing loans. In addition, an increase in delinquencies reduces cash held in collections and other accounts and lowers the interest income that we receive.


Expenses. An increase in delinquencies will result in a higher cost to service such loans due to the increased time and effort required to collect payments from delinquent borrowers and an increase in interest expense as a result of an increase in our advancing obligations.


25


Table of Contents
   

Liquidity. An increase in delinquencies could also negatively impact our liquidity because of an increase in both (i) principal and interest and (ii) servicing advances, resulting in an increase in borrowings under advance facilities and/or insufficient financing capacity to fund increases in advances. These advances also increase our expenses, as we are responsible for the interest on our borrowings under the advance facilities. See “—We are required to make servicing advances that can be subject to delays in recovery or may not be recoverable in certain circumstances.”


Valuation of MSRs. We value our MSRs based on, among other things, our projections of the cash flows from the related pool of mortgage loans. Our expectation of delinquencies is a significant assumption underlying those cash flow projections. If delinquencies were significantly greater than expected, the estimated fair value of our MSRs could be diminished. Likewise, prepayment speeds of the mortgages underlying the MSRs could impact the valuation of the MSRs if prepayment speeds increase the valuation of the MSR could decrease. If the estimated fair value of MSRs is reduced, we would record a loss which would adversely impact our ability to satisfy minimum net worth covenants and borrowing conditions in our debt agreements which could have a negative impact on our financial results.


Increased Risk of Repurchase or Indemnification Demands: Delinquencies and losses incurred by subsequent purchasers will typically result in an enhanced file review by the party who suffered the loss—which may be our counterparty, a securitization trust, or an agency—in an effort to mitigate their losses by finding justification for demand repurchase or indemnification against us. While claims based upon breaches of representations and warranties are generally subject to a statute of limitation, indemnification claims do not accrue until the loss has occurred. This has the effect of lengthening indefinitely the time in which a subsequent owner can raise such claims. As a result, FAM and FAR have received indemnification claims in the past few years which are the result of loans made by predecessor entities prior to 2009. Some of these claims have extended to include loans made and sold by entities which have never been affiliated with FAM and FAR, but may have either sold business assets to predecessor entities of FAM and FAR, or whose management was subsequently employed by the predecessor entities to FAM and FAR. These have included, for example, demands by the Lehman Brothers Holdings’ Inc. bankruptcy estate (“LBHI”), based upon LBHI’s settlements with Fannie Mae and Freddie Mac and with RMBS Trustees. JPMorgan Chase & Co. has sent a similar demand for indemnification for a settlement it entered with RMBS Trustees and monoline insurance carriers. While for these specific cases we should be indemnified by the sellers of the predecessor entities, these demands demonstrate the long tail of representation and warranty issues when a loan (or a pool of loans) results in an aggregate loss to the ultimate holder, resulting in a chain of indemnification claims. There have been some actions taken by Fannie Mae and Freddie Mac to alleviate originator concerns that loans which perform for many years and then default can result in such claims; however, significant risk remains in this area.


Credit Risk. While we generally limit our credit risk on loans, we may have two situations where we do have exposure. One is loans held for sale or investment. We may elect to hold new types of loans on our balance sheet for a period in order to earn income and extract data about how such loans perform before offering them into the market. For example, we began originating non-agency reverse mortgages in November 2014, but did not sell them to third parties until 2016. In 2020, we acquired $146.2 million in loans from FarmOp Capital LLC, and currently hold $69.1 million on our balance sheet. We typically sell new loan originations within 30 days of closing; however, there are times when we are delayed due to documentation issues, market disruptions like that caused by COVID-19, or for other reasons. If these loans become delinquent or go into default while they are on our balance sheet, we may experience losses.

In addition to whole loans which are on our balance sheet, we also hold residual strips from our securitizations. In effect, we are absorbing the first losses from these portfolios. Increased delinquencies will reduce the value and ultimately the cash flow from these residual interests.


26


Table of Contents

We are required to make servicing advances that can be subject to delays in recovery or may not be recoverable in certain circumstances.

During any period in which a borrower is not making payments on a loan we service for a third party, we are required under most of our servicing agreements to advance our own funds to meet contractual principal and interest remittance requirements, and pay property taxes and insurance premiums, legal expenses and other protective advances. We also advance funds to maintain, repair and market real estate properties. For our mortgage loans, as home values change, we may have to reconsider certain of the assumptions underlying our decisions to make advances, and in certain situations our contractual obligations may require us to make certain advances for which we may not be reimbursed. In addition, in the event a loan serviced by us defaults or becomes delinquent, or to the extent a mortgagee under such loan is allowed to enter into a forbearance by applicable law or regulation, the repayment to us of any advance related to such events may be delayed until the loan is repaid or refinanced or liquidation occurs. A delay in our ability to collect an advance may adversely affect our liquidity, and our inability to be reimbursed for an advance could be detrimental to our business. As our servicing portfolio continues to age, defaults could increase, which may increase our costs of servicing and could be detrimental to our business. Market disruptions such as the COVID-19 pandemic, relief such as the CARES Act and similar state laws including foreclosure and eviction moratoria, and the GSEs temporary period of forbearance for clients unable to pay on certain mortgage loans, may also increase the number of defaults, delinquencies or forbearances related to the loans we service, increasing the advances we make for such loans. With specific regard to the COVID-19 pandemic, any regulatory or GSE-specific relief on servicing advance obligations provided to mortgage loan servicers has so far been limited to GSE-eligible mortgage loans and does not extend to any non-GSE mortgage loan products such as jumbo mortgage loans. With respect to FAM, approximately 0.93% of our serviced mortgage loans by units (0.9% of our serviced mortgage loans by UPB) are in forbearance as of December 31, 2020.

The VA guarantee on delinquent VA guaranteed loans may not make us whole on losses or advances we may have made on the loan. If the VA determines the amount of the guarantee payment will be less than the cost of acquiring the property, it may elect to pay the VA guarantee and leave the property securing the loan with us (a “VA no-bid”). If we cannot sell the property for a sufficient amount to cover amounts outstanding on the loan we will suffer a loss which could, on an aggregate basis and if the percentage of VA no-bids increases, have a detrimental impact on our business and financial condition.

In addition, for certain traditional loans sold to Ginnie Mae, we, as the servicer, have the unilateral right to repurchase any individual loan in a Ginnie Mae securitization pool if that loan meets defined criteria, including being delinquent greater than 90 days. Once we have the unilateral right to repurchase the delinquent loan, we have effectively regained control over the loan and we must recognize the loan on our balance sheet and recognize a corresponding financial liability. For HECMs (HUD-insured reverse mortgage loans), we also have an obligation to buy loans out of the Ginnie Mae pools when the unpaid principal balance reaches 98% of the maximum claim amount. Any significant increase in required servicing advances or delinquent loan repurchases could have a significant adverse impact on our cash flows, even if they are reimbursable, and could also have a detrimental effect on our business and financial condition.

The replacement of LIBOR with an alternative reference rate may have a detrimental effect on our business.

The interest rate on the adjustable rate loans we originate and service has historically been based on the London Inter-Bank Offered Rate (“LIBOR”). In July 2017, the U.K. Financial Conduct Authority announced that it intends to stop collecting LIBOR rates from banks after 2021. The announcement indicates that LIBOR will not continue to exist on the current basis. In September 2020, Ginnie Mae announced that it will stop accepting the delivery of LIBOR-based adjustable rate traditional mortgage loans or HECMs for securitizations starting on January 1, 2021 but the announcement did not mention a potential replacement index for LIBOR. In December 2020, Ginnie Mae extended the deadline for securitization of new LIBOR-based HECMs and stated it would stop accepting deliveries of new LIBOR-based adjustable rate HECMs for its HMBS securitizations issued on or after


27


Table of Contents

March 1, 2021. It is expected that U.S.-dollar LIBOR will be replaced with the Secured Overnight Financing Rate (“SOFR”), a new index calculated by reference to short-term repurchase agreements for U.S. Treasury securities. Because there have been a few issuances utilizing SOFR or the Sterling Over Night Index Average, an alternative reference rate that is based on transactions, it is unknown whether any of these alternative reference rates will attain market acceptance as replacements for LIBOR. There is currently no definitive successor reference rate to LIBOR and various industry and governmental organizations are still working to develop workable transition mechanisms. As part of this industry transition, we will be required to migrate any current adjustable rate loans we service to any such successor reference rate. Until a successor rate is determined, we cannot complete the transition away from LIBOR for the adjustable rate loans we service. As such, we are unable to predict the effect of any changes to LIBOR, the establishment and success of any alternative reference rates, or any other reforms to LIBOR or any replacement of LIBOR that may be enacted in the United States or elsewhere. Such changes, reforms or replacements relating to LIBOR could have an adverse impact on the market for or value of any LIBOR-linked securities, loans, derivatives or other financial instruments or extensions of credit held by us. LIBOR-related changes could affect our overall results of operations and financial condition and may result in increased cost of funds under our financing arrangements. In addition, it is possible but not certain that the transition away from LIBOR will be delayed due to COVID-19. It is also unclear what the duration and severity of COVID-19 will be, and whether this will impact LIBOR transition planning. COVID-19 may also slow regulators’ and others’ efforts to develop and implement alternative reference rates, which could make LIBOR transition planning more difficult, particularly if the cessation of LIBOR is not delayed but alternatives do not develop.

Our counterparties may terminate subservicing contracts under which we conduct servicing activities.

The majority of the mortgage loans we service are serviced on behalf of Fannie Mae, Freddie Mac and Ginnie Mae. These entities establish the base service fee to compensate us for servicing loans as well as the assessment of fines and penalties that may be imposed upon us for failing to meet servicing standards.

As is standard in the industry, under the terms of our master servicing agreements with the GSEs, the GSEs have the right to terminate us as servicer of the loans we service on their behalf at any time and also have the right to cause us to transfer the MSRs to a third party. In addition, failure to comply with servicing standards could result in termination of our agreements with the GSEs with little or no notice and without any compensation. If Fannie Mae, Freddie Mac or Ginnie Mae were to terminate us as a servicer, or increase our costs related to such servicing by way of additional fees, fines or penalties, such changes could have a material adverse effect on the revenue we derive from servicing activity, as well as the value of the related MSRs. These agreements, and other servicing agreements under which we service mortgage loans for non-GSE loan purchasers, also require that we service in accordance with GSE servicing guidelines and contain financial covenants. Under our subservicing contracts, the primary servicers for which we conduct subservicing activities have the right to terminate our subservicing rights with or without cause, with little notice and little to no compensation. If we were to have our servicing or subservicing rights terminated on a material portion of our servicing portfolio, this could adversely affect our business.

Challenges to the MERS System could materially and adversely affect our business, results of operations and financial condition.

MERSCORP, Inc. is a privately held company that maintains an electronic registry, referred to as the MERS System, which tracks servicing rights and ownership of home loans in the United States. Mortgage Electronic Registration Systems, Inc. (“MERS”), a wholly owned subsidiary of MERSCORP, Inc., can serve as a nominee for the owner of a home loan and in that role initiate foreclosures or become the mortgagee of record for the loan in local land records. We have in the past and may continue to use MERS as a nominee. The MERS System is widely used by participants in the mortgage finance industry.

Several legal challenges in the courts and by governmental authorities have been made disputing MERS’s legal standing to initiate foreclosures or act as nominee for lenders in mortgages and deeds of trust


28


Table of Contents

recorded in local land records. These challenges have focused public attention on MERS and on how home loans are recorded in local land records. Although most legal decisions have accepted MERS as mortgagee, these challenges could result in delays and additional costs in commencing, prosecuting and completing foreclosure proceedings, conducting foreclosure sales of mortgaged properties and submitting proofs of claim in client bankruptcy cases.

Risks Related to Our Lender Services Businesses

The engagement of our Lender Services business by our loan originator businesses may give appearance of a conflict of interest.

Our Lender Services segment provides services to our lender business lines which could create, appear to create or be alleged to create conflicts of interest. By obtaining services from an affiliate, there is risk of possible claims of collusion, that such services are not provided by our Lender Services segment upon market terms, or that the service provider is being “controlled” by the lender. We have adopted policies, procedures and practices that are designed to identify and mitigate any such perceived conflicts of interest. For example, our Lender Services businesses are led by an experienced executive who does not report to any of the heads of the lending businesses; and the lending businesses are not required to use Lender Services (and often do not). However, there can be no assurance that such measures will be effective in eliminating all conflicts of interest or that third parties will refrain from making such inferences. Appropriately identifying and dealing with conflicts of interest is complex and difficult, and our reputation, which is one of our most important assets, could be damaged and the willingness of counterparties to enter into transactions with us may be affected if we fail, or appear to fail, to identify, disclose and deal appropriately with conflicts of interest. In addition, potential or perceived conflicts could give rise to litigation or regulatory enforcement actions.

Third party customers of our Lender Services Businesses may be concerned about conflicts of interest within our Lender Services Businesses, due to their affiliation with the Company.

Our third-party customers for the Lender Services Businesses are generally banks, savings and loans, credit unions, and independent mortgage or non-mortgage lenders. They may be concerned that information obtained by Lender Services in providing services to them is being shared with our lending businesses and used to compete with them. We are careful to preserve the confidentiality and integrity of information which our Lender Services businesses obtain in the process of providing services to our clients, and do not share this information with anyone, including our lending businesses, and we often include this representation in our contracts with lending institutions we serve. However, the perception that such sharing could occur may limit the ability of Lender Services to obtain new business.

Our Lender Services business has operations in the Philippines that could be adversely affected by changes in political or economic stability or by government policies.

Our Lender Services business operates a foreign branch in the Philippines, which is subject to relatively higher degrees of political and social instability than the United States and may lack the infrastructure to withstand political unrest or natural disasters. The political or regulatory climate in the United States, or elsewhere, also could change so that it would not be lawful or practical for us to use international operations in the manner in which we currently use them. If we had to curtail or cease operations in the Philippines and transfer some or all of these operations to another geographic area, we would incur significant transition costs as well as higher future overhead costs that could materially and adversely affect our results of operations. In many foreign countries, particularly in those with developing economies, it may be common to engage in business practices that are prohibited by laws and regulations applicable to us, such as The Foreign Corrupt Practices Act of 1977, as amended (“FCPA”). Any violations of the FCPA or local anti-corruption laws by us, our subsidiaries or our local agents could have an adverse effect on our business and reputation and result in substantial financial penalties or other sanctions.


29


Table of Contents

There is no guarantee that demand for the services offered by our Lender Services business will grow.

There is no guarantee that demand for the services offered by our Lender Services business will grow. The historical growth rate of our Lender Services business may not be an indication of future growth rates for such business generally. Although our lending businesses originate a large volume of loans, we may be unable to capture the related lending services business for these loans. For example, we may not be able to offer our title services for some of our originated loans because we may not be licensed as required in the state where the property is located. Additionally, borrowers are able to select their title company and may choose a third-party provider over us. We also face competition for our Lender Services business from third parties. If we cannot expand our services to meet the demands of this market, our revenue may decline, we may fail to grow our Lender Services business, and we may incur operating losses as a result.

Legal and Regulatory Risks

We operate in heavily regulated industries, and our mortgage loan origination and servicing activities (including lender services) expose us to risks of noncompliance with an increasing and inconsistent body of complex laws and regulations at the U.S. federal, state and local levels.

Due to the heavily regulated nature of the financial services industry, we are required to comply with a wide array of U.S. federal, state and local laws and regulations that regulate, among other things, the manner in which we conduct our loan origination, servicing and ancillary businesses and the fees that we may charge, and the collection, use, retention, protection, disclosure, transfer and other processing of personal information. Governmental authorities and various U.S. federal and state agencies have broad oversight and supervisory and enforcement authority over our businesses. From time to time, we may also receive requests (including requests in the form of subpoenas and civil investigative demands) from federal, state and local agencies for records, documents and information relating to our servicing and lending activities. The GSEs (and their conservator, the FHFA), Ginnie Mae, the United States Treasury Department, various investors, non-Agency securitization trustees and others also subject us to periodic reviews and audits. These laws, regulations and oversight can significantly affect the way that we do business, can restrict the scope of our existing businesses, limit our ability to expand our product offerings or to pursue acquisitions, or can make our costs to service or originate loans higher, which could impact our financial results. Failure to comply with applicable laws and regulatory requirements may result in, among other things, revocation of or inability to renew required licenses or registrations, loss of approval status, termination of contracts without compensation, administrative enforcement actions and fines, private lawsuits, including those styled as class actions, cease and desist orders and civil and criminal liability.

We must comply with a large number of federal, state and local consumer protection laws including, among others, the Mortgage Advertising Practices Rules and the Truth in Lending Act, as amended, together with its implementing regulations (Regulation Z) (“TILA”), the Fair Debt Collection Practices Act (“FDCPA”), the Real Estate Settlement Procedures Act, as amended, together with its implementing regulations (Regulation X) (“RESPA”), the Equal Credit Opportunity Act, as amended, together with its implementing regulations (Regulation B) (“ECOA”), the Fair Credit Reporting Act, as amended, and its implementing regulations (Regulation V) (“FCRA”), the Fair Housing Act, the Telephone Consumer Protection Act, as amended (“TCPA”), the Gramm-Leach-Bliley Act, together with its implementing regulations (Regulation P) (“GLBA”), the Electronic Funds Transfer Act, as amended, and its implementing regulations (Regulation E) (“EFTA”), the Servicemembers’ Civil Relief Act, as amended (“SCRA”), the Homeowners Protection Act, as amended (“HPA”), the Home Mortgage Disclosure Act, together with its implementing regulations (Regulation C) (“HMDA”), the S.A.F.E. Mortgage Licensing Act, as amended (the “SAFE Act”), the Federal Trade Commission Act, the Dodd-Frank Wall Street Reform and Consumer Protection Act, as amended, together with its implementing regulations (the “Dodd-Frank Act”), U.S. federal and state laws prohibiting unfair, deceptive, or abusive acts or practices and state foreclosure laws. Antidiscrimination statutes, such as the Fair Housing Act and ECOA, prohibit creditors from discriminating against loan applicants and borrowers based on certain characteristics, such as race, religion and national origin. Various federal regulatory agencies and departments,


30


Table of Contents

including the DOJ and CFPB, take the position that these laws apply not only to intentional discrimination, but also to neutral practices that have a disparate impact on a group that shares a characteristic that a creditor may not consider in making credit decisions (i.e., creditor or servicing practices that have a disproportionate negative effect on a protected class of individuals). These statutes apply to loan origination, marketing, the amount and nature of fees that may be charged for transactions and incentives, such as rebates, use of credit reports, safeguarding of non-public, personally identifiable information about our clients, foreclosure and claims handling, investment of and interest payments on escrow balances and escrow payment features, and required disclosures and notices to clients. We are also subject to the regulatory, supervisory and examination authority of the CFPB, which has oversight of federal and state non-depository lending and servicing institutions, including residential mortgage originators and loan servicers. The CFPB has rulemaking authority with respect to many of the federal consumer protection laws applicable to mortgage lenders and servicers, including TILA, RESPA, HMDA, ECOA, FCRA, GLBA and the FDCPA.

One such law, RESPA, among other provisions, prohibits the payment of fees or other things of value in exchange for referrals of real estate settlement services, which would include residential mortgage loans. RESPA expressly permits the payment of reasonable value for non-referral services and facilities actually performed and provided. When a lender seeks to rely on this exception to the anti-kickback requirements it must be prepared to demonstrate that the services or facilities for which compensation is paid are separate and distinct from any referral and the amount paid is reasonable. If the amount paid exceeds the reasonable value, the excess could be attributable to the referral. The Company, like many originating lenders, uses “marketing services agreements” and “desk rental agreements” with sources of potential loan referrals, like real estate agencies and home builders. A “marketing services agreement” is an agreement under which a lender compensates a service provider for performing actual marketing services directed to the general public. A “desk rental agreement” is the lease of office space, furniture and equipment, use of common areas, and other services, like utilities, internet, shared receptionist, and janitorial services. From a RESPA perspective, the analysis focuses on whether the general marketing services or lease of facilities are separate and distinct from any referrals that may occur, whether the services or facilities actually are being performed or provided and whether the amounts paid by the lender do not exceed the fair market value for such services and facilities. The Company uses a third party to provide independent valuation services and has an internal monitoring function to ensure the actual performance of services and provision of the leased facilities. While the Company believes that these arrangements comply with RESPA, there is no assurance that the CFPB or other governmental entity with authority to enforce RESPA or a court will share this view.

The scope of the laws and regulations and the intensity of the supervision to which our business is subject have increased over time, in response to the financial crisis in 2008 and other factors such as technological and market changes. Regulatory enforcement and fines have also increased across the banking and financial services sector. These laws are subject to changing interpretations which could have a negative impact on our business or operations. We expect that our business will remain subject to extensive regulation and supervision. These regulatory changes will result in an increase in our regulatory compliance burden and associated costs and place restrictions on our origination and servicing operations. In July 2020, it was announced that the Financial Stability Oversight Council will begin an activities-based review of the secondary mortgage market. The FHFA has expressed support for this review. This review could result in increased regulation of secondary mortgage market activities, which could have an adverse effect on our business. Our business may in the future be subject to further enhanced governmental scrutiny and/or increased regulation, including resulting from changes in U.S. executive administration or Congressional leadership.

Regulatory authorities and private plaintiffs may allege that we failed to comply with applicable laws, rules and regulations where we believe we have complied. These allegations may relate to past conduct and/or past business operations, such as the prior activity of acquired entities. Even unproven allegations that our activities have not complied or do not comply with all applicable laws and regulations may have a material adverse effect on our business, financial condition and results of operations. Our failure to comply with applicable U.S. federal, state and local consumer protection and data privacy laws could lead to:


loss of our licenses and approvals to engage in our servicing and lending businesses;


31


Table of Contents
   

damage to our reputation in the industry;


governmental investigations and enforcement actions;


administrative fines and penalties and litigation;


civil and criminal liability, including class action lawsuits;


diminished ability to sell loans that we originate or purchase, requirements to sell such loans at a discount compared to other loans or repurchase or address indemnification claims from purchasers of such loans, including the GSEs;


inability to raise capital; and


inability to execute on our business strategy, including our growth plans.

These U.S. federal, state and local laws and regulations are amended from time to time, and new laws and regulations may go into effect. While we have processes and systems in place to identify and interpret such laws and regulations and to implement them, we may not identify every application of law, regulation or ordinance, interpret them accurately, or train our employees effectively with respect to these laws and regulations. The complexity of the legal requirements increases our exposure to the risks of noncompliance, which could be detrimental to our business. In addition, our failure to comply with these laws, regulations and rules may result in reduced payments by clients, modification of the original terms of loans, permanent forgiveness of debt, delays in the foreclosure process, increased servicing advances, litigation, enforcement actions, and repurchase and indemnification obligations. A failure to adequately supervise service providers and vendors, including outside foreclosure counsel, may also have these negative results.

The laws and regulations applicable to us are subject to administrative or judicial interpretation, but some laws and regulations may not yet have been interpreted or may be clarified infrequently. Ambiguities in applicable laws and regulations may leave uncertainty with respect to permitted or restricted conduct and may make compliance with laws, and risk assessment decisions with respect to compliance with laws difficult and uncertain. In addition, ambiguities make it difficult, in certain circumstances, to determine if, and how, compliance violations may be cured. The adoption by industry participants of different interpretations of these statutes and regulations has added uncertainty and complexity to compliance. We may fail to comply with applicable statutes and regulations even if acting in good faith due to a lack of clarity regarding the interpretation of such statutes and regulations, which may lead to regulatory investigations, governmental enforcement actions or private causes of action with respect to our compliance.

To resolve issues raised in examinations, investigations or other governmental actions, we may be required to take various corrective actions, including changing certain business practices, making refunds or taking other actions that could be financially or competitively detrimental to us. We expect to continue to incur costs to comply with governmental regulations. In addition, certain legislative actions and judicial decisions can give rise to the initiation of lawsuits against us for activities we conducted in the past. Furthermore, provisions in our mortgage loan and other loan product documentation, including but not limited to the mortgage and promissory notes we use in loan originations, could be construed as unenforceable by a court. We have been, and expect to continue to be, subject to regulatory enforcement actions and private causes of action from time to time with respect to our compliance with applicable laws and regulations.

The recent influx of new laws, regulations, and other directives adopted in response to the COVID-19 pandemic exemplifies the ever-changing and increasingly complex regulatory landscape we operate in. While some regulatory reactions to the COVID-19 pandemic relaxed certain compliance obligations, the forbearance requirements imposed on mortgages servicers in the CARES Act added new regulatory responsibilities. The GSEs and the FHFA, Ginnie Mae, HUD, various investors and others have also issued guidance relating to the COVID-19 pandemic. Future regulatory scrutiny and enforcement resulting from the COVID-19 pandemic is unknown.


32


Table of Contents

As a licensed title and settlement services provider, we are currently subject to a variety of, and may in the future become subject to additional, federal, state, and local laws that are continuously changing, including laws related to: the real estate, brokerage, title, and mortgage industries; mobile- and internet-based businesses; and data security, advertising, privacy and consumer protection laws. These laws can be costly to comply with, require significant management attention, and could subject us to claims, government enforcement actions, civil and criminal liability, or other remedies, including revocation of licenses and suspension of business operations.

Although we have systems and procedures directed to comply with these legal and regulatory requirements, we cannot assure you that more restrictive laws and regulations will not be adopted in the future, or that governmental bodies or courts will not interpret existing laws or regulations in a more restrictive manner, which could render our current business practices non-compliant or which could make compliance more difficult or expensive. Any of these, or other, changes in laws or regulations could have a detrimental effect on our business, financial condition and results of operations.

We are subject to legal proceedings, federal or state governmental examinations and enforcement investigations from time to time. Some of these matters are highly complex and slow to develop, and results are difficult to predict or estimate.

Legal Proceedings: We are currently and routinely involved in legal proceedings concerning matters that arise in the ordinary course of our business. There is no assurance that the number of legal proceedings will not increase in the future, including certified class or mass actions. These actions and proceedings are generally based on alleged violations of consumer protection, employment, foreclosure, contract, tort, fraud and other laws. Notably, we are subject to the California Labor Code pursuant to which several plaintiffs have filed representative actions (the “PAGA Litigation”) under the California Private Attorney General Act seeking statutory penalties for alleged violations related to calculation of overtime pay, errors in wage statements, and meal and rest break violations, among other things. Additionally, along with others in our industry, we are subject to repurchase and indemnification claims and may continue to receive claims in the future, regarding, among other things, alleged breaches of representations and warranties relating to the sale of mortgage loans, the placement of mortgage loans into securitization trusts or the servicing of mortgage loans securitizations. We are also subject to legal actions or proceedings resulting from actions alleged to have occurred prior to our acquisition of a company or a business. For example, we are subject to indemnification claims brought by LBHI relating to the alleged breaches of representations and warranties in several mortgage loan purchase agreements between entities who are (or are alleged to be) our predecessors in interest, and a predecessor in interest to LBHI. When the claims occurred as a result of actions taken before the Company purchased the related business, we generally have indemnification claims against the sellers; however, if they do not or cannot pay, we may suffer losses. Certain pending or threatened legal proceedings (including the PAGA Litigation) may include claims for substantial compensatory, punitive and/or statutory damages or claims for an indeterminate amount of damages. Litigation and other proceedings may require that we pay settlement costs, legal fees, damages, including punitive damages, penalties or other charges, or be subject to injunctive relief affecting our business practices, any or all of which could adversely affect our financial results. Legal proceedings brought under federal or state consumer protection statutes may result in a separate fine for each violation of the statute, which, particularly in the case of class action lawsuits, could result in damages substantially in excess of the amounts we earned from the underlying activities and that could have a material adverse effect on our liquidity, financial position and results of operations.

Regulatory Matters: Our business is subject to extensive examinations, investigations and reviews by various federal, state and local governmental, regulatory and enforcement agencies. We have historically had, continue to have, and may in the future have a number of open investigations, subpoenas, examinations and inquiries by these agencies related to our origination practices, violations of the FHA’s requirements, our financial reporting and other aspects of our businesses. These matters may include investigations by, among others, the DOJ, HUD and various state agencies, which can result in the payment of fines and penalties, changes to business practices and the entry of consent decrees or settlements. For example, we have received and expect


33


Table of Contents

to continue to receive inquiries from regulators seeking information on our COVID-19 pandemic response and its impact on our business, employees, and customers. The costs of responding to inquiries, examinations and investigations can be substantial.

Responding to examinations, investigations and reviews by various federal, state and local governmental, regulatory and enforcement agencies requires us to devote substantial legal and regulatory resources, resulting in higher costs and lower net cash flows. Adverse results in any of these matters could further increase our operating expenses and reduce our revenues, require us to change business practices, limit our ability to grow and otherwise materially and adversely affect our business, reputation, financial condition or results of operation. To the extent that an examination or other regulatory engagement reveals a failure by us to comply with applicable law, regulation or licensing requirement, this could lead to (i) loss of our licenses and approvals to engage in our businesses, (ii) damage to our reputation in the industry and loss of client relationships, (iii) governmental investigations and enforcement actions, (iv) administrative fines and penalties and litigation, (v) civil and criminal liability, including class action lawsuits, and actions to recover incentive and other payments made by governmental entities, (vi) enhanced compliance requirements, (vii) breaches of covenants and representations under our servicing, debt or other agreements, (viii) inability to raise capital and (ix) inability to execute on our business strategy. Any of these occurrences could further increase our operating expenses and reduce our revenues, require us to change business practices and procedures and limit our ability to grow or otherwise materially and adversely affect our business, reputation, financial condition or results of operation.

Moreover, regulatory changes resulting from the Dodd-Frank Act, other regulatory changes such as the CFPB’s examination and enforcement authority and the “whistleblower” provisions of the Dodd-Frank Act and guidance on whistleblowing programs issued by the New York State Department of Financial Services could increase the number of legal and regulatory enforcement proceedings against us. The CFPB has broad enforcement powers and has been active in investigations and enforcement actions and, when necessary, has issued civil money penalties to parties the CFPB determines has violated the laws and regulations it enforces. In addition, while we take numerous steps to prevent and detect employee misconduct, such as fraud, employee misconduct cannot always be deterred or prevented and could subject us to additional liability.

We establish reserves for pending or threatened legal proceedings when it is probable that a liability has been incurred and the amount of such loss can be reasonably estimated. Legal proceedings are inherently uncertain, and our estimates of loss are based on judgments and information available at that time. Our estimates may change from time to time for various reasons, including factual or legal developments in these matters.

There cannot be any assurance that the ultimate resolution of our litigation and regulatory matters will not involve losses, which may be material, in excess of our recorded accruals or estimates of reasonably probable losses.

Unlike competitors that are national banks, our lending subsidiaries are subject to state licensing and operational requirements that result in substantial compliance costs.

Because we are not a depository institution, we do not benefit from a federal exemption to state mortgage banking, loan servicing or debt collection licensing and regulatory requirements. We must comply with state licensing requirements and varying compliance requirements in all 50 states and the District of Columbia, and we are sensitive to regulatory changes that may increase our costs through stricter licensing laws, disclosure laws or increased fees or that may impose conditions to licensing that we or our personnel are unable to meet. In addition, if we enter new markets, we may be required to comply with new laws, regulations and licensing requirements. Further, we are subject to periodic examinations by state regulators, which can result in refunds to borrowers of certain fees earned by us, and we may be required to pay substantial penalties imposed by state regulators due to compliance errors. In the past we have been subject to inquiries from, and in certain instances have entered into settlement agreements with, state regulators that had the power to revoke our license or make


34


Table of Contents

our continued licensure subject to compliance with a consent order. For example, in 2019, we entered into a settlement agreement with the California Department of Business Oversight relating to findings in supervisory examinations concerning per diem interest charges and escrow trust reconciliations. As part of the settlement, we agreed to pay a penalty and to undertake certain remedial actions and procedures. Future state legislation and changes in existing regulation may significantly increase our compliance costs or reduce the amount of ancillary revenues, including late fees that we may charge to borrowers. This could make our business cost-prohibitive in the affected state or states and could materially affect our business.

State licensing requirements may also apply to our Subservicers in the states in which they operate. Applicable state mortgage- or loan-related laws may also impose requirements as to the form and content of contracts and other documentation, licensing of our employees and employee hiring background checks, licensing of independent contractors with which we contract, restrictions on certain practices, disclosure and record-keeping requirements and enforcement of borrowers’ rights. Licensed entities are required to renew their licenses, typically on an annual basis, and to do so they must satisfy the license requirements of each jurisdiction, which generally include financial requirements such as providing audited financial statements or satisfying minimum net worth requirements and non-financial requirements such as satisfactorily completing examinations as to the licensee’s compliance with applicable laws and regulations.

Most state licensing laws require that before a “change of control” can occur, including in connection with a merger, acquisition or initial public offering, applicable state banking departments must approve the change. Most of these “change of control” statutes require that, if there is an acquisition, merger or initial public offering, the acquiring company or companies being merged or going public must notify the state regulatory agency and receive agency approval before the acquisition, merger or initial public offering is finalized.

We and our licensed Subservicers are subject to periodic examination by state regulatory authorities and we may be subject to various reporting and other requirements to maintain licenses, and there is no assurance that we may satisfy these requirements. Failure by us or our Subservicers to maintain or obtain licenses may restrict our investment options and could harm our business, and we may be required by state regulators to pay substantial penalties or issue borrower refunds or restitution due to compliance errors.

We believe that we and our Subservicers maintain all material licenses and permits required for our current operations and are in substantial compliance with all applicable federal, state and local laws, rules, regulations and ordinances. However, we and our Subservicers may not be able to maintain all requisite licenses and permits, and the failure to satisfy those and other regulatory requirements could result in a default under our servicing or other agreements and have a material adverse effect on our operations. The states that currently do not provide extensive regulation of our businesses may later choose to do so, and if such states so act, we may not be able to obtain or maintain all requisite licenses and permits. The failure to satisfy those and other regulatory requirements could result in a default under our servicing agreements and have a material adverse effect on our operations. Furthermore, the adoption of additional, or the revision of existing, rules and regulations could adversely affect our business, financial condition and results of operations.

Our business is highly dependent on Fannie Mae, Freddie Mac and certain U.S. government agencies, and any changes in these entities or their current roles could be detrimental to our business.

We originate loans eligible for sale to Fannie Mae, Freddie Mac and government insured or guaranteed loans, such as FHA, VA and USDA loans eligible for Ginnie Mae securities issuance. In 2008, FHFA placed Fannie Mae and Freddie Mac into conservatorship and, as their conservator, controls and directs their operations. There is significant uncertainty regarding the future of the GSEs, including with respect to how long they will continue to be in existence, the extent of their roles in the market and what forms they will have, and whether they will be government agencies, government-sponsored agencies or private for-profit entities. Since they have been placed into conservatorship, many legislative and administrative plans for GSE reform have been put forth, but all have been met with resistance from various constituencies.


35


Table of Contents

Various proposals to generally reform the U.S. housing finance market have been offered by members of the U.S. Congress and the U.S. Department of the Treasury, and certain of these proposals seek to significantly reduce or eliminate over time the role of the GSEs in purchasing and guaranteeing mortgage loans. For example, in the past, proposals for the reform and exit of the conservatorships have been considered. Any such proposals, if enacted, may have broad adverse implications for the MBS market and our business. It is possible that the adoption of any such proposals might lead to higher fees being charged by the GSEs or lower prices on our sales of mortgage loans to them.

The extent and timing of any regulatory reform regarding the GSEs and the U.S. housing finance market, as well as any effect on our business operations and financial results, are uncertain. It is not yet possible to determine whether such proposals will be enacted and, if so, when, what form any final legislation or policies might take or how proposals, legislation or policies may impact the MBS market and our business. Our inability to make the necessary adjustments to respond to these changing market conditions or loss of our approved seller/servicer status with the GSEs could have a material adverse effect on our mortgage origination operations and our mortgage servicing operations. If those agencies cease to exist, wind down, or otherwise significantly change their business operations, or if we lost approvals with those agencies or our relationships with those agencies is otherwise adversely affected, we would seek alternative secondary market participants to acquire our mortgage loans at a volume sufficient to sustain our business. If such participants are not available on reasonably comparable economic terms, the above changes could have a material adverse effect on our ability to profitably sell loans we originate that are securitized through Fannie Mae, Freddie Mac or Ginnie Mae.

There may be material changes to the laws, regulations, rules or practices applicable to the FHA, HUD, Ginnie Mae or Fannie Mae which could materially adversely affect the reverse mortgage industry as a whole, including our FAR business.

The reverse mortgage industry is largely dependent upon the FHA, HUD and government agencies like Ginnie Mae. There can be no guarantee that HUD/FHA will retain Congressional authorization to continue the HECM program, which provides FHA government insurance for qualifying HECM loans, that any or all of these entities will continue to participate in the reverse mortgage industry or that they will not make material changes to the laws, regulations, rules or practices applicable to reverse mortgage programs.

For example, HUD previously implemented certain lending limits for the HECM program, and added credit-based underwriting criteria designed to assess a borrower’s ability and willingness to satisfy future tax and insurance obligations. In addition, Ginnie Mae’s participation in the reverse mortgage industry may be subject to economic and political changes that cannot be predicted. If participation by Ginnie Mae in the reverse mortgage market were reduced or eliminated, or its structure were to change (e.g., limitation or removal of the guarantee obligation), our ability to originate HECM loans and acquire Agency HMBS could be adversely affected. These developments could materially and adversely impact our portfolio.

Regulators continue to be active in the reverse mortgage space, including due to the perceived susceptibility of older borrowers to be influenced by deceptive or misleading marketing activities. Regulators have also focused on appraisal practices because reverse mortgages are largely dependent on collateral valuation. If we fail to comply with applicable laws and regulations relating to the origination of reverse mortgages, we could be subject to adverse regulatory actions, including potential fines, penalties or sanctions, and our business, reputation, financial condition and results of operations could be materially and adversely affected.

We may be subject to liability for potential violations of predatory lending laws, which could adversely impact our results of operations, financial condition and business.

Various federal, state and local laws have been enacted that are designed to discourage predatory lending and servicing practices. The Home Ownership and Equity Protection Act of 1994 (“HOEPA”) prohibits inclusion of certain provisions in residential loans that have mortgage rates or origination costs in excess of


36


Table of Contents

prescribed levels and requires that borrowers be given certain disclosures prior to origination. Some states have enacted, or may enact, similar laws or regulations, which in some cases impose restrictions and requirements greater than those in HOEPA. In addition, under the anti-predatory lending laws of some states, the origination of certain residential loans, including loans that are not classified as “high cost” loans under applicable law, must satisfy a net tangible benefits test with respect to the related borrower. This test may be highly subjective and open to interpretation. As a result, a court may determine that a residential loan, for example, does not meet the test even if the related originator reasonably believed that the test was satisfied. Failure of residential loan originators or servicers to comply with these laws, to the extent any of their residential loans are or become part of our mortgage-related assets, could subject us, as a servicer or, in the case of acquired loans, as an assignee or purchaser, to monetary penalties and could result in the borrowers rescinding the affected loans. Lawsuits have been brought in various states making claims against originators, servicers, assignees and purchasers of high cost loans for violations of state law. Named defendants in these cases have included numerous participants within the secondary mortgage market. If our loans are found to have been originated in violation of predatory or abusive lending laws, we could be subject to lawsuits or governmental actions, or we could be fined or incur losses.

Compliance with federal, state and local laws and regulations that govern employment practices and working conditions may be particularly burdensome to us due to the distributed nature of our workforce.

We have operations across an expansive geographic footprint with a U.S. workforce of over 4,700 employees operating in local markets across 48 states and Puerto Rico, in each case, as of December 31, 2020. In addition to complying with the Fair Labor Standards Act and the Equal Employment Opportunity Act, we are required to comply with similar state laws and regulations in each market where we have employees. Compliance with these laws and regulations requires a significant amount of administrative resources and management attention. Many of these laws and regulations provide for qui tam or similar private rights of action and we are routinely subject to litigation and regulatory proceedings related to these laws and regulations in the ordinary course of our business. For example, we are currently in litigation brought under the California Private Attorneys General Act related to alleged violations of the California Labor Code. See “—We are subject to legal proceedings, federal or state governmental examinations and enforcement investigations from time to time. Some of these matters are highly complex and slow to develop, and results are difficult to predict or estimate.” Regardless of the outcome or whether the claims are meritorious, we may need to devote substantial time and expense to defend against claims related to PAGA or other similar federal, state and local laws and regulations in the ordinary course of business. Unfavorable rulings could result in adverse impacts on our business, financial condition or results of operations.

We also have over 1,000 employees in our Lender Services division who are based in the Philippines. For those employees, we are required to comply with the laws of the Philippines relating to labor and employment matters. Compliance with these laws and regulations requires a significant amount of administrative resources and management attention, and failure to comply with them could result in penalties.

Conducting our business in a manner so that we are exempt from registration under, and in compliance with, the Investment Company Act, may reduce our flexibility and could limit our ability to pursue certain opportunities. At the same time, failure to continue to qualify for exemption from the Investment Company Act could adversely affect us.

Under the Investment Company Act, an investment company is required to register with the SEC and is subject to extensive restrictive and potentially adverse regulations relating to, among other things, operating methods, management, capital structure, dividends, and transactions with affiliates. We expect that one or more of our subsidiaries will qualify for an exclusion from registration as an investment company under the Investment Company Act pursuant to Section 3(c)(5)(C) of the Investment Company Act, which is available for entities that do not issue redeemable securities, face-amount certificates of the installment type or periodic payment plan certificates and are primarily engaged in the business of “purchasing or otherwise acquiring mortgages and other liens on and interests in real estate.” We believe that we conduct our operations so that neither we nor any of our


37


Table of Contents

subsidiaries are required to register as an investment company under the Investment Company Act. We are organized as a holding company and conduct our businesses primarily through our majority and wholly owned subsidiaries. We conduct our operations so that we and our subsidiaries do not come within the definition of an investment company. In order to continue to do so, however, we and each of our subsidiaries must either operate so as to fall outside the definition of an investment company under the Investment Company Act or satisfy its own exclusion under the Investment Company Act. For example, to avoid being defined as an investment company, an entity may limit its ownership or holdings of investment securities to less than 40% of its total assets. In order to satisfy an exclusion from being defined as an investment company, other entities, among other things, maintain at least 55% of their assets in certain qualifying real estate assets (the “55% Requirement”) and also maintain an additional 25% of their assets in such qualifying real estate assets or certain other types of real estate-related assets (the “25% Requirement”). Rapid changes in the values of assets we own, however, can disrupt prior efforts to conduct our business to meet these requirements and in turn, we may have to make investment decisions that we otherwise would not make absent the Investment Company Act considerations.

If we or one of our subsidiaries fell within the definition of an investment company under the Investment Company Act and failed to qualify for an exclusion or exemption, including, for example, if it was required to and failed to meet the 55% Requirement or the 25% Requirement, it could, among other things, be required either (i) to change the manner in which it conducts operations to avoid being required to register as an investment company or (ii) to register as an investment company, either of which could adversely affect us by, among other things, requiring us to dispose of certain assets or to change the structure of our business in ways that we may not believe to be in our best interests. Legislative or regulatory changes relating to the Investment Company Act or which affect our efforts to qualify for exclusions or exemptions, including our ability to comply with the 55% Requirement and the 25% Requirement, could also result in these adverse effects on us.

To the extent that we or any of our subsidiaries rely on Section 3(c)(5)(C) of the Investment Company Act, we expect to rely on guidance published by the SEC staff or on our analyses of such guidance to determine which assets are qualifying real estate assets for purposes of the 55% Requirement and real estate related assets for purposes of the 25% Requirement. However, the SEC’s guidance was issued in accordance with factual situations that may be different from the factual situations we face, and much of the guidance was issued more than 25 years ago. No assurance can be given that the SEC staff will concur with our classification of our assets. In addition, the SEC staff may, in the future, issue further guidance that may require us to re-classify our assets for purposes of qualifying for an exemption from registration under the Investment Company Act. If we are required to re-classify our assets, we may no longer be in compliance with the exclusion from the definition of an “investment company” provided by Section 3(c)(5)(C) of the Investment Company Act. To the extent that the SEC staff publishes new or different guidance with respect to any assets we have determined to be qualifying real estate assets, we may be required to adjust our strategy accordingly. In addition, we may be limited in our ability to make certain investments, and these limitations could result in a subsidiary holding assets we might wish to sell or selling assets we might wish to hold.

As a consequence of our seeking to avoid registration under the Investment Company Act on an ongoing basis, we and/or our subsidiaries may be restricted from making certain investments or may structure investments in a manner that would be less advantageous to us than would be the case in the absence of such requirements. In particular, a change in the value of any of our assets could negatively affect our ability to avoid registration under the Investment Company Act and cause the need for a restructuring of our investment portfolio. For example, these restrictions may limit our and our subsidiaries’ ability to invest directly in mortgage-backed securities that represent less than the entire ownership in a pool of senior loans, debt and equity tranches of securitizations and certain asset-backed securities, non-controlling equity interests in real estate companies or in assets not related to real estate. In addition, seeking to avoid registration under the Investment Company Act may cause us and/or our subsidiaries to acquire or hold additional assets that we might not otherwise have acquired or held or dispose of investments that we and/or our subsidiaries might not have otherwise disposed of, which could result in higher costs or lower proceeds to us than we would have paid or


38


Table of Contents

received if we were not seeking to comply with such requirements. Thus, avoiding registration under the Investment Company Act may hinder our ability to operate solely on the basis of maximizing profits.

There can be no assurance that we and our subsidiaries will be able to successfully avoid operating as an unregistered investment company. If it were established that we were an unregistered investment company, there would be a risk that we would be subject to monetary penalties and injunctive relief in an action brought by the SEC, that we would be unable to enforce contracts with third parties, that third parties could seek to obtain rescission of transactions undertaken during the period it was established that we were an unregistered investment company, and that we would be subject to limitations on corporate leverage that would have an adverse impact on our investment returns.

If we were required to register as an investment company under the Investment Company Act, we would become subject to substantial regulation with respect to our capital structure (including our ability to use borrowings), management, operations, transactions with affiliated persons (as defined in the Investment Company Act) and portfolio composition, including disclosure requirements and restrictions with respect to diversification and industry concentration and other matters. Compliance with the Investment Company Act would, accordingly, limit our ability to make certain investments and require us to significantly restructure our business plan, which could materially adversely affect our ability to pay distributions to our stockholders. For additional information, see “Business—Investment Company Act Considerations.”

We are currently subject to, and may in the future become subject to additional, U.S. and state laws and regulations imposing obligations on how we collect, store and process personal information. Our actual or perceived failure to comply with such obligations could harm our business. Ensuring compliance with such laws could also impair our efforts to maintain and expand our customer base, and thereby decrease our revenue.

We are, and may increasingly become, subject to various laws and regulations, as well as contractual obligations, relating to data privacy and security in the jurisdictions in which we operate. The regulatory environment related to data privacy and security is increasingly rigorous, with new and constantly changing requirements applicable to our business, and enforcement practices are likely to remain uncertain for the foreseeable future. These laws and regulations may be interpreted and applied differently over time and from jurisdiction to jurisdiction, and it is possible that they will be interpreted and applied in ways that may have a material adverse effect on our business, financial condition, results of operations and prospects.

In the United States, various federal and state regulators, including governmental agencies like the CFPB and the Federal Trade Commission, have adopted, or are considering adopting, laws and regulations concerning personal information and data security. Certain state laws may be more stringent or broader in scope, or offer greater individual rights, with respect to personal information than federal, international or other state laws, and such laws may differ from each other, all of which may complicate compliance efforts. For example, the California Consumer Privacy Act, or CCPA, which increases privacy rights for California residents and imposes obligations on companies that process their personal information, came into effect on January 1, 2020. Among other things, the CCPA requires covered companies to provide new disclosures to California consumers and provide such consumers new data protection and privacy rights, including the ability to opt-out of certain sales of personal information. The CCPA provides for civil penalties for violations, as well as a private right of action for certain data breaches that result in the loss of personal information. This private right of action may increase the likelihood of, and risks associated with, data breach litigation. In addition, laws in all 50 U.S. states require businesses to provide notice to consumers whose personal information has been disclosed as a result of a data breach. State laws are changing rapidly and there is discussion in the U.S. Congress of a new comprehensive federal data privacy law to which we would become subject if it is enacted.

All of these evolving compliance and operational requirements impose significant costs, such as costs related to organizational changes, implementing additional protection technologies, training employees and


39


Table of Contents

engaging consultants, which are likely to increase over time. In addition, such requirements may require us to modify our data processing practices and policies, distract management or divert resources from other initiatives and projects, all of which could have a material adverse effect on our business, financial condition, results of operations and prospects. Any failure or perceived failure by us to comply with any applicable federal, state or similar foreign laws and regulations relating to data privacy and security could result in damage to our reputation, as well as proceedings or litigation by governmental agencies or other third parties, including class action privacy litigation in certain jurisdictions, which would subject us to significant fines, sanctions, awards, penalties or judgments, all of which could have a material adverse effect on our business, financial condition and operating results.

Risks Related to Our Indebtedness

Our substantial leverage could adversely affect our financial condition, our ability to raise additional capital to fund our operations, our ability to operate our business, our ability to react to changes in the economy or our industry or our ability to pay our debts, and could divert our cash flow from operations to debt payments.

As of December 31, 2020, we had $3,310.3 million in total indebtedness outstanding, $2,973.7 million of which was senior secured indebtedness and $336.6 million of which would have been corporate indebtedness, consisting of the senior notes. As of December 31, 2020, we also had approximately $15.0 billion of HMBS related obligations and non-recourse debt that is recorded on our balance sheet. We also have other significant contractual obligations, including our obligations to make payments under the Tax Receivable Agreements. Subject to the limits contained in the agreements that govern our warehouse facilities and lines of credit, the indenture that governs the senior unsecured notes and the applicable agreements governing our other existing indebtedness, we may be able to incur substantial additional debt from time to time to finance working capital, capital expenditures, investments or acquisitions, or for other purposes. If we do so, the risks related to our high level of debt could increase. Specifically, our high level of debt could have important consequences, including the following:


making it more difficult for us to satisfy our obligations with respect to our debt;


limiting our ability to obtain additional financing to fund future working capital, capital expenditures, acquisitions or other general corporate requirements;


requiring a substantial portion of our cash flows to be dedicated to debt service payments instead of other purposes, thereby reducing the amount of cash flows available for working capital, capital expenditures, acquisitions and other general corporate purposes;


increasing our vulnerability to general adverse economic and industry conditions;


exposing us to the risk of increased interest rates as certain of our borrowings are at variable rates of interest;


limiting our flexibility in planning for and reacting to changes in the industry in which we compete;


placing us at a disadvantage compared to other, less leveraged competitors; and


increasing our cost of borrowing.

The Company is a holding company, and its consolidated assets are owned by, and our business is conducted through, its subsidiaries. Revenue from these subsidiaries is its primary source of funds for debt payments and operating expenses. If the Company’s subsidiaries are restricted from making distributions, its ability to meet its debt service obligations or otherwise fund our operations may be impaired. Moreover, there may be restrictions on payments by subsidiaries to their parent companies under applicable laws, including laws that require companies to maintain minimum amounts of capital and to make payments to shareholders only from profits. As a result, although a subsidiary of the Company may have cash, it may not be able to obtain that cash to satisfy our obligation to service our outstanding debt or fund our operations.


40


Table of Contents

Despite our current level of indebtedness, we may be able to incur substantially more debt and enter into other transactions, which could further exacerbate the risks to our financial condition described above.

We may be able to incur significant additional indebtedness in the future. Although certain of the agreements governing our existing indebtedness (including the indenture that governs the notes and the agreements that govern our warehouse facilities and lines of credit) contain restrictions on the incurrence of additional indebtedness and entering into certain types of other transactions, these restrictions are subject to a number of qualifications and exceptions. Additional indebtedness incurred in compliance with these restrictions could be substantial. These restrictions also do not prevent us from incurring obligations, such as trade payables, that do not constitute indebtedness as defined under our debt instruments. To the extent new debt is added to our current debt levels, the substantial leverage risks described in the immediately preceding risk factor would increase.

As of December 31, 2020, we had total borrowing capacity of approximately $5,038.7 million under our warehouse facilities, securities repurchase lines and lines of credit, all of which would be secured indebtedness, including approximately $1,471.8 million of committed borrowing capacity. As of December 31, 2020, we also had approximately $15.0 billion of HMBS related obligations and non-recourse debt that is recorded on our balance sheet.

Our variable rate indebtedness subjects us to interest rate risk, which could cause our indebtedness service obligations to increase significantly.

Interest rates may increase in the future. As a result, interest rates on variable rate debt offerings could be higher or lower than current levels. As of December 31, 2020, after taking into account our interest rate derivatives, $2,921.9 million (equivalent), or 98.3%, of our outstanding debt had variable interest rates. If interest rates increase, our debt service obligations on the variable rate indebtedness would increase even though the amount borrowed remained the same, and our net income and cash flows, including cash available for servicing our indebtedness, would correspondingly decrease.

In addition, certain of our variable rate indebtedness use LIBOR as a benchmark for establishing the rate of interest. LIBOR is the subject of recent national, international and other regulatory guidance and proposals for reform. These reforms and other pressures may cause LIBOR to be replaced with a new benchmark or to perform differently than in the past. The consequences of these developments cannot be entirely predicted, but could include an increase in the cost of our variable rate indebtedness. For further discussion on the potential impacts of the replacement of LIBOR with an alternative reference rate see “Risk Factors–Risks Related to the Business of the Company–Risks Related to Our Lending Business” appearing elsewhere in this document.

We may be unable to service our indebtedness.

Our ability to make scheduled payments on and to refinance our indebtedness depends on and is subject to our financial and operating performance, which in turn is affected by general and regional economic, financial, competitive, business and other factors, all of which are beyond our control, including the availability of financing in the international banking and capital markets. Lower revenues generally will reduce our cash flow. We cannot assure you that our business will generate sufficient cash flow from operations or that future borrowings will be available to us in an amount sufficient to enable us to service our debt, including the notes, to refinance our debt or to fund our other liquidity needs.

If we are unable to meet our debt service obligations or to fund our other liquidity needs, we will need to restructure or refinance all or a portion of our debt which could cause us to default on our debt obligations and impair our liquidity. Our ability to restructure or refinance our debt will depend on the condition of the capital markets and our financial condition at such time. Any refinancing of our indebtedness could be at higher interest rates and may require us to comply with more onerous covenants that could further restrict our business operations.


41


Table of Contents

In addition, our investments in MSRs have limited liquidity and our investments in mortgage loans may become illiquid. If we are required to liquidate all or a portion of our portfolio quickly, we may realize significantly less than the value at which we previously recorded such asset, making it more difficult to repay our indebtedness after an event of default.

Moreover, in the event of a default, the holders of our indebtedness could elect to declare all the funds borrowed to be due and payable, together with accrued and unpaid interest, if any. The lenders under our warehouse facilities and lines of credit could also elect to terminate their commitments thereunder, cease making further loans, and institute foreclosure proceedings against their collateral, and we could be forced into bankruptcy or liquidation. If we breach our covenants under the agreements that govern our warehouse facilities and lines of credit, we would be in default thereunder. The lenders could exercise their rights, as described above, and we could be forced into bankruptcy or liquidation.

The agreements that govern our senior notes, warehouse facilities and lines of credit impose, significant operating and financial restrictions on the Company and its restricted subsidiaries, which may prevent us from capitalizing on business opportunities.

The agreements that govern our senior notes, warehouse facilities and lines of credit impose significant operating and financial restrictions on us. These restrictions in the indenture will limit the ability of the Company and its restricted subsidiaries to, among other things:


incur or guarantee additional debt or issue disqualified stock or preferred stock;


pay dividends and make other distributions on, or redeem or repurchase, capital stock;


make certain investments;


incur certain liens;


enter into transactions with affiliates;


merge or consolidate;


enter into agreements that prohibit the ability of restricted subsidiaries to make dividends or other payments to the Company or other subsidiaries;


designate restricted subsidiaries as unrestricted subsidiaries;


prepay, redeem or repurchase certain indebtedness; and


transfer or sell assets.

These restrictions in the agreements that govern our warehouse facilities and lines of credit will limit the ability of the applicable borrower (and certain parent entities) to, among other things, incur or guarantee additional debt, incur certain liens, enter into transactions with affiliates and transfer or sell certain assets. In addition, certain of the agreements that govern our warehouse facilities and lines of credit require us to maintain certain net worth and liquidity levels, among other financial covenants.

As a result of the restrictions described above, we will be limited as to how we conduct our business and we may be unable to raise additional debt or equity financing to compete effectively or to take advantage of new business opportunities. The terms of any future indebtedness we may incur could include more restrictive covenants. We cannot assure you that we will be able to maintain compliance with these covenants in the future and, if we fail to do so, that we will be able to obtain waivers from the lenders and/or amend the covenants.

Our failure to comply with the restrictive covenants described above as well as other terms of our indebtedness could result in an event of default, which, if not cured or waived, could result in our being required to repay these borrowings before their due date. If we are forced to refinance these borrowings on less favorable terms or cannot refinance these borrowings, our results of operations and financial condition could be adversely affected.


42


Table of Contents

A decline in our operating results or available cash could cause us to experience difficulties in complying with covenants contained in more than one agreement, which could result in our bankruptcy or liquidation.

If we were to sustain a decline in our operating results or available cash, we could experience difficulties in complying with the financial covenants contained in the agreements that govern our warehouse facilities and lines of credit. The failure to comply with such covenants could result in an event of default under our warehouse facilities or lines of credit and by reason of cross-acceleration or cross-default provisions, other indebtedness may then become immediately due and payable. In addition, should an event of default occur, the lenders under our warehouse facilities or lines of credit could elect to terminate their commitments thereunder, cease making loans and institute foreclosure proceedings against our assets, and we could be forced into bankruptcy or liquidation. If our operating performance declines, we may in the future need to obtain waivers from the required lenders under our warehouse facilities or lines of credit to avoid being in default. If we breach our covenants under our warehouse facilities or lines of credit and seek a waiver, we may not be able to obtain a waiver from the required lenders. If this occurs, we would be in default under our warehouse facilities or lines of credit, the lenders could exercise their rights, as described above, and we could be forced into bankruptcy or liquidation.

Repayment of our debt is dependent on cash flow generated by our subsidiaries, which may be subject to limitations beyond our control.

Our subsidiaries own all of our assets and conduct all of our operations. Accordingly, repayment of our indebtedness is dependent on the generation of cash flow by our subsidiaries and their ability to make such cash available to us, by dividend, debt repayment or otherwise. Our subsidiaries may not be able to, or may not be permitted to, make distributions or repay intercompany loans to enable us to make payments in respect of our indebtedness. Each subsidiary is a distinct legal entity and, under certain circumstances, legal and contractual restrictions may limit our ability to obtain cash from our subsidiaries. In the event that we are unable to receive distributions from subsidiaries, we may be unable to make required principal and interest payments on our indebtedness.

Our failure to comply with the agreements relating to our outstanding indebtedness, including as a result of events beyond our control, could result in an event of default that could materially and adversely affect our results of operations and our financial condition.

If there were an event of default under any of the agreements relating to our outstanding indebtedness, the holders of the defaulted debt could cause all amounts outstanding with respect to that debt to be due and payable immediately. We cannot assure you that our assets or cash flows would be sufficient to fully repay borrowings under our outstanding debt instruments if accelerated upon an event of default. Further, if we are unable to repay, refinance or restructure our indebtedness under our secured debt, including our warehouse facilities or lines of credit, the holders of such debt could proceed against the collateral securing that indebtedness. In addition, any event of default or declaration of acceleration under one debt instrument could also result in an event of default under one or more of our other debt instruments.

Risks Related to Our Organizational Structure

The Company is a holding company and its only material asset is its interest in FoA, and it is accordingly dependent upon distributions from FoA to pay taxes, make payments under the Tax Receivable Agreements and pay dividends.

The Company is a holding company and it has no material assets other than its direct and/or indirect ownership of FoA Units. the Company has no independent means of generating revenue. the Company intends to cause FoA to make distributions to the holders of FoA Units, including the Company and the Principal Stockholders (as defined below), in an amount sufficient to cover all applicable taxes at assumed tax rates,


43


Table of Contents

payments under the Tax Receivable Agreements and dividends, if any, declared by it. Deterioration in the financial condition, earnings or cash flow of FoA and its subsidiaries for any reason could limit or impair their ability to pay such distributions. Additionally, to the extent that the Company needs funds, and FoA is restricted from making such distributions under applicable law or regulation or under the terms of our financing arrangements, or is otherwise unable to provide such funds, such restriction could materially adversely affect our liquidity and financial condition.

It is anticipated that FoA will continue to be treated as a partnership for U.S. federal income tax purposes and, as such, generally will not be subject to any entity-level U.S. federal income tax. Instead, taxable income will be allocated to holders of FoA Units, including us. Accordingly, we will be required to pay income taxes on our allocable share of any net taxable income of FoA. Legislation that is effective for taxable years beginning after December 31, 2017 may impute liability for adjustments to a partnership’s tax return to the partnership itself in certain circumstances, absent an election to the contrary. FoA may be subject to material liabilities pursuant to this legislation and related guidance if, for example, its calculations of taxable income are incorrect. In addition, the income taxes on our allocable share of FoA’s net taxable income will increase over time as the Continuing Unitholders exchange their FoA Units for shares of the Company’s Class A Common Stock. Such increase in our tax expenses may have an adverse effect on our business, results of operations and financial condition.

Under the terms of the A&R LLC Agreement (as defined below), FoA is obligated to make tax distributions to holders of FoA Units (including the Company) at certain assumed tax rates. These tax distributions may in certain periods exceed the Company’s tax liabilities and obligations to make payments under the Tax Receivable Agreements. The board of directors of the Company (the “Board”), in its sole discretion, will make any determination from time to time with respect to the use of any such excess cash so accumulated, which may include, among other uses, acquiring additional newly issued FoA Units from FoA at a per unit price determined by reference to the market value of the Class A Common Stock; paying dividends, which may include special dividends, on its Class A Common Stock; funding repurchases of Class A Common Stock; or any combination of the foregoing. The Company will have no obligation to distribute such cash (or other available cash other than any declared dividend) to its stockholders. To the extent that the Company does not distribute such excess cash as dividends on its Class A Common Stock or otherwise undertake ameliorative actions between FoA Units and shares of Class A Common Stock and instead, for example, hold such cash balances, the Continuing Unitholders may benefit from any value attributable to such cash balances as a result of their ownership of Class A Common Stock following a redemption or exchange of their FoA Units, notwithstanding that the Continuing Unitholders may previously have participated as holders of FoA Units in distributions by FoA that resulted in such excess cash balances at the Company. See “Certain Relationships and Related Person Transactions—FoA Amended and Restated Limited Liability Company Agreement.”

Payments of dividends, if any, will be at the discretion of the Board after taking into account various factors, including its business, operating results and financial condition, current and anticipated cash needs, plans for expansion and any legal or contractual limitations on its ability to pay dividends. Our existing financing arrangements include and any financing arrangement that we enter into in the future may include restrictive covenants that limit our ability to pay dividends. In addition, FoA is generally prohibited under Delaware law from making a distribution to a member to the extent that, at the time of the distribution, after giving effect to the distribution, liabilities of FoA (with certain exceptions) exceed the fair value of its assets. Subsidiaries of FoA are generally subject to similar legal limitations on their ability to make distributions to FoA.

The Company is required to make payments under the Tax Receivable Agreements for certain tax benefits the Company may claim, and the amounts of such payments could be significant.

The Company entered into the Tax Receivable Agreements in connection with the Business Combination. The Tax Receivable Agreements generally provide for the payment by the Company to the TRA Parties (as defined below) of 85% of the cash tax benefits, if any, that the Company is deemed to realize


44


Table of Contents

(calculated using certain simplifying assumptions) as a result of (i) tax basis adjustments as a result of sales and exchanges of units in connection with or following the Business Combination and certain distributions with respect to units, (ii) the Company’s utilization of certain tax attributes attributable to Blocker or the holders of limited liability company interests of Blocker (each, a “Blocker Share”) outstanding immediately prior to the effectiveness of the merger of Blocker Merger Sub with and into Blocker (the “Blocker Merger”) (such holders, the “Blocker Shareholders”), and (iii) certain other tax benefits related to entering into the Tax Receivable Agreements, including tax benefits attributable to making payments under the Tax Receivable Agreements. The Company will generally retain the benefit of the remaining 15% of these cash tax benefits.

Estimating the amount of payments that may be made under the Tax Receivable Agreements is by its nature imprecise, insofar as the calculation of amounts payable depends on a variety of factors. The anticipated tax basis adjustments, as well as the amount and timing of any payments under the Tax Receivable Agreements, will vary depending upon a number of factors, including the timing of exchanges, the price of shares of the Company’s Class A Common Stock at the time of the exchange, the extent to which such exchanges are taxable, the amount of tax attributes, changes in tax rates and the amount and timing of the Company’s income. As a result of the size of the anticipated tax basis adjustment of the tangible and intangible assets of FoA and the Company’s possible utilization of certain tax attributes, the payments that the Company may make under the Tax Receivable Agreements are expected to be substantial. See “Certain Relationships and Related Person Transactions—Tax Receivable Agreements.”

In certain cases, payments under the Tax Receivable Agreements may be accelerated and/or significantly exceed the actual benefits, if any, the Company realizes in respect of the tax attributes subject to the Tax Receivable Agreements.

The Tax Receivable Agreements provide that if the Company exercises its right to terminate the Tax Receivable Agreements or in the case of a change in control of the Company or a material breach of the Company’s obligations under either the Blackstone Tax Receivable Agreement (as defined below) or the FoA Tax Receivable Agreement (as defined below), all obligations under the Tax Receivable Agreements will be accelerated and the Company will be required to make a payment to the TRA Parties in an amount equal to the present value of future payments under the Tax Receivable Agreements.

The amount due and payable in those circumstances is determined based on certain assumptions, including an assumption that any FoA Units that have not been exchanged are deemed exchanged for the market value of Class A Common Stock at the time of the termination or the change of control and an assumption the Company would have sufficient taxable income to fully utilize all potential future tax benefits that are subject to the Tax Receivable Agreements.

As a result of the foregoing, (i) the Company could be required to make cash payments to the TRA Parties that are greater than the specified percentage of the actual benefits the Company ultimately realizes in respect of the tax benefits that are subject to the Tax Receivable Agreements, and (ii) the Company would be required to make a cash payment equal to the present value of the anticipated future tax benefits that are the subject of the Tax Receivable Agreements, which payment may be made significantly in advance of the actual realization, if any, of such future tax benefits. In these situations, the Company’s obligations under the Tax Receivable Agreements could have a substantial negative impact on its liquidity and could have the effect of delaying, deferring or preventing certain mergers, asset sales, other forms of business combination, or other changes of control due to the additional transaction costs a potential acquirer may attribute to satisfying such obligations. The Company may need to incur additional debt to finance payments under the Tax Receivable Agreements to the extent its cash resources are insufficient to meet its obligations under the Tax Receivable Agreements as a result of timing discrepancies or otherwise. There can be no assurance that the Company will be able to finance its obligations under the Tax Receivable Agreements.


45


Table of Contents

The Company will not be reimbursed for any payments made to the TRA Parties under the Tax Receivable Agreements in the event that any tax benefits are disallowed.

The Company will not be reimbursed for any cash payments previously made to the TRA Parties pursuant to the Tax Receivable Agreements if any tax benefits initially claimed by the Company are subsequently challenged by a taxing authority and are ultimately disallowed. Instead, any excess cash payments made by the Company to a TRA Party will be netted against any future cash payments that the Company might otherwise be required to make under the terms of the Tax Receivable Agreements. However, a challenge to any tax benefits initially claimed by the Company may not arise for a number of years following the initial time of such payment or, even if challenged early, such excess cash payment may be greater than the amount of future cash payments that the Company might otherwise be required to make under the terms of the Tax Receivable Agreements and, as a result, there might not be future cash payments from which to net against. The applicable U.S. federal income tax rules are complex and factual in nature, and there can be no assurance that the Internal Revenue Service (the “IRS”) or a court will not disagree with the Company’s tax reporting positions. As a result, it is possible that the Company could make cash payments under the Tax Receivable Agreements that are substantially greater than its actual cash tax savings. See “Certain Relationships and Related Person Transactions—Tax Receivable Agreements” for a discussion of the Tax Receivable Agreements and the related likely benefits to be realized by the Company and the TRA Parties.

Certain of the TRA Parties have substantial control over the Company, and their interests, along with the interests of other TRA Parties, in the Company’s business may conflict with yours.

The TRA Parties may receive payments from the Company under the Tax Receivable Agreements upon any redemption or exchange of their units, including the issuance of shares of Class A Common Stock upon any such redemption or exchange. As a result, the interests of the TRA Parties may conflict with the interests of holders of Class A Common Stock. For example, the TRA Parties may have different tax positions from the Company which could influence their decisions regarding whether and when to dispose of assets, whether and when to incur new or refinance existing indebtedness, especially in light of the existence of the Tax Receivable Agreements, and whether and when the Company should terminate the Tax Receivable Agreements and accelerate its obligations thereunder. In addition, the structuring of future transactions may take into consideration tax or other considerations of TRA Parties even in situations where no similar considerations are relevant to the Company. See “Certain Relationships and Related Person Transactions—Tax Receivable Agreements” for a discussion of the Tax Receivable Agreements and the related likely benefits to be realized by the Company and the TRA Parties.

Risks Related to Ownership of our Class A Common Stock and Warrants

There can be no assurance we will be able to comply with the continued listing standards of NYSE for our Class A Common Stock.

If NYSE delists the Company’s Class A Common Stock from trading on its exchange for failure to meet the listing standards, the Company and its shareholders could face significant material adverse consequences including:


a limited availability of market quotations for our securities;


reduced liquidity for our securities;


a determination that shares of the Class A Common Stock are a “penny stock” which will require brokers trading in the Class A Common Stock to adhere to more stringent rules and possibly result in a reduced level of trading activity in the secondary trading market for our securities;


a limited amount of news and analyst coverage; and


a decreased ability to issue additional securities or obtain additional financing in the future.


46


Table of Contents

The market price of our securities may fluctuate or decline.

Fluctuations in the price of the Company’s securities could contribute to the loss of all or part of your investment. The trading price of our securities could be volatile and subject to wide fluctuations in response to various factors, some of which are beyond our control. Any of the factors listed below could have a material adverse effect on your investment in our securities and our securities may trade at prices significantly below the price you paid for them. In such circumstances, the trading price of our securities may not recover and may experience a further decline.

Factors affecting the trading price of our securities may include:


actual or anticipated fluctuations in our quarterly financial results or the quarterly financial results of companies perceived to be similar to us;


changes in the market’s expectations about our operating results;


success of competitors;


our operating results failing to meet the expectation of securities analysts or investors in a particular period;


changes in financial estimates and recommendations by securities analysts concerning the Company or the asset management industry in general;


operating and share price performance of other companies that investors deem comparable to us;


our ability to market new and enhanced products on a timely basis;


changes in laws and regulations affecting our business;


our ability to meet compliance requirements;


commencement of, or involvement in, litigation involving us;


changes in our capital structure, such as future issuances of securities or the incurrence of additional debt;


the volume of shares of Class A Common Stock available for public sale;


any major change in our board of directors or management;


sales of substantial amounts of Class A Common Stock by our directors, executive officers or significant shareholders or the perception that such sales could occur; and


general economic and political conditions such as recessions, interest rates, fuel prices, international currency fluctuations and acts of war or terrorism.

Broad market and industry factors may materially harm the market price of our securities irrespective of our operating performance. The stock market in general, and NYSE in particular, have experienced price and volume fluctuations that have often been unrelated or disproportionate to the operating performance of the particular companies affected. The trading prices and valuations of these stocks, and of our securities, may not be predictable. A loss of investor confidence in the market for retail stocks or the stocks of other companies which investors perceive to be similar to us could depress our stock price regardless of our business, prospects, financial condition or results of operations. A decline in the market price of our securities also could adversely affect our ability to issue additional securities and our ability to obtain additional financing in the future.


47


Table of Contents

We are an “emerging growth company,” and we cannot be certain if the reduced reporting requirements applicable to emerging growth companies will make our common stock less attractive to investors.

We are an “emerging growth company” as defined in the JOBS Act. We will remain an “emerging growth company” until the earliest to occur of:


the last day of the fiscal year during which our total annual revenue equals or exceeds $1.07 billion (subject to adjustment for inflation);


December 31, 2026;


the date on which we have, during the previous three-year period, issued more than $1 billion in non-convertible debt; or


the date on which we are deemed to be a “large accelerated filer” under the Exchange Act.

We may take advantage of exemptions from various reporting requirements that are applicable to other public companies that are not emerging growth companies, including but not limited to, reduced disclosure obligations regarding executive compensation in our periodic reports and proxy statements and exemptions from the requirements of holding a nonbinding advisory vote on executive compensation and stockholder approval of any golden parachute payments not previously approved.

Investors may find our Class A common stock less attractive because we may rely on these exemptions. If some investors find our common stock less attractive as a result, there may be a less active trading market for our Class A common stock and our per share trading price may be materially adversely affected and more volatile.

The Company incurs significant increased expenses and administrative burdens as a public company, which could have a material adverse effect on our business, financial condition and results of operations.

The Company faces increased legal, accounting, administrative and other costs and expenses as a public company that we have not incurred as a private company. The Sarbanes-Oxley Act, including the requirements of Section 404, as well as rules and regulations subsequently implemented by the SEC, the Dodd-Frank Act and the rules and regulations promulgated and to be promulgated thereunder, the Public Company Accounting Oversight Board and the securities exchanges, impose additional reporting and other obligations on public companies. Compliance with public company requirements increases costs and makes certain activities more time-consuming. A number of those requirements require the Company to carry out activities we did not do previously. For example, the Company created new board committees and adopted new internal controls and disclosure controls and procedures. In addition, additional expenses associated with SEC reporting requirements will be incurred. Furthermore, if any issues in complying with those requirements are identified (for example, if the auditors identify a material weakness or significant deficiency in the internal control over financial reporting), the Company could incur additional costs rectifying those issues, and the existence of those issues could adversely affect the Company’s reputation or investor perceptions of it. It may also be more expensive to obtain director and officer liability insurance. Risks associated with the Company’s status as a public company may make it more difficult to attract and retain qualified persons to serve on the board of directors or as executive officers. The additional reporting and other obligations imposed by these rules and regulations will increase legal and financial compliance costs and the costs of related legal, accounting and administrative activities. These increased costs will require the Company to divert a significant amount of money that could otherwise be used to expand the business and achieve strategic objectives. Advocacy efforts by shareholders and third parties may also prompt additional changes in governance and reporting requirements, which could further increase costs.

The Company may not be able to timely and effectively implement and maintain controls and procedures required by Section 404 of the Sarbanes-Oxley Act that are applicable to us.

As a public company, we are required to comply with the SEC’s rules implementing Sections 302 and 404 of the Sarbanes-Oxley Act, which require management to certify financial and other information in our


48


Table of Contents

quarterly and annual reports and provide an annual management report on the effectiveness of internal control over financial reporting. To comply with the requirements of being a public company, the Company is required to provide attestation on internal controls, and we may need to undertake various actions, such as implementing additional internal controls and procedures and hiring additional accounting or internal audit staff. The standards required for a public company under Section 404 of the Sarbanes-Oxley Act are significantly more stringent than those required of us as a privately held company. Management may not be able to effectively implement and maintain controls and procedures that adequately respond to the increased regulatory compliance and reporting requirements that are applicable to the Company. If the Company is not able to maintain the additional requirements of Section 404 in a timely manner or with adequate compliance, it may not be able to assess whether its internal controls over financial reporting are effective, which may subject it to adverse regulatory consequences and could harm investor confidence and the market price of our securities. Further, as an emerging growth company, our independent registered public accounting firm is not required to formally attest to the effectiveness of our internal controls over financial reporting pursuant to Section 404 until the date we are no longer an emerging growth company. At such time, our independent registered public accounting firm may issue a report that is adverse in the event that it is not satisfied with the level at which the controls of the Company are documented, designed or operating.

The Company’s management has limited experience in operating a public company.

Certain of the Company’s executive officers and certain directors have limited experience in the management of a publicly traded company. The Company’s management team may not successfully or effectively manage its transition to a public company following the Business Combination that is subject to significant regulatory oversight and reporting obligations under federal securities laws. Their limited experience in dealing with the increasingly complex laws pertaining to public companies could be a significant disadvantage in that it is likely that an increasing amount of their time may be devoted to these activities which will result in less time being devoted to the management and growth of the company. It is possible that the Company will be required to expand its employee base and hire additional employees to support its operations as a public company which will increase its operating costs in future periods.

Due to the listing of the Company’s Class A Common Stock on the NYSE, the Company is a “controlled company” within the meaning of NYSE rules and, as a result, qualifies for exemptions from certain corporate governance requirements. The stockholders of the Company do not have the same protections afforded to stockholders of companies that are subject to such requirements.

The Company’s Principal Stockholders are parties to the Stockholders Agreement described in “Certain Relationships and Related Person Transactions—Stockholders Agreement” and beneficially own approximately 78% of the combined voting power of the Company’s Class A Common Stock and Class B common stock, par value $0.0001 per share (“Class B Common Stock”). As a result, the Company is a “controlled company” within the meaning of the NYSE corporate governance standards. Under these corporate governance standards, a company of which more than 50% of the voting power in the election of directors is held by an individual, group or another company is a “controlled company” and may elect not to comply with certain corporate governance requirements. For example, controlled companies:


are not required to have a board that is composed of a majority of “independent directors,” as defined under the NYSE rules;


are not required to have a compensation committee that is composed entirely of independent directors; and


are not required to have director nominations be made, or recommended to the full board of directors, by its independent directors or by a nominations committee that is composed entirely of independent directors.

Accordingly, the stockholders of the Company will not have the same protections afforded to stockholders of companies that are subject to all of the corporate governance requirements of NYSE.


49


Table of Contents

There may be sales of a substantial amount of Class A Common Stock by the Company’s shareholders and these sales could cause the price of the Company’s securities to fall.

Pursuant to the Registration Rights Agreement (as defined below), certain shareholders are entitled to demand that the Company registers the resale of their securities subject to certain minimum requirements. These shareholders also have certain “piggyback” registration rights with respect to registration statements filed subsequent to the Business Combination.

Upon effectiveness of any registration statement we file pursuant to the Registration Rights Agreement, and upon the expiration of the lockup periods applicable to the parties to the Registration Rights Agreement, these parties may sell large amounts of our Class A Common Stock in the open market or in privately negotiated transactions, which could have the effect of increasing the volatility in the share price of Class A Common Stock or putting significant downward pressure on the price of our Class A Common Stock.

Sales of substantial amounts of our Class A Common Stock in the public market, or the perception that such sales will occur, could adversely affect the market price of our Class A Common Stock and make it difficult for us to raise funds through securities offerings in the future.

We may redeem your unexpired Warrants prior to their exercise at a time that is disadvantageous to you, thereby making your Warrants worthless.

We have the ability to redeem outstanding Warrants at any time after they become exercisable and prior to their expiration, at a price of $0.01 per Warrant; provided that the last reported sales price of our Class A Common Stock equals or exceeds $18.00 per share (as adjusted for share splits, share dividends, reorganizations, recapitalizations and the like) for any 20 trading days within a 30 trading-day period ending on the third trading day prior to the date we send the notice of such redemption to the Warrant holders. If and when the Warrants become redeemable by us, we may exercise our redemption right even if we are unable to register or qualify the underlying securities for sale under all applicable state securities laws. Redemption of the outstanding Warrants could force you (i) to exercise your Warrants and pay the exercise price therefor at a time when it may be disadvantageous for you to do so, (ii) to sell your Warrants at the then-current market price when you might otherwise wish to hold your Warrants or (iii) to accept the nominal redemption price which, at the time the outstanding Warrants are called for redemption, is likely to be substantially less than the market value of your Warrants. In addition, we may redeem your Warrants after they become exercisable for a number of shares of Class A Common Stock determined based on the redemption date and the fair market value of our Class A Common Stock. Any such redemption may have similar consequences to a cash redemption described above. In addition, such redemption may occur at a time when the Warrants are “out-of-the-money,” in which case you would lose any potential embedded value from a subsequent increase in the value of the Class A Common Stock had your Warrants remained outstanding.

In addition, we may redeem your Warrants after they become exercisable for a number of shares of Class A Common Stock determined based on the redemption date and the fair market value of our Class A Common Stock. Any such redemption may have similar consequences to a cash redemption described above. In addition, such redemption may occur at a time when the Warrants are “out-of-the-money,” in which case you would lose any potential embedded value from a subsequent increase in the value of the Class A Common Stock had your Warrants remained outstanding.

Our Warrants may have an adverse effect on the market price of our Class A Common Stock.

We have issued Warrants to purchase 14,375,000 shares of our Class A Common Stock, which replaced the outstanding warrants of Replay as a result of the Business Combination. To the extent such Warrants are exercised, additional shares of our Class A Common Stock will be issued, which will result in dilution to our shareholders and increase the number of shares of Class A Common Stock eligible for resale in the public market. Sales of substantial numbers of such shares in the public market or the fact that such Warrants may be exercised could adversely affect the market price of our Class A Common Stock.


50


Table of Contents

Because we have no current plans to pay cash dividends on our shares of Class A Common Stock for the foreseeable future, you may not receive any return on investment unless you sell your shares of Class A Common Stock for a price greater than that which you paid for it.

We may retain future earnings, if any, for future operations, expansion and debt repayment and have no current plans to pay any cash dividends for the foreseeable future. Any decision to declare and pay dividends in the future will be made at the discretion of our board of directors and will depend on, among other things, our results of operations, financial condition, cash requirements, contractual restrictions and other factors that our board of directors may deem relevant. In addition, our ability to pay dividends may be limited by covenants of any existing and future outstanding indebtedness we or our subsidiaries incur. As a result, you may not receive any return on an investment in our shares of Class A Common Stock unless you sell our shares of Class A Common Stock for a price greater than that which you paid for it. See “Description of Securities—Dividends”.

The Principal Stockholders control the Company and their interests may conflict with the Company’s or yours in the future.

The Principal Stockholders beneficially own approximately 78% of the combined voting power of the Company’s Class A Common Stock and Class B Common Stock. Moreover, the Company agreed to nominate to our board individuals designated by the Principal Stockholders in accordance with the Stockholders Agreement (as defined below). The Principal Stockholders retain the right to designate directors subject to the maintenance of certain ownership requirements in us. See “Certain Relationships and Related Person Transactions—Stockholders Agreement.” Even when the Principal Stockholders cease to own shares of Company stock representing a majority of the total voting power, for so long as the Principal Stockholders continue to own a significant percentage of Company stock, they will still be able to significantly influence or effectively control the composition of the Board and the approval of actions requiring stockholder approval through their voting power. Accordingly, for such period of time, the Principal Stockholders will have significant influence with respect to the Company’s management, business plans and policies, including the appointment and removal of the Company’s officers.

In particular, for so long as the Principal Stockholders continue to own a significant percentage of the Company’s stock, the Principal Stockholders will be able to cause or prevent a change of control of the Company or a change in the composition of the Board and could preclude any unsolicited acquisition of the Company. The concentration of ownership could deprive you of an opportunity to receive a premium for your shares of Class A Common Stock as part of a sale of the Company and ultimately might affect the market price of the Class A Common Stock.

In addition, the Principal Stockholders own 64.4% of the FoA Units. Because they hold ownership interests directly in FoA, the Principal Stockholders may have conflicting interests with holders of shares of the Class A Common Stock. For example, if FoA makes distributions to the Company, the Principal Stockholders will also be entitled to receive such distributions pro rata in accordance with the percentages of their respective membership interests in FoA and their preferences as to the timing and amount of any such distributions may differ from those of the Company’s public stockholders. The Principal Stockholders may also have different tax positions from us which could influence their decisions regarding whether and when to dispose of assets, especially in light of the existence of the Tax Receivable Agreements, whether and when to incur new or refinance existing indebtedness, and whether and when the Company should terminate the Tax Receivable Agreements and accelerate its obligations thereunder. In addition, the structuring of future transactions may take into consideration the Principal Stockholders’ tax or other considerations even where no similar benefit would accrue to the Company. See “Certain Relationships and Related Person Transactions—Tax Receivable Agreements.”


51


Table of Contents

The A&R Charter does not limit the ability of the Principal Stockholders to compete with the Company and they may have investments in businesses whose interests conflict with the Company.

The Principal Stockholders and their respective affiliates engage in a broad spectrum of activities, including investments in businesses that may compete with the Company. In the ordinary course of their business activities, the Principal Stockholders and their respective affiliates may engage in activities where their interests conflict with the Company’s interests or those of its stockholders. The Amended and Restated Certificate of Incorporation of the Company (the “A&R Charter”) provides that none of the Principal Stockholders or any of their respective affiliates or any of the Company’s directors who are not employed by the Company (including any non-employee director who serves as one of the Company’s officers in both his or her director and officer capacities) or his or her affiliates have any duty to refrain from engaging, directly or indirectly, in the same business activities or similar business activities or lines of business in which the Company operates. See “Description of Securities—Conflicts of Interest”. The Principal Stockholders and their respective affiliates also may pursue acquisition opportunities that may be complementary to the Company’s business, and, as a result, those acquisition opportunities may not be available to the Company. In addition, the Principal Stockholders may have an interest in the Company pursuing acquisitions, divestitures and other transactions that, in their judgment, could enhance their investment, even though such transactions might involve risks to the Company and its stockholders.

Anti-takeover provisions under Delaware law could make an acquisition of the Company, which may be beneficial to the Company’s stockholders, more difficult and may prevent attempts by the Company’s stockholders to replace or remove the Company’s management.

The Company is incorporated in Delaware. The A&R Charter and the Amended and Restated Bylaws of the Company (the “A&R Bylaws”) contain provisions that may make the merger or acquisition of the Company more difficult without the approval of the Board. Among other things, these provisions:


provide that subject to the rights of the holders of any preferred stock and the rights granted pursuant to the Stockholders Agreement, vacancies and newly created directorships may be filled only by the remaining directors at any time the Principal Stockholders beneficially own less than 30% of the total voting power of all then outstanding shares of the Company’s capital stock entitled to vote generally in the election of directors;


allow the Company to authorize the issuance of shares of one or more series of preferred stock, including in connection with a stockholder rights plan, financing transactions or otherwise, the terms of which series may be established and the shares of which may be issued without stockholder approval, and which may include super voting, special approval, dividend, or other rights or preferences superior to the rights of the holders of common stock;


prohibit stockholder action by written consent from and after the date on which the Principal Stockholders beneficially own at least 30% of the total voting power of all then outstanding shares of the Company’s capital stock entitled to vote generally in the election of directors unless such action is recommended by all directors then in office;


provide for certain limitations on convening special stockholder meetings; and


establish advance notice requirements for nominations for elections to our board or for proposing matters that can be acted upon by stockholders at stockholder meetings.

Further, as a Delaware corporation, the Company is also subject to provisions of Delaware law, which may impede or discourage a takeover attempt that the Company’s stockholders may find beneficial. These anti-takeover provisions and other provisions under Delaware law may discourage, delay or prevent a transaction involving a change in control of the Company, including actions that the Company’s stockholders may deem advantageous, or negatively affect the trading price of the Class A Common Stock. These provisions may also discourage proxy contests and make it more difficult for you and other stockholders to elect directors of your


52


Table of Contents

choosing and to cause the Company to take other corporate actions you desire. For further discussion of these and other such anti-takeover provisions, see the section titled “Description of Securities—Certain Anti-Takeover Provisions of Our A&R Charter and A&R Bylaws”.

The A&R Charter designates the Court of Chancery of the State of Delaware or the federal district courts of the United States of America, as applicable, as the sole and exclusive forum for certain types of actions and proceedings that may be initiated by the Company’s stockholders, which could limit the Company’s stockholders’ ability to obtain a favorable judicial forum for disputes with the Company or the Company’s directors, officers or other employees.

The A&R Charter provides that, unless the Company consents to the selection of an alternative forum, the Court of Chancery of the State of Delaware will, to the fullest extent permitted by law, be the sole and exclusive forum for: (i) any derivative action or proceeding brought on our behalf; (ii) any action asserting a breach of fiduciary duty owed by any current or former director, officer, stockholder or employee of the Company to the Company or its stockholders; (iii) any action asserting a claim against the Company arising under the Delaware General Corporation Law (the “DGCL”), the A&R Chater or the A&R Bylaws (together, the “Organizational Documents”) or as to which the DGCL confers jurisdiction on the Court of Chancery of the State of Delaware; or (iv) any action asserting a claim against the Company that is governed by the internal affairs doctrine.

The A&R Charter further provides that, unless the Company consents in writing to the selection of an alternative forum, to the fullest extent permitted by law, the federal district courts of the United States of America will be the exclusive forum for the resolution of any complaint asserting a cause of action arising under the federal securities laws of the United States, including the Securities Act and the Exchange Act and, in each case, the applicable rules and regulations promulgated thereunder.

Any person or entity purchasing or otherwise acquiring any interest in any shares of the Company’s capital stock shall be deemed to have notice of and to have consented to the forum provision in the A&R Charter. This choice-of-forum provision may limit a stockholder’s ability to bring a claim in a different judicial forum, including one that it may find favorable or convenient for a specified class of disputes with the Company or the Company’s directors, officers, other stockholders or employees, which may discourage such lawsuits. Alternatively, if a court were to find this provision of the A&R Charter inapplicable or unenforceable with respect to one or more of the specified types of actions or proceedings, the Company may incur additional costs associated with resolving such matters in other jurisdictions, which could materially and adversely affect the Company’s business, financial condition and results of operations and result in a diversion of the time and resources of the Company’s management and board of directors.

The Company cannot predict the impact its dual class structure may have on the market price of the Class A Common Stock.

The Company cannot predict whether its dual class structure will result in a lower or more volatile market price of the Class A Common Stock, in adverse publicity or other adverse consequences. Certain index providers have announced restrictions on including companies with multiple class share structures in certain of their indices. For example, S&P Dow Jones has stated that companies with multiple share classes will not be eligible for inclusion in the S&P Composite 1500 (composed of the S&P 500, S&P MidCap 400 and S&P SmallCap 600), although existing index constituents in July 2017 were grandfathered. Under the announced policies, the Company’s dual class capital structure would make it ineligible for inclusion in any of these indices. Given the sustained flow of investment funds into passive strategies that seek to track certain indices, exclusion from stock indices would likely preclude investment by many of these funds and could make the Class A Common Stock less attractive to other investors. As a result, the market price of the Class A Common Stock could be materially adversely affected.


53


Table of Contents

If securities or industry analysts do not publish or cease publishing research or reports about the Company, its business, or its market, or if they change their recommendations regarding the Company’s securities adversely, the price and trading volume of the Company’s securities could decline.

The trading market for the Company’s securities will be influenced by the research and reports that industry or securities analysts may publish about the Company, its business, market or competitors. Securities and industry analysts do not currently, and may never, publish research on the Company. If no securities or industry analysts commence coverage of the Company, The Company’s share price and trading volume would likely be negatively impacted. If any of the analysts who may cover the Company change their recommendation regarding the Company’s securities adversely, or provide more favorable relative recommendations about the Company’s competitors, the price of the Company’s securities would likely decline. If any analyst who may cover the Company were to cease coverage of the Company or fail to regularly publish reports on it, the Company could lose visibility in the financial markets, which in turn could cause its share price or trading volume to decline.

You may be diluted by the future issuance of additional Class A Common Stock or FoA Units in connection with the Company’s incentive plans, acquisitions or otherwise.

The Company has 5,594,708,028 shares of Class A Common Stock authorized but unissued, including 131,318,286 shares of Class A Common Stock issuable upon exchange of FoA Units that are held by the Continuing Unitholders and 14,374,971 shares of Class A Common Stock issuable upon exercise of the Warrants. The A&R Charter authorizes the Company to issue these shares of Class A Common Stock and options, rights, warrants and appreciation rights relating to Class A Common Stock for the consideration and on the terms and conditions established by the Board in its sole discretion, whether in connection with acquisitions or otherwise. Similarly, the A&R LLC Agreement permits FoA to issue an unlimited number of additional limited liability company interests of FoA with designations, preferences, rights, powers and duties that are different from, and may be senior to, those applicable to the FoA Units, and which may be exchangeable for shares of Class A Common Stock. Additionally, the Company has reserved an aggregate of 21,250,000 shares of Class A Common Stock and FoA Units for issuance under the Incentive Plan. Any Class A Common Stock that the Company issues, including under the Incentive Plan or other equity incentive plans that we may adopt in the future, would dilute the percentage ownership held by the investors who own shares of Class A Common Stock.

The Company may issue preferred stock whose terms could materially adversely affect the voting power or value of its Class A Common Stock.

The A&R Charter authorizes the Company to issue, without the approval of its stockholders, one or more classes or series of preferred stock having such designations, preferences, limitations and relative rights, including preferences over the Company’s Class A Common Stock respecting dividends and distributions, as the Board may determine. The terms of one or more classes or series of preferred stock could adversely impact the voting power or value of the Class A Common Stock. For example, the Company might grant holders of preferred stock the right to elect some number of the Company’s directors in all events or on the happening of specified events or the right to veto specified transactions. Similarly, the repurchase or redemption rights or liquidation preferences the Company might assign to holders of preferred stock could affect the residual value of the Class A Common Stock.

General Risk Factors

The unaudited pro forma financial information included herein may not be indicative of what the Company’s actual financial position or results of operations would have been.

The unaudited pro forma financial information included herein is presented for illustrative purposes only and is not necessarily indicative of what the Company’s actual financial position or results of operations would have been had the Business Combination been completed on the dates indicated.


54


Table of Contents

As a result of the application of the acquisition method of accounting in connection with the Business Combination, the historical consolidated financial statements of the Company are not necessarily indicative of the Company’s future results of operations, financial position and cash flows, and in the future the Company may need to recognize impairment charges related to goodwill, identified intangible assets and fixed assets that are adjusted to fair value.

The Business Combination will be accounted for as a business combination using the acquisition method of accounting. Accordingly, the assets and liabilities of the Company would be recorded at their fair values at the date of the consummation of the Business Combination, with any excess of the purchase price over the estimated fair value recorded as goodwill. These fair value adjustments may result in substantial balances of goodwill and identified intangible assets. The application of business combination accounting requires the use of significant estimates and assumptions.

As a result of the application of the acquisition method of accounting for the Business Combination, the historical consolidated financial statements of the Company are not necessarily indicative of the Company’s future results of operations, financial position and cash flows. For example, increased tangible and intangible assets resulting from adjusting the basis of tangible and intangible assets to their fair value would result in increased depreciation and amortization expense in the periods following the consummation of the Business Combination. Additionally, the Company will be required to test goodwill and any other intangible assets with an indefinite life for possible impairment on an annual basis and on an interim basis if there are indicators of a possible impairment. The Company will also be required to evaluate amortizable intangible assets and fixed assets for impairment if there are indicators of a possible impairment. There is significant judgment required in the analysis of a potential impairment of goodwill, identified intangible assets and fixed assets. If, as a result of a general economic slowdown, deterioration in one or more of the markets in which the Company operates or impairment in the Company’s financial performance and/or future outlook, the estimated fair value of the Company’s long- lived assets decreases, the Company may determine that one or more of its long-lived assets is impaired. An impairment charge would be determined based on the estimated fair value of the assets and any such impairment charge could have a material adverse effect on the Company’s business, financial condition and results of operations.

Combination or “Layering” of Multiple Risk Factors May Significantly Increase Your Risk of Loss

Although the various risks discussed in this prospectus are generally described separately, investors should consider the potential effects of the interplay of multiple risk factors. Where more than one significant risk factor is present, the risk of loss to an investor may be significantly increased. There are many circumstances in which layering of multiple risks with respect to the Company and its businesses may magnify the effect of those risks.


55


Table of Contents

USE OF PROCEEDS

All of the Class A Common Stock offered by the Selling Securityholders pursuant to this prospectus will be sold by the Selling Securityholders for their respective accounts. The Company will not receive any of the proceeds from these sales.

The Company will receive up to an aggregate of approximately $165.3 million from the exercise of the Warrants, assuming the exercise in full of all of the Warrants for cash. The Company expects to use the net proceeds from the exercise of the Warrants for general corporate purposes. The Company will have broad discretion over the use of proceeds from the exercise of the Warrants. There is no assurance that the holders of the Warrants will elect to exercise any or all of such Warrants.

The Selling Securityholders will pay any underwriting fees, discounts and selling commissions incurred by such Selling Securityholders in disposing of their Class A Common Stock. Pursuant to the Registration Rights Agreement, the Company will bear all other costs, fees and expenses incurred in effecting the registration of the Class A Common Stock covered by this prospectus, including, without limitation, all registration and filing fees, NYSE listing fees and fees and expenses of counsel and independent registered public accountants.


56


Table of Contents

DETERMINATION OF OFFERING PRICE

The offering price of the shares of Class A Common Stock underlying the Warrants offered hereby is determined by reference to the exercise price of the Warrants of $11.50 per share. The Warrants are listed on the NYSE under the symbol “FOA.WS.”

We cannot currently determine the price or prices at which shares of our Class A Common Stock may be sold by the Selling Securityholders under this prospectus.


57


Table of Contents

MARKET INFORMATION FOR CLASS A COMMON STOCK AND DIVIDEND POLICY

Market Information

Our Class A Common Stock and Warrants are currently listed on the NYSE under the symbols “FOA” and “FOA.WS”, respectively. Prior to the consummation of the Business Combination, Replay’s Units, Ordinary Shares and Warrants were listed on the NYSE under the symbols “RPLA.U”, “RPLA” and “RPLA.WS”, respectively. As of May 24, 2021, there were 37 holders of record of our Class A Common Stock and 2 holders of record of our Warrants.

Dividend Policy

We have not paid any cash dividends on our common stock or the Warrants to date. Our Board may from time to time consider whether or not to institute a dividend policy. It is our present intention to retain any earnings for use in our business operations and, accordingly, we do not anticipate the Board declaring any dividends in the foreseeable future. The payment of cash dividends in the future will be dependent upon our revenues and earnings, if any, capital requirements and general financial condition. The payment of any cash dividends will be within the discretion of our Board. Further, our ability to declare dividends will also be limited by restrictive covenants contained in our debt agreements.

Securities Authorized for Issuance Under Equity Compensation Plans

2021 Omnibus Incentive Plan

At the Shareholders Meeting, Replay shareholders considered and approved the Incentive Plan and reserved 21,250,000 shares of Class A Common Stock for issuance thereunder, subject to adjustment as provided for therein. The Incentive Plan was assumed by the Company and approved by the Board on April 1, 2021. The Incentive Plan became effective immediately upon the Closing of the Business Combination.

Awards Pursuant to A&R LTIP

Pursuant to the terms of the Amended and Restated UFG Holdings LLC Management Long-Term Incentive Plan (the “A&R MLTIP”), each of our named executive officers (with the exceptions of Anthony W. Villani and Johan Gericke) received a certain cash award (an “Eligible Distribution Award”), the amounts of which are set forth below. Such Eligible Distributions Awards were paid in cash on or around April 23, 2021 (subject to each executive’s satisfaction of the Release Requirement (as defined below)). For additional information on the terms and conditions of such Eligible Distribution Awards please see “Management—Narrative Disclosure to Summary Compensation Table and Grants of Plan-Based Awards Table—Management Long-Term Incentive Plan”.

In addition, pursuant to the terms of the A&R MLTIP, our named executive officers (with the exceptions of Anthony W. Villani and Johan Gericke) are also entitled to receive (subject to their satisfaction of the Release Requirement) (i) restricted stock units of the Company on or promptly following the date on which shares of Class A Common Stock reserved for issuance pursuant to the Incentive Plan are registered on an effective Form S-8 with the SEC but no earlier than the expiration of the lockup period (such restricted stock units, “Replacement RSUs”), and (ii) shares of Class A Common Stock pursuant to certain earnout rights (“Earnout Shares”) upon specified earnout dates (to the extent such dates occur). The number of Replacement RSUs and Earnout Shares that such executives are entitled receive are set forth below. For additional information on the terms and conditions of such Replacement RSUs and Earnout Shares please see “Management—Narrative Disclosure to Summary Compensation Table and Grants of Plan-Based Awards Table—Management Long-Term Incentive Plan.”


58


Table of Contents

Named Executive

Officer

   Eligible
Distribution
Award
     Replacement RSUs      Earnout Shares
(First Earnout
Achievement Date)
     Earnout Shares
(Second Earnout
Achievement Date)
 

Patricia L. Cook

   $ 2,112,646.54        1,307,195.00        68,400        68,400  

Graham Fleming

   $ 2,112,646.54        1,307,195.00        68,400        68,400  

Jeremy Prahm

   $ 1,334,303.08        825,597.00        43,200        43,200  

Tai A. Thornock

   $ 222,383.85        137,600.00        7,200        7,200  


59


Table of Contents

UNAUDITED PRO FORMA COMBINED CONSOLIDATED FINANCIAL INFORMATION

Introduction

We are providing the following unaudited pro forma combined consolidated financial information to aid you in your analysis of the financial aspects of the Business Combination. The unaudited pro forma combined consolidated financial information should be read in conjunction with the accompanying notes.

The unaudited pro forma combined consolidated balance sheet as of March 31, 2021 combines the unaudited condensed balance sheet of Replay as of March 31, 2021 with the unaudited consolidated balance sheet of FoA as of March 31, 2021, giving effect to the Business Combination as if it had been consummated on that date.

The unaudited pro forma combined consolidated statement of operations for the three months ended March 31, 2021 combines the unaudited condensed statement of operations of Replay for the three months ended March 31, 2021 with the unaudited consolidated statement of operations of FoA for the three months ended March 31, 2021. The unaudited pro forma combined consolidated statement of operations for the year ended December 31, 2020 combines the restated audited statement of operations of Replay for the year ended December 31, 2020 with the audited consolidated statement of operations of FoA for the year ended December 31, 2020 . The unaudited pro forma combined consolidated statement of operations for the three months ended March 31, 2021 and the year ended December 31, 2020 give effect to the Business Combination as if it had been consummated on January 1, 2020.

The unaudited pro forma combined consolidated financial information was derived from and should be read in conjunction with the following historical financial statements and the accompanying notes:


The historical unaudited condensed financial statements of Replay as of and for the three months ended March 31, 2021 and the historical restated audited financial statements of Replay for the year ended December 31, 2020; and


The historical unaudited consolidated financial statements of FoA as of and for the three months ended March 31, 2021 and the historical audited consolidated financial statements of FoA for the year ended December 31, 2020.

The foregoing historical financial statements have been prepared in accordance with GAAP.

The unaudited pro forma combined consolidated financial information should also be read together with “Replay Management’s Discussion and Analysis of Financial Condition and Results of Operations”, “FoA Management’s Discussion and Analysis of Financial Condition and Results of Operations”, and other financial information.

Description of the Business Combination

On October 12, 2020, Replay, FoA, New Pubco, Replay Merger Sub, Blocker Merger Sub, Blocker, Blocker GP and the Sellers entered into the Transaction Agreement, pursuant to which Replay agreed to combine with FoA in a series of transactions that will result in New Pubco becoming a publicly-traded company on NYSE and controlling FoA in an “UP-C” structure.

Concurrently with the execution of the Transaction Agreement, Replay and New Pubco entered into the PIPE Agreements with the PIPE Investors, as applicable. In the aggregate, the PIPE Investors have committed to purchase $250.0 million of PIPE Shares, at a purchase price of $10.00 per PIPE Share. The closing of the sale of the PIPE Shares pursuant to the PIPE Agreements was contingent upon, among other customary closing conditions, the substantially concurrent consummation of the Business Combination. The purpose of the sale of


60


Table of Contents

the PIPE Shares was to raise additional capital for use in connection with the Business Combination and to meet the minimum cash requirements provided in the Transaction Agreement.

Pursuant to the Business Combination, among other things:

(i) Replay effected the Domestication, whereby (A) each Ordinary Share outstanding immediately prior to the Domestication was converted into a Replay LLC Unit and (B) Replay will be governed by the Replay LLCA;

(ii) the Sellers and Blocker GP sold to Replay FoA Units in exchange for cash;

(iii) the Replay Merger occurred, with each Replay LLC Unit outstanding immediately prior to the effectiveness of the Replay Merger being converted into the right to receive one share of Class A Common Stock;

(iv) Blocker was converted from a Delaware limited partnership to a Delaware limited liability company;

(v) the Blocker Merger occurred, with each Blocker Share outstanding immediately prior to the effectiveness of the Blocker Merger being converted into the right to receive a combination of shares of Class A Common Stock and cash;

(vi) Blocker GP contributed its remaining FoA Units to New Pubco in exchange for shares of Class A Common Stock, after which New Pubco contributed such FoA Units to Blocker; and

(vii) New Pubco issued to the Continuing Unitholders shares of Class B Common Stock, which have no economic rights but entitle each holder of at least one such share (regardless of the number of shares so held) to a number of votes that is equal to the aggregate number of FoA Units held by such holder on all matters on which stockholders of New Pubco are entitled to vote generally.

As a result of the Business Combination, among other things:

(A) New Pubco indirectly holds (through Replay and Blocker) FoA Units and has the sole and exclusive right to appoint the board of managers of FoA;

(B) the Sellers hold (i) FoA Units that are exchangeable on a one-for-one basis for shares of Class A Common Stock and (ii) shares of Class B Common Stock; and

(C) the Continuing Stockholders directly or indirectly, hold shares of Class A Common Stock.

As a result of the Business Combination, New Pubco initially owns approximately 31.3% of the economic interest of FoA, but has 100% of the voting power and has the right to appoint the board of managers of FoA. Immediately following the completion of the Business Combination, the ownership percentage held by the noncontrolling interest is approximately 68.7%.

Additionally, in connection with the Business Combination, New Pubco entered into the Tax Receivable Agreements with the TRA Parties that provides for the payment by New Pubco to the TRA Parties of 85% of the benefits, if any, that New Pubco is deemed to realize (calculated using certain assumptions) as a result of (i) tax basis adjustments that will increase the tax basis of the tangible and intangible assets of New Pubco as a result of sales or exchanges of FoA Units in connection with or after the Business Combination or distributions with respect to the FoA Units prior to or in connection with the Business Combination, (ii) New Pubco’s utilization of certain tax attributes attributable to the Blocker or the Blocker Shareholders, and (iii) certain other tax benefits related to entering into the Tax Receivable Agreements, including tax benefits attributable to payments under the Tax Receivable Agreements. Prior to and following the consummation of the Business Combination the primary


61


Table of Contents

asset held by Blocker is an investment in FoA through Class A Units held. All other assets and liabilities held by Blocker are not considered to be significant to New Pubco. See “Item 1.01. Entry into Material Definitive Agreement—Tax Receivable Agreements” for more information. The computation of the adjustments to the pro forma balance sheet related to deferred tax assets and amounts payable under the Tax Receivable Agreement are complicated and subject to significant judgments, assumptions and uncertainties, which could cause actual results to differ materially from those presented in such pro forma adjustments. For example, any differences in the tax attributes used to measure the deferred tax asset as of the pro forma balance sheet date and the actual tax attributes upon the consummation of the Business Combination could result in the reduction of any deferred tax asset recognized or recognition of a deferred tax liability. Specifically, the amount of net operating losses, if any, that exist upon the consummation of the Business Combination will be impacted by the amount of taxable income through the consummation of the Business Combination.

Accounting for the Business Combination

The Business Combination was accounted for using the acquisition method with New Pubco as the accounting acquirer. Under the acquisition method of accounting, New Pubco’s assets and liabilities were recorded at carrying value and the assets and liabilities associated with FoA were recorded at estimated fair value as of the acquisition date. The excess of the purchase price over the estimated fair values of the net assets acquired is recognized as goodwill. For accounting purposes, the acquirer is the entity that has obtained control of another entity and, thus, consummated a business combination. The determination of whether control has been obtained begins with the evaluation of whether control should be evaluated based on the variable interest or voting interest model pursuant to ASC Topic 810, Consolidation (“ASC 810”). If the acquiree is a variable interest entity, the primary beneficiary would be the accounting acquirer. FoA meets the definition of a variable interest entity and New Pubco has been determined to be the primary beneficiary.

Other Events

On November 5, 2020, Finance of America Funding LLC, an indirect, wholly owned subsidiary of FoA, issued $350.0 million aggregate principal amount of 7.875% senior unsecured notes due November 15, 2025. FoA used approximately $298.4 million of the net proceeds of the offering to fund a distribution to its owners and the remaining net proceeds, after offering expenses, are being retained for growth and general corporate purposes.

The effect of the offering and sale of senior unsecured notes is reflected in the historical unaudited consolidated financial statements of FoA as of and for the three months ended March 31, 2021. Therefore, the unaudited pro forma combined consolidated balance sheet as of March 31, 2021 and the unaudited pro forma combined statement of operations for the three months ended March 31, 2021 do not include any pro forma adjustments related to the offering and sale of senior unsecured notes. The unaudited pro forma combined statement of operations for the year ended December 31, 2020 includes a pro forma adjustment to reflect the impact of interest expense for the period from January 1, 2020 to November 5, 2020, assuming the senior unsecured notes had been issued on January 1, 2020.

In its previously filed Super 8-K dated April 7, 2021 the Company erroneously included pro forma adjustments to the unaudited pro forma combined consolidated balance sheet as of December 31, 2020 to reflect the issuance of the senior unsecured notes and related debt issuance costs. These amounts were already reflected in the historical audited consolidated financial statements of FoA as of December 31, 2020. In addition, the Company erroneously included a pro forma adjustment to the unaudited pro forma combined statement of operations for the year ended December 31, 2020 to reflect twelve months of interest expense associated with the outstanding senior unsecured notes. Interest expense for the period from November 5, 2020 through December 31, 2020 was already reflected in the historical audited consolidated financial statements of FoA for the year ended December 31, 2020.


62


Table of Contents

Basis of Pro Forma Presentation

The unaudited pro forma combined consolidated financial information was prepared in accordance with Article 11 of Regulation S-X, using the assumptions set forth in the notes to the unaudited pro forma combined consolidated financial information. The unaudited pro forma combined consolidated financial information has been adjusted to give effect to transaction accounting adjustments reflecting only the application of required accounting to the Business Combination and related transactions linking the effects of the Business Combination and related transactions to the historical financial statements of Replay, which forms the accounting predecessor of New Pubco. The adjustments in the unaudited pro forma combined consolidated financial information have been identified and presented to provide relevant information necessary for an accurate understanding of the combined entity upon consummation of the Business Combination.

The unaudited pro forma combined consolidated financial information is for illustrative purposes only. The financial results may have been different had the companies always been combined. You should not rely on the unaudited pro forma combined consolidated financial information as being indicative of the historical results that would have been achieved had the companies always been combined or the future results that the combined entity will experience.


63


Table of Contents

UNAUDITED PRO FORMA COMBINED CONSOLIDATED BALANCE SHEET

As of March 31, 2021

(in thousands, except share amounts)


    (a)
Replay Acquisition
Corp. as of
March 31, 2021
    (b)
Finance of America
Equity Capital LLC
as of
March 31, 2021
                 
  Pro Forma
Adjustments
   

Footnote

Reference

  Pro Forma
Combined
 

ASSETS


Cash and cash equivalents

  $ 483     $ 347,755     $ —        
        423     (c)  
        293,322     (d)  
        (9,188   (e)  
        244,647     (f)  
        (342,270   (g)  
        (201,534   (h)     333,638  

Restricted cash

    —         305,292       —           305,292  

Reverse mortgage loans held for investment, subject to HMBS related obligations, at fair value

    —         10,071,192       —           10,071,192  

Mortgage loans held for investment, subject to nonrecourse debt, at fair value

    —         5,291,444       —           5,291,444  

Mortgage loans held for investment, at fair value

    —         1,100,544       —           1,100,544  

Mortgage loans held for sale, at fair value

    —         2,140,361       —           2,140,361  

Debt securities

    —         9,230       —           9,230  

Mortgage servicing rights, at fair value

    —         267,364       —           267,364  

Derivative assets

    —         116,480       —           116,480  

Fixed assets and leasehold improvements, net

    —         26,079       —           26,079  

Goodwill

    —         128,750       (612,050   (o)  
        2,075,154     (u)     1,591,854  

Intangible assets, net

    —         16,302       361,798     (u)     378,100  

Investments held in Trust Account

    293,322       —         (293,322   (d)     —    

Deferred tax asset (liability)

    —         —         (22,099   (p), (q), (u)     (22,099

Due (to)/from related parties

    —         1,463       (1,463   (i)     —    

Other assets, net

    71       278,163       —           278,234  


TOTAL ASSETS

  $ 293,876     $ 20,100,419     $ 1,493,418       $ 21,887,713  


LIABILITIES, CONTINGENTLY REDEEMABLE NONCONTROLLING INTEREST (“CRNCI”) AND SHAREHOLDERS’ EQUITY


HMBS related obligations, at fair value

  $ —       $ 9,926,132     $ —         $ 9,926,132  

Nonrecourse debt, at fair value

    —         5,227,943       —           5,227,943  

Other financing lines of credit

    —         3,340,345       —           3,340,345  

Payables and other liabilities

    10,528       425,317       —        
        5,592     (j)  
        201,753     (i)  
        23,951     (k)     667,141  

Notes payable, net

    —         336,296       —        
        —           336,296  

Warrant Liability

    25,409         (7,440   (l)     17,969  

Deferred underwriting commissions

    9,188       —         (9,188   (e)     —    

Payable to related parties pursuant to tax receivable agreement

    —         —         42,265     (q), (u)     42,265  


TOTAL LIABILITIES

  $ 45,125     $ 19,256,033     $ 256,933       $ 19,558,091  


64


Table of Contents
    (a)
Replay Acquisition
Corp. as of
March 31, 2021
    (b)
Finance of America
Equity Capital, LLC
as of
March 31, 2021
                 
  Pro Forma
Adjustments
   

Footnote

Reference

  Pro Forma
Combined
 

Commitments and contingencies


Ordinary shares, $0.0001 par value; 28,750,000 shares subject to possible redemption at $10.00 per share at March 31, 2021

    287,500       —         (197,534   (h)  
        (89,966   (m)     —    

CRNCI

    —         203,216       —        
        (203,216   (i)     —    

SHAREHOLDERS’ EQUITY


Class A Common Stock

        1     (m)  
        1     (n)  
        3     (f)  
        3     (t), (u)     8  

Ordinary shares, $0.0001 par value; 200,000,000 shares authorized; 7,187,500 shares issued and outstanding (excluding 28,750,000 shares subject to possible redemption) at March 31, 2021

    1       —         (1   (n)     —    

Additional paid-in capital

    —         —         —        
        244,644     (f)  
        (4,000   (h)  
        89,965     (m)  
        564,078     (t), (u)  
        149,959     (r) ,(u)  
        (342,270   (g)  
        7,440     (l)     709,816  

Retained earnings (accumulated deficit)

    (38,750     —         —           (38,750

FOA Equity Capital LLC member’s equity

    —         641,736       —        
        423     (c)  
        (642,159   (o)     —    

Accumulated other comprehensive (loss) income

    —         (2     —        
        (23,951   (k)  
        (5,592   (j)  
        29,545     (o)     —    

Noncontrolling interest

    —         (564     564     (o)  
        1,658,548     (s), (u)     1,658,548  


TOTAL SHAREHOLDERS’ EQUITY

    (38,749     641,170       1,727,201         2,329,622  


TOTAL LIABILITIES, CRNCI AND SHAREHOLDERS’ EQUITY

  $ 293,876     $ 20,100,419     $ 1,493,417       $ 21,887,713  


65


Table of Contents

UNAUDITED PRO FORMA CONDENSED, COMBINED AND CONSOLIDATED STATEMENT OF OPERATIONS

For the Three Months Ended March 31, 2021

(in thousands, except share amounts)


    (a)
Replay Acquisition
Corp.
Three Months Ended
March 31, 2021
    (b)
Finance of America
Equity Capital, LLC
Three Months Ended
March  31, 2021
    Pro Forma
Adjustments
    Footnote
Reference
  Pro Forma
Combined
 

REVENUES


Gain on mortgage loans held for sale, net

      291,334       —           291,334  

Gain (loss) on revaluation of warrant liability

    9,943         (1,318   (e)     8,625  

Gain (loss) on marketable securities, dividends and interest held in Trust Account

    7         (7   (f)     —    

Net fair value gains on mortgage loans and related obligations

      76,663       —           76,663  

Fee income

      152,509       —           152,509  

Net interest expense:


Interest income

      12,661       —           12,661  

Interest expense

      (34,366     —           (34,366


Net interest expense

    —         (21,705     —           (21,705


TOTAL REVENUES

    9,950       498,801       (1,325       507,426  


EXPENSES


Salaries, benefits and related expenses

      238,530       —        
        10,517     (g)     249,047  

Occupancy, equipment rentals and other office related expenses

      7,597       —           7,597  

General and administrative expenses

    9,139       127,217       5,016     (h)     141,372  


TOTAL EXPENSES

    9,139       373,344       15,533         398,016  


NET INCOME BEFORE INCOME TAXES

    811       125,457       (16,858       109,410  

Provision for income taxes

    —         1,137       11,772     (i)     12,909  


NET INCOME (LOSS)

    811       124,320       (28,630       96,501  

CRNCI

      4,260       (4,260   (j)     —    

Noncontrolling interest

      201       67,784     (k)     67,985  


NET INCOME (LOSS) ATTRIBUTABLE TO NEW PUBCO

  $ 811     $ 119,859     $ (92,154     $ 28,516  


Earnings (Losses) Per Share:


Basic weighted average shares outstanding of Public Shares

    28,750,000          


Basic net income (loss) per share, Public Shares

  $ 0.02          


Diluted weighted average shares outstanding of Public Shares

    28,750,000          


Diluted net income (loss) per share, Public Shares

  $ 0.02          


Basic weighted average shares outstanding of Founder Shares

    7,187,500          


Basic net loss per share, Founder Shares

  $ 0.02          


Diluted weighted average shares outstanding of Founder Shares

    7,187,500          


Diluted net loss per share, Founder Shares

  $ 0.02          


Basic weighted average shares outstanding of New Pubco

            67,291,456  


Basic net income (loss) per share, New Pubco

        (l)   $ 0.42  


Diluted weighted average shares outstanding of New Pubco

            191,200,000  


Diluted net income (loss) per share, New Pubco

        (l)   $ 0.41  


66


Table of Contents

UNAUDITED PRO FORMA COMBINED CONSOLIDATED STATEMENT OF OPERATIONS

For the Year Ended December 31, 2020

(in thousands, except share amounts)


    (a)
Replay
Acquisition

Corp.
Year Ended
December 31,
2020
As Restated
    (b)
Finance of
America

Equity Capital,
LLC
Year Ended
December 31,
2020
       
    (c)
Offering and
Sale of
Senior

Notes
    Footnote
Reference
    Pro Forma
Adjustments
    Footnote
Reference
    Pro Forma
Combined
 

REVENUES


Gain on sale and other income from mortgage loans held for sale, net

    —         1,178,995           —           1,178,995  

Gain (loss) on revaluation of warrant liability

    (16,534           2,015       (e)       (14,519

Gain (loss) on marketable securities, dividends and interest held in Trust Account

    1,261       —             (1,261     (f)       —    

Net fair value gains on mortgage loans and related obligations

    —         311,698           —           311,698  

Fee income

    —         386,752           —           386,752  

Net interest expense:


Interest income

    —         42,584           —           42,584  

Interest expense

    —         (123,001     (25,066     (d)       (25,066       (148,067


Net interest expense

    —         (80,417     (25,066       (25,066       (105,483


TOTAL REVENUES

    (15,273     1,797,028       (25,066       (24,312       1,757,443  


EXPENSES


Salaries, benefits and related expenses

    —         868,265           —        
            77,208       (g)       945,473  

Occupancy, equipment rentals and other office related expenses

    —         29,621           —           29,621  

General and administrative expenses

    2,392       398,885           20,066       (h)       421,343  


TOTAL EXPENSES

    2,392       1,296,771       —           97,274         1,396,437  


NET INCOME BEFORE INCOME TAXES

    (17,665     500,257       (25,066       (121,586       361,006  

Provision for income taxes

    —         2,344           36,699       (i)       39,044  


NET INCOME (LOSS)

    (17,665     497,913       (25,066       (158,285       321,962  

CRNCI

      (21,749         21,749       (j)       —    

Noncontrolling interest

    —         1,274           223,589       (k)       224,863  


NET INCOME (LOSS) ATTRIBUTABLE TO NEW PUBCO

  $ (17,665   $ 518,388     $ (25,066     $ (403,623     $ 97,099  


67


Table of Contents
    (a)
Replay
Acquisition

Corp.
Year Ended
December 31,
2020
As Restated
    (b)
Finance of
America

Equity Capital,
LLC
Year Ended
December 31,
2020
       
    (c)
Offering and
Sale of
Senior

Notes
    Footnote
Reference
    Pro Forma
Adjustments
    Footnote
Reference
  Pro Forma
Combined
 

Earnings (Losses) Per Share:


Basic weighted average shares outstanding of Public Shares

    28,750,000              


Basic net income (loss) per share, Public Shares

  $ (0.48            


Diluted weighted average shares outstanding of Public Shares

    28,750,000              


Diluted net income (loss) per share, Public Shares

  $ (0.48            


Basic weighted average shares outstanding of Founder Shares

    7,187,500              


Basic net loss per share, Founder Shares

  $ (0.53            


Diluted weighted average shares outstanding of Founder Shares

    7,187,500              


Diluted net loss per share, Founder Shares

  $ (0.53            


Basic weighted average shares outstanding of New Pubco

                63,586,585  


Basic net income (loss) per share, New Pubco

            (l)   $ 1.53  


Diluted weighted average shares outstanding of New Pubco

                191,200,000  


Diluted net income (loss) per share, New Pubco

            (l)   $ 1.38  


68


Table of Contents
  1.

Basis of Presentation

The pro forma adjustments have been prepared as if the Business Combination had been consummated on March 31, 2021 in the case of the unaudited pro forma combined consolidated balance sheet and on January 1, 2020, the beginning of the earliest period presented in the case of the unaudited pro forma combined Consolidated Statements of Operations.

The unaudited pro forma combined consolidated financial information has been prepared assuming the following methods of accounting in accordance with GAAP.

The Business Combination will be accounted for using the acquisition method of accounting under the provisions of Accounting Standards Codification (“ASC”) Topic 805, Business Combinations (“ASC 805”) on the basis of New Pubco as the accounting acquirer and FoA as the accounting acquiree. The acquisition method of accounting is based on ASC 805 and uses the fair value concepts defined in ASC Topic 820, Fair Value Measurements (“ASC 820”). In general, ASC 805 requires, among other things, that assets acquired and liabilities assumed to be recognized at their fair values as of the acquisition date by Replay, who was determined to be the accounting acquirer.

ASC 820 defines fair value, establishes a framework for measuring fair value, and sets forth a fair value hierarchy that prioritizes and ranks the level of observability of inputs used to develop the fair value measurements. Fair value is defined in ASC 820 as “the price that would be received to sell an asset or paid to transfer a liability in an orderly transaction between market participants at the measurement date.” This is an exit price concept for the valuation of the asset or liability. In addition, market participants are assumed to be buyers and sellers in the principal (or the most advantageous) market for the asset or liability. Fair value measurements for a non-financial asset assume the highest and best use by these market participants. Many of these fair value measurements can be highly subjective, and it is possible that other professionals applying reasonable judgment to the same facts and circumstances, could develop and support a range of alternative estimated amounts.

For accounting purposes, the acquirer is the entity that has obtained control of another entity and, thus, consummated a business combination. The determination of whether control has been obtained begins with the evaluation of whether control should be evaluated based on the variable interest or voting interest model pursuant to ASC Topic 810, Consolidation (“ASC 810”). If the acquiree is a variable interest entity, the primary beneficiary would be the accounting acquirer.

The pro forma adjustments represent management’s estimates based on information available as of the date of this Registration Statement on Form S-1 and subject to change as additional information becomes available and additional analyses are performed. Management considers this basis of presentation to be reasonable under the circumstances.

Upon consummation of the Business Combination, Replay adopted FoA’s accounting policies. As a result of the adoption, there were no significant changes in accounting policies and no pro forma adjustments related to the alignment of the accounting policies of Replay and FoA.

Replay combined with FoA in the Business Combination, which resulted in New Pubco becoming a publicly-traded company on NYSE and controlling FoA in an “UP-C” structure. Upon completion of the Business Combination, New Pubco now controls FoA with the exclusive right to appoint the board of managers of FoA and is a holding company with no assets or operations other than its equity interest in FoA. As a result of the Business Combination, New Pubco initially owns approximately 31.3% of the economic interest of FoA, but has 100% of the voting power and has the right to appoint the board of managers of FoA. Immediately following the completion of the Business Combination, the ownership percentage held by the noncontrolling interest is approximately 68.7%.


69


Table of Contents
  1.

Adjustments and Assumptions to the Unaudited Pro Forma Combined Consolidated Balance Sheet as of March 31, 2021

The unaudited pro forma combined consolidated balance sheet as of March 31, 2021 reflects the following adjustments:


  (a)

Represents the Replay historical unaudited condensed balance sheet as of March 31, 2021.


  (b)

Represents the FoA historical unaudited consolidated statement of financial condition as of March 31, 2021.


  (c)

Reflects $0.4 million cash proceeds received to settle shareholder notes receivable held by FoA from certain officers of FoA to finance the purchase by the officers of equity units in UFG Holdings. The shareholder notes receivable were historically accounted for pursuant to ASC 718 as a grant of an equity-classified option award with the full amount of the grant date fair value recognized as compensation cost on the date of issuance.


  (d)

Represents the reclassification of the investments held in Replay’s trust account to cash and cash equivalents to liquidate these investments and make the funds available for general use by FoA.


  (e)

Represents a cash disbursement by New Pubco to settle the outstanding underwriting fees incurred by Replay in connection with the Replay initial public offering that were deferred until closing of the Business Combination.


  (f)

Represents the $250.0 million cash investment by Replay, net of $5.4 million in issuance costs, in exchange for the issuance of 25.0 million newly issued shares of Class A common stock with a par value of $0.0001 per share and a corresponding offset to Additional paid-in capital as a result of the executed PIPE Agreements.


  (g)

Represents cash distributions made to the Sellers and the Blocker GP for the sale of FoA Units to Replay as described in part (ii) in the Description of the Business Combination and a reduction to Additional paid-in capital. As stipulated in Section 8.01 of the Transaction Agreement the Company may make distributions, but only to the extent that the closing cash balance is equal to or greater than $250 million less transaction-related costs.


  (h)

Represents a $201.5 million cash disbursement from the trust account to holders of redeemable Replay Ordinary Shares for 19,753,406 Ordinary Shares of Replay that were redeemed at an assumed redemption price of approximately $10.20 per share based on the trust account balance as of March 31, 2021. The remaining 8,996,594 Ordinary Shares of Replay were not redeemed and thus converted into Class A Common Stock shares upon the Domestication, as further discussed in note (m) below.


  (i)

Represents the increase in Payables and accrued liabilities of $201.8 million and the settlement of $1.5 million in Due from related parties for the redemption of all of the outstanding Class B Units held by B2R in FACo Holdings, which will be paid by FoA in connection with the closing of the Business Combination in accordance with the FACo Holdings Agreement.


  (j)

Represents the increase of Payables and other liabilities with an offset to Accumulated other comprehensive (loss) income for the accrual of transaction costs incurred as a result of the transaction. Given that the accrual will occur upon the consummation of the transaction the Company will record the transaction costs on the black line.


  (k)

Reflects the increase of Payables and other liabilities with an offset to Accumulated other comprehensive (loss) income for the settlement and payment to employees who hold phantom units in FoA, pursuant to the terms of the Amended and Restated Long-Term Incentive Plan executed in October 2020. The payment is expected to be made promptly following the closing of the transaction. In connection with the consummation of the transaction, FoA expects to achieve the Hurdle associated with the phantom units which is accounted for as an in-substance


70


Table of Contents
  performance condition. As a result, compensation cost associated with this settlement of the phantom units will be recognized in full upon achieving the Hurdle at the time of the closing of the transaction. Given that the Hurdle will be achieved upon the consummation of the transaction the Company will record the compensation cost on the black line. Refer to note 24 in FoA’s notes to the unaudited consolidated financial statements for the three months ended March 31, 2021.


  (l)

Reflects the conversion of Replay Private Placement Warrants into Class A Common Stock of New Pubco. In connection with the Business Combination and pursuant to the Sponsor Agreement, Warrant Agreement, dated April 8, 2019, by and between Replay and Continental Stock Transfer & Trust Company and the Assignment, Assumption and Amendment Agreement, dated as of April 1, 2021, by and among New Pubco, Replay and Continental Stock Transfer & Trust Company, 7,750,000 Private Placement Warrants held by the Sponsor were exchanged for 775,000 Ordinary Shares prior to the Domestication, which were converted by virtue of the Domestication to 775,000 Purchaser Common Units, which were converted by virtue of the Purchaser Merger to an aggregate of 775,000 shares of Class A Common Stock of New Pubco.


  (m)

Represents the conversion of 8,996,594 redeemable Ordinary Shares of Replay that were not redeemed and thus converted into shares of Class A Common Stock with an offset to Additional paid-in capital upon the Domestication.


  (n)

Represents the automatic conversion on a one-for-one basis of the outstanding non-redeemable Ordinary Shares of Replay into Replay LLC Units, which will then automatically convert into the right to receive shares of Class A Common Stock upon the Domestication.


  (o)

Represents the adjustment for FoA equity that is reclassified to Goodwill. FoA has been, and will continue to be, treated as a partnership for U.S. federal and state income tax purposes. As such, FoA’s profits and losses will flow through to its partners, including New Pubco, and are generally not subject to significant entity level taxes at the FoA level. Upon completion of Business Combination, New Pubco will control FoA as the appointer of the board of managers of FoA and will be a holding company with no assets or operations other than its equity interest in FoA.

As a result of the Business Combination, New Pubco initially owns approximately 31.3% of the economic interest of FoA, but has 100% of the voting power and controls the management of FoA. Immediately following the completion of the Business Combination, the ownership percentage held by the noncontrolling interest is approximately 68.7%.


  (p)

As a result of the transaction, New Pubco will be subject to U.S. federal income taxes, in addition to state, local and foreign taxes. As a result, the pro forma balance sheet reflects an adjustment to our taxes assuming the federal rates currently in effect and the highest statutory rates apportioned to each state, local and foreign jurisdiction. The total presented deferred tax liability is measured based on the following: (i) outside tax basis vs. US GAAP basis of New Pubco’s interest in the Company; (ii) net operating losses carried over from the Blocker; and (iii) tax receivable agreement liability. In order to determine the outside tax basis used in the calculation of that portion of the net deferred tax liability, the Company considered the tax basis in the units acquired by Replay, the Founder Shares, and the interest in the Company that was acquired as part of the Blocker Merger, as described in part (v) of the Description of the Business Combination.

We have recorded a deferred tax liability of $22.1 million. The deferred tax liability includes (i) a deferred tax liability of $33.1 million related to New Pubco’s investment in FoA, consisting of $24.0 million and $9.1 million from Blocker carryover and Founder Shares, respectively, and (ii) a deferred tax asset of $11.0 million related to tax benefits from future deductions attributable to payments under the Tax Receivable Agreement as described further in note (q) directly below. To the extent we determine it is more likely-than-not that we will not realize the full benefit represented by the deferred tax asset, we will record an appropriate valuation allowance based on an analysis of the objective or subjective negative evidence.


71


Table of Contents

Refer to note (u) for the purchase price allocation.


  (q)

In connection with the Business Combination, concurrently with the Closing, New Pubco entered into the Blackstone Tax Receivable Agreement and the FoA Tax Receivable Agreement. The Tax Receivable Agreements generally provide for the payment by New Pubco to the TRA Parties of 85% of the cash tax benefits, if any, that New Pubco is deemed to realize (calculated using certain assumptions) as a result of (i) tax basis adjustments as a result of sales and exchanges of FoA Units in connection with or following the Business Combination and certain distributions with respect to FoA Units, (ii) New Pubco’s utilization of certain tax attributes attributable to Blocker or the Continuing Stockholders, and (iii) certain other tax benefits related to entering into the Tax Receivable Agreements. New Pubco generally will retain the benefit of the remaining 15% of these cash tax benefits.

The $42.3 million adjustment related to the Tax Receivable Agreements assumes: (1) $342.3 million of cash paid to the TRA Parties in connection with the Business Combination (excluding the impact of additional transaction costs incurred as a result of the ransaction), (2) a share price equal to $10.00 per share, (3) a constant U.S. federal income tax rate of 21.0% and an assumed weighted-average state and local income tax rate of 5.13%, (4) no material changes in tax law, (5) the ability to utilize tax attributes based on current tax forecasts, and (6) future payments under the Tax Receivable Agreements.

The amount of the expected future payments under the Tax Receivable Agreements has been discounted to its present value using a discount rate of 9% as a result of the application of purchase accounting following ASC 805.

The adjustments related to the Tax Receivable Agreements have been recorded as an adjustment to Goodwill. Refer to note (u) for details of the consideration transferred and the purchase price allocation. New Pubco anticipates that it will account for the income tax effects resulting from future taxable exchanges of FoA Units by the TRA Parties for shares of Class A Common Stock or the cash equivalent thereof by recognizing an increase in deferred tax assets, based on enacted tax rates at the date of each exchange. Further, New Pubco will evaluate the likelihood that New Pubco will realize the benefit represented by the deferred tax asset, and, to the extent that New Pubco estimates that it is more likely than not that New Pubco will not realize the benefit, New Pubco will reduce the carrying amount of the deferred tax asset with a valuation allowance.

The amount of expected future payments under the Tax Receivable Agreements is dependent upon a number of factors, including New Pubco’s cash tax savings, the enacted tax rate in the years in which it utilizes tax attributes subject to the Tax Receivable Agreements, and current tax forecasts. These estimated rates and forecasts are subject to change based on actual results and realizations, which could have a material impact on the liability to be paid. If New Pubco exercises its right to terminate the Tax Receivable Agreements or in the case of a change in control of New Pubco or a material breach of New Pubco’s obligations under either the Blackstone Tax Receivable Agreement or the FoA Tax Receivable Agreement, all obligations under the Tax Receivable Agreements will be accelerated and New Pubco will be required to make a payment to the TRA Parties in an amount equal to the present value of future payments under the Tax Receivable Agreements, which payment would be based on certain assumptions, including that New Pubco would have sufficient taxable income to fully utilize the deductions arising from the tax deductions, tax basis and other tax attributes subject to the Tax Receivable Agreements. If New Pubco were to elect to terminate the Tax Receivable Agreements immediately after the Business Combination, (i) assuming the market value of a share of Class A Common Stock is equal to the FoA Units Cash Consideration paid per FoA Unit in connection with the Business Combination, (ii) assuming that 19,753,406 Public Shareholders exercised their right to have their Ordinary Shares redeemed on completion of the Business Combination, (iii) taking into account the effects of any cash payments paid under the A&R MLTIP in connection


72


Table of Contents

with the Business Combination (but disregarding the effects of any issuance of Replacement RSUs or Class A Common Stock pursuant to the A&R MLTIP or any payments that may be made pursuant to the A&R MLTIP that are not paid in connection with the Closing), and (iv) disregarding the effects of the issuance of any Earnout Securities, New Pubco currently estimates that it would be required to pay approximately $427.1 million to satisfy its total liability.


  (r)

Represents the estimated fair market value of the seller earnout, which will be settled with shares of Class A Common Stock and is accounted for as a contingent consideration in accordance with ASC 805. The equity owners of FoA prior to the Closing are entitled to receive an earnout exchangeable for Class A Common Stock if, at any time during the six years following Closing, the volume weighted average price of Class A Common Stock with respect to a trading day (the “VWAP”) is greater than or equal to $12.50 for any 20 trading days within a consecutive 30-trading-day period, 50% of the Earnout Securities will be issued; and if, at any time during the six years following Closing, the VWAP is greater than or equal to $15.00 for any 20 trading days within a consecutive 30-trading-day period, the remaining 50% of the Earnout Securities will be issued. As a result, the seller earnout adjustment is an adjustment of $150.0 million to Goodwill and a corresponding increase of $150.0 million to Additional paid-in capital. The adjustment amount was determined by using a Monte Carlo simulation to forecast the future daily price per share of Class A Common Stock over a six-year time period. Refer to note (u) for details of the consideration transferred and the purchase price allocation.


  (s)

The adjustment represents the fair market value of the noncontrolling interest of FoA Units retained by the Continuing Unitholders and shares of Class B Common Stock of New Pubco that provide the Continuing Unitholders with one-to-one voting rights for each share of Class B Common Stock they own based on the organization structure as a result of the Business Combination. See table below for the computation of the controlling and noncontrolling interest:


     Amount      Percentage  

FoA Units held by New Pubco

     59,881,714        31.3

FoA Units retained by Continuing Unitholders

     131,318,286        68.7


Total FoA Units

     191,200,000        100.0


In addition to the 191,200,00 FoA Units outstanding, an additional 4,258,500 units will be issued upon the consummation of the Business Combination which relate to shares of unvested Class A Common Stock. Such shares will be subject to vesting and forfeiture restrictions and will have no rights to distributions or economics until such vesting conditions have been satisfied. Refer to “Other Agreements Related to the Transaction Agreement—Sponsor Agreement” for additional details.

Refer to note (u) for details of the consideration transferred and the purchase price allocation.


  (t)

This adjustment reflects the issuance of 34,106,714 shares of Class A common stock with a par value of $0.0001 per share and Additional paid-in capital of $564.1 million related to the consideration transferred by Replay and Blocker, which together, along with the PIPE investors discussed in note (f), comprise the controlling interest in FoA.

Refer to note (u) for details of the consideration transferred and the purchase price allocation.


  (u)

Represents the adjustment for the estimated preliminary purchase price allocation for the FoA business resulting from the Business Combination. The preliminary calculation of total consideration and allocation of the purchase price to the fair value of FoA’s assets acquired and liabilities assumed is presented below as if the Business Combination were consummated on March 31, 2021. New Pubco has not completed the detailed valuations necessary to estimate the fair value of the assets acquired and the liabilities assumed and, accordingly, the adjustments to


73


Table of Contents
  record the assets acquired and liabilities assumed at fair value reflect the best estimates of New Pubco based on the information currently available and are subject to change once additional analyses are completed.


     (in thousands)  

Consideration Transferred


Total cash consideration

   $ 342,270  

Blocker rollover equity

     221,811  

Seller Earnout contingent consideration

     149,959  

Tax Receivable Agreement obligations to the Seller

     42,265  


Total consideration transferred

   $ 756,305  

Non-controlling interest

     1,658,548  


Total equity value

     2,414,853  


Recognized amounts of identifiable assets acquired and liabilities assumed


Cash and cash equivalents

     348,178  

Restricted cash

     305,292  

Reverse mortgage loans held for investment, subject to HMBS related obligations, at fair value

     10,071,192  

Mortgage loans held for investment, subject to nonrecourse debt, at fair value

     5,291,444  

Mortgage loans held for investment, at fair value

     1,100,544  

Mortgage loans held for sale, at fair value

     2,140,361  

Debt securities

     9,230  

Mortgage servicing rights, at fair value

     267,364  

Derivative assets, at fair value

     116,480  

Fixed assets and leasehold improvements, net

     26,079  

Other Assets, net

     278,163  

Deferred tax asset (liability)

     (22,099

Intangible assets, net

     378,100  

Due from (to) related parties

     —    

Goodwill

     1,591,854  

HMBS related obligations, at fair value

     (9,926,132

Nonrecourse debt, at fair value

     (5,227,943

Other financing lines of credit

     (3,340,345

Payables and other liabilities

     (656,613

Notes payable, net

     (336,296


Net assets acquired

   $ 2,414,853  


Intangible Assets. Intangible assets were identified that met either the separability criterion or the contractual legal criterion described in ASC 805. The trade name intangible assets represent the values of all of the Company’s trade names. The broker/customer relationships intangible asset represents the existing broker/customer relationships and the developed technology intangible asset represents internally developed technology that had been obtained through FoA’s past acquisitions.


Identifiable intangible assets

   Fair value (in
thousands)
     Useful life (in years)  

Indefinite lived trade name

   $ 153,300        n/a  

Broker/customer relationships

     223,800        10.0  

Developed technology

     1,000        5.0  


Total

   $ 378,100     


74


Table of Contents

Goodwill. Approximately $1,591.9 million has been allocated to goodwill. Goodwill represents the excess of the gross consideration transferred over the fair value of the underlying net tangible and identifiable intangible assets acquired. Goodwill represents future economic benefits arising from acquiring FoA primarily due to its strong market position and its assembled workforce that are not individually identified and separately recognized as intangible assets.

In accordance with ASC Topic 350, Goodwill and Other Intangible Assets, goodwill and indefinite lived intangible assets related to certain acquired brands will not be amortized, but instead will be tested for impairment at least annually or more frequently if certain indicators are present. In the event management of the combined company determines that the value of goodwill and/or indefinite/finite lived intangible assets has become impaired, an accounting charge for impairment during the quarter in which the determination is made may be recognized.


  2.

Adjustments and Assumptions to the Unaudited Pro Forma Combined Consolidated Statement of Operations for the three months ended March 31, 2021 and for the year ended December 31, 2020.

The unaudited pro forma combined Consolidated Statements of Operations for the three months ended March 31, 2021 and for the year ended December 31, 2020, respectively, reflect the following adjustments:


  (a)

Represents the Replay historical unaudited condensed statement of operations for the three months ended March 31, 2021 and the restated audited statement of operations for the year ended December 31, 2020 respectively.


  (b)

Represents the FoA historical unaudited Consolidated Statements of Operations for the three months ended March 31, 2021 and the audited Consolidated Statements of Operations for the year ended December 31, 2020, respectively.


  (c)

Represents the impact of the 7.875% Senior Notes offering by FoA.


  (d)

Reflects an increase in interest expense of $25.1 million for the year ended December 31, 2020, as a result of the Senior Notes offering due to the incurrence of $350.0 million borrowings, assuming a fixed stated interest rate of 7.875%, as well as amortization of the original issue discount and deferred financing costs.


  (e)

Represents the elimination of the gain (loss) on the remeasurement of the Replay Private Placement Warrants for the three months ended March 31, 2021 and year ended December 31, 2020. In connection with the Business Combination and pursuant to the Sponsor Agreement, Warrant Agreement, dated April 8, 2019, by and between Replay and Continental Stock Transfer & Trust Company and that the Assignment, Assumption and Amendment Agreement, dated as of April 1, 2021, by and among New Pubco, Replay and Continental Stock Transfer & Trust Company, 7,750,000 Private Placement Warrants held by the Sponsor were exchanged for 775,000 Ordinary Shares prior to the Domestication, which were converted by virtue of the Domestication to 775,000 Purchaser Common Units, which were converted by virtue of the Purchaser Merger to an aggregate of 775,000 shares of Class A Common Stock.


  (f)

Represents the elimination of gains on marketable securities, dividends and interest held in Replay’s Trust Account.


  (g)

Represents compensation cost of $10.5 million and $77.2 million for the three months ended March 31, 2021 and year ended December 31, 2020, respectively, related to the vesting of Replacement RSUs and Earnout Right RSUs of New Pubco.

Pursuant to the terms of the A&R MLTIP, FoA will grant to each employee who held phantom units in FoA and remains employed as of the RSU grant date, in consideration for


75


Table of Contents

the cancellation of their phantom units, Replacement RSUs that will vest into shares of New Pubco Class A Common Stock with a grant date fair value that approximates the transaction price per share of Class A Common Stock. Following the terms of the A&R MLTIP, 25% of the Replacement RSUs will vest on the RSU grant date, and the remaining 75% will vest in equal installments on each of the first three anniversaries of the closing of the transaction, subject to each holder’s continued employment. The compensation cost recognized in this adjustment is equal to the grant date fair value of the Replacement RSUs multiplied by the portion of the Replacement RSUs that would have vested if the award had been outstanding on January 1, 2020 using a straight line attribution method.

In addition to the Replacement RSUs, participants in the A&R MLTIP will be entitled to receive additional Earnout Right RSUs if New Pubco achieves specified volume-weighted average price per share targets of $12.50 per share and $15.00 per share during the six year period following the transaction, subject to continued employment. The Earnout Right RSUs will have the same service-based vesting conditions as the Replacement RSUs to which they relate, as discussed above. The volume-weighted average price per share targets have been treated as market-based vesting conditions and have been factored into the grant date fair value measurement of the Earnout Right RSUs using a Monte Carlo simulation. The compensation cost recognized in this adjustment is equal to the grant date fair value of the Earnout Right RSUs multiplied by the portion of the Earnout Right RSUs that would have service vested if the award had been outstanding on January 1, 2020 using a graded vesting attribution method.

The total compensation cost associated with the vesting of the Replacement RSUs and Earnout Right RSUs will be directly allocated to the noncontrolling interest and Blocker.


  (h)

Represents adjustments to incorporate additional intangible assets amortization for the step-up in basis from purchase price accounting (“PPA”) at the closing of the Business Combination. This pro forma adjustment has been proposed assuming the Business Combination happened on January 1, 2020. The following table is a summary of information related to certain intangible assets acquired, including information used to calculate the pro forma change in amortization expenses that is adjusted to General and administrative expenses:


Identifiable intangible assets

   Fair value (in
thousands
     Useful life
(in years)
     Amortization
Expense for the
Three Months
Ended March 31,
2021
     Amortization
expense for the
Year ended
December 31,
2020
 

Indefinite lived trade name

   $ 153,300        n/a        —        $ —    

Broker/customer relationships

     223,800        10.0        5,595        22,380  

Developed technology

     1,000        5.0        50        200  


Total

   $ 378,100         $ 5,645      $ 22,580  


Less: Historical amortization expense

           629        2,514  


Pro forma adjustments

         $ 5,016      $ 20,066  


  (i)

FoA has been, and will continue to be, treated as a partnership for U.S. federal and state income tax purposes. As such, FoA’s profits and losses will flow through to its partners, including New Pubco, and are generally not subject to tax at the FoA level. Following the consummation of the Business Combination, New Pubco will be subject to U.S. federal income taxes, in addition to state, local and foreign taxes.


76


Table of Contents

As a result, the pro forma adjustment for provision for income taxes represents tax expense on income that will be taxable in jurisdictions after our corporate reorganization that previously had not been taxable. The adjustment is calculated as pro forma income attributable to New Pubco before income taxes multiplied by the pro forma effective tax rate, which is representative of the blended statutory tax rate, of 26.1%, for the three months ended March 31, 2021 and for the year ended December 31, 2020.

The table below includes a reconciliation of the blended statutory tax rate applied to each of the pro forma adjustments in arriving at the pro forma effective tax rates discussed above:


U.S Federal Statutory Income Tax Rate

     21.00

Blended State Rate net of Federal Benefit

     5.13


Blended Statutory Tax Rate

     26.13


  (j)

Represents the elimination of Net income (loss) attributable to CRNCI.


  (k)

As a result of the Business Combination, New Pubco controls FoA and has the exclusive right to appoint the board of managers of FoA and is a holding company with no assets or operations other than its equity interest in FoA.

New Pubco initially owns approximately 31.3% of the economic interest of FoA, but has 100% of the voting power and will control the management of FoA. Immediately following the completion of the Business Combination, the ownership percentage held by the noncontrolling interest is approximately 68.7%.

In addition, as discussed above in note (g) expenses associated with the A&R MLTIP will be directly allocated to the noncontrolling interest and Blocker.


  (l)

Represents the basic and diluted income per share as a result of the pro forma adjustments for the three months ended March 31, 2021 and for the year ended December 31, 2020, respectively. The table below presents the pro forma basic and diluted earnings per share for New Pubco:


     For the Three

Months ended

March 31, 2021

     For the Year ended
December 31,
2020
 

(in thousands, except share-related amounts)


Basic net income per share:


Numerator


Net income

   $ 96,501      $ 321,962  

Less: income attributable to noncontrolling interests

     67,985        224,863  


Net income attributable to holders of Class A Common Stock - basic

   $ 28,516      $ 97,099  


Denominator


Shares of Class A Common Stock issued to Replay, PIPE Investors and Blocker

     59,881,714        59,881,714  

Assumed Replacement RSUs legally vested during the period

     7,409,742        3,704,871  


Weighted average shares of Class A Common Stock outstanding - basic

     67,291,456        63,586,585  


Basic net income per share

   $ 0.42      $ 1.53  


77


Table of Contents
     For the Three

Months ended

March 31, 2021

     For the Year ended
December 31,
2020
 

Diluted net income per share:


Numerator


Net income attributable to holders of Class A Common Stock

   $ 28,516      $ 97,099  

Reallocation of net income assuming exchange of Class A Units (1)

     50,222        166,108  


Net income attributable to holders of Class A Common Stock - diluted

   $ 78,737      $ 263,208  


Denominator


Weighted average shares of Class A Common Stock outstanding - basic

     67,291,456        63,586,585  

Effect of dilutive securities:


Assumed exchange of Class A Units for shares of Class A Common Stock (2)

     123,908,544        127,613,415  


Weighted average shares of Class A Common Stock outstanding - diluted

     191,200,000        191,200,000  


Diluted net income (loss) per share

   $ 0.41      $ 1.38  


  (1)

This adjustment assumes the after-tax elimination of noncontrolling interest due to the assumed exchange of all Class A Units outstanding for shares of Class A Common Stock as of the beginning of the period.

  (2)

The if-converted method for the diluted weighted average share calculation is used to give effect to the provisions of the Exchange Agreement and assume the Class A Unitholders exchange their units on a one-for-one basis for shares of New Pubco Class A Common Stock.

Diluted income per share was calculated following the if-converted method, which was determined to be more dilutive than applying the treasury stock method for the periods presented. The if-converted method assumes that the Class A Unitholders, representing the noncontrolling interest, exchange their units on a one-for-one basis for shares of New Pubco Class A Common Stock. Following the terms of the A&R LLC Agreement, the Class A Unitholders will bear approximately 86% of the cost of the one-time lump sum cash payment to holders of phantom units and any vesting associated with the Replacement RSUs and Earnout Right RSUs prior to any distribution by FoA to such Class A Unitholders. The remaining compensation cost associated with the phantom units, Replacement RSUs and Earnout Right RSUs will be shared by Blocker. As a result of the application of the if-converted method, in arriving at diluted net income per share, the entirety of the compensation cost associated with the phantom units and vesting of the Replacement RSUs and Earnout Right RSUs is assumed to be included in the net income attributable to holders of Class A Common Stock.


  (m)

The pro forma adjustments described above do not reflect an elimination of $4.0 million and $9.0 million of transaction costs incurred by FoA in its historical unaudited consolidated statement of operations for the three months ended March 31, 2021 and historical audited consolidated statement of operations for the year ended December 31, 2020, respectively.


78


Table of Contents

MANAGEMENT’S DISCUSSION AND ANALYSIS

OF FINANCIAL CONDITION AND RESULTS OF OPERATIONS

The following discussion of our financial condition and results of operations (“MD&A”) should be read together with our consolidated financial statements and related notes. This discussion and analysis contains forward-looking statements that involve risk, uncertainties and assumptions. Our actual results could differ materially from those anticipated in the forward-looking statements as a result of many factors. Except where the context otherwise requires, the terms “Finance of America Companies,” “Finance of America,” “FOA Equity Capital,” “FoA,” “we,” “us,” or “our” refer to the business of Finance of America Equity Capital LLC and its consolidated subsidiaries.

Overview

Finance of America is a vertically integrated, diversified lending platform that connects borrowers with investors. We offer a diverse set of high quality consumer loan products and distribute financial risk to investors for an up-front cash profit and typically some future performance-based participation. We believe we have a differentiated, less volatile strategy than mono-line mortgage lenders who focus on originating interest rate sensitive traditional mortgages and retain significant portfolios of mortgage servicing rights with large potential future advancing obligations. In addition to our profitable lending operations, we provide a variety of services to lenders through our Lender Services segment, which augments our lending profits with an attractive fee-oriented revenue stream. Our differentiated strategy is built upon a few key fundamental factors:


We operate in a diverse set of lending markets that benefit from strong, secular tailwinds and are each influenced by different demand drivers, which we believe results in stable and growing earnings with lower volatility and lower mortgage market correlation than a traditional mortgage company.


We seamlessly connect borrowers with investors. Our consumer-facing business leaders interact directly with the investor-facing professionals in our Portfolio Management segment, facilitating the development of attractive lending solutions for our customers with the confidence that the loans we generate can be efficiently and profitably sold to a deep pool of investors. While we often retain a future performance-based participation in the underlying cash flows of our loan products, we seek to programmatically and profitably monetize most of our loan products through a variety of investor channels, which minimizes capital at risk.


We distribute our products through multiple channels, and utilize flexible technology platforms and a distributed workforce in order to scale our businesses and manage costs efficiently. Our businesses are supported by a centralized business excellence office (“BXO”), providing all corporate support, including IT, Human Resources, Legal, Risk and Compliance. This platform enables us to be product agnostic, with the ability to focus our resources as the opportunity set evolves while not being overly reliant on any individual product. As borrower demands for lending products change, we are able to change with them and continue to offer desirable lending solutions.

Today, we are principally focused on (1) residential mortgage loan products throughout the U.S., offering traditional mortgage loans, reverse mortgage loans, and (2) business purpose loans to real estate investors. We have built a distribution network that allows our customers to interact with us through their preferred method: in person, via a broker or digitally. Our product offering diversity makes us resilient in varying rate and origination environments, and differentiates us from traditional mortgage lenders. Our Lender Services segment supports a range of financial institutions, including our lending companies, with services such as title insurance and settlement services, appraisal management, valuation and brokerage services, fulfillment services, and technology platforms for student loans, consumer loans and home sharing services. In addition to creating recurring third-party revenue streams, these service business lines allow us to better serve our lending customers and maximize our revenue per lending transaction. Furthermore, our Portfolio Management segment provides structuring and product development expertise, allowing innovation and improved visibility of execution for our originations, as well as a broker/dealer and institutional asset management capabilities. These capabilities allowed us to complete profitable sales of our loan products via securitization, including 10 securitizations during an otherwise volatile 2020, demonstrating the high quality and liquidity of the loan products we originate, the


79


Table of Contents

deep relationships we have with our investors and the resilience of our business model in any market environment.

The Business Combination

On October 12, 2020, FOA and Replay Acquisition Corp. (“Replay Acquisition”), a publicly traded special purpose acquisition company, agreed to a business combination that will result in Finance of America becoming a publicly listed company. FoA, Replay Acquisition, Finance of America Companies Inc., a Delaware corporation and wholly owned subsidiary of Replay (“New Pubco”); RPLY Merger Sub LLC, a Delaware limited liability company and wholly owned subsidiary of New Pubco (“Replay Merger Sub”); RPLY BLKR Merger Sub LLC, a Delaware limited liability company and wholly owned subsidiary of New Pubco (“Blocker Merger Sub”); Blackstone Tactical Opportunities Fund (Urban Feeder) – NQ L.P., a Delaware limited partnership (“Blocker”); Blackstone Tactical Opportunities Associates – NQ L.L.C., a Delaware limited liability company (“Blocker GP”); BTO Urban Holdings L.L.C., a Delaware limited liability company (“BTO Urban”), Blackstone Family Tactical Opportunities Investment Partnership – NQ – ESC L.P., a Delaware limited partnership (“ESC”), Libman Family Holdings LLC, a Connecticut limited liability company (“Family Holdings”), The Mortgage Opportunity Group LLC, a Connecticut limited liability company (“TMO”), L and TF, LLC, a North Carolina limited liability company (“L&TF”), UFG Management Holdings LLC, a Delaware limited liability company (“Management Holdings”), and Joe Cayre (each of BTO Urban, ESC, Family Holdings, TMO, L&TF, Management Holdings and Joe Cayre, a “Seller” and, collectively, the “Sellers” or the “Continuing Unitholders”); and BTO Urban and Family Holdings, solely in their joint capacity as the representative of the Sellers pursuant to Section 12.18 of the Transaction Agreement (as defined below) (the “Seller Representative”), entered into a Transaction Agreement (the “Transaction Agreement”) pursuant to which Replay agreed to combine with FoA in a series of transactions (collectively, the “Business Combination”) that will result in New Pubco becoming a publicly-traded company on the New York Stock Exchange (the “NYSE”) as of April 1, 2021, with trading beginning on April 5, 2021 under the ticker symbol ‘FOA’ and controlling FoA in an “UP-C” structure. For a description of the Business Combination, see “Proposal No. 1 – The Business Combination Proposal” in Replay Acquisition’s Form S-4/A filed with the SEC on February 20, 2021. Replay Acquisition’s central index key number is 0001763731.

Capitalized terms used and not defined herein have the meanings assigned to them in the Proxy Statement/ Prospectus.

Our Segments

We manage our Company in five reportable segments: Portfolio Management, Mortgage Originations, Reverse Originations, Commercial Originations, and Lender Services. A description of the business conducted by each of these segments is provided below:

Portfolio Management

Our Portfolio Management segment provides product development, loan securitization, loan sales, risk management, asset management and servicing oversight services to the enterprise and third-party funds. The team is primarily based in St. Paul, MN and New York, NY.

As part of the vertical integration of our business, our Portfolio Management team acts as the connector between borrowers and investors. The direct connections to investors complete the lending lifecycle in a way that allows us to innovate and manage risk through better price and product discovery. Given our scale, we are able to “do our own deals” and where appropriate, retain assets on balance sheet for attractive return opportunities. These retained investments are a source of growing and recurring earnings.

The retained asset portfolio generally consists of two classifications of assets: short-term investments and long-term investments. Short-term investments are primarily proprietary whole loans and securities that are held for


80


Table of Contents

sale and loans bought out from home equity conversion mortgages (“HECM”) securitizations prior to assignment to Government National Mortgage Association (“Ginnie Mae”). Long-term investments are primarily made up of mortgage servicing rights, securitized HECM loans, securitized proprietary whole loans (including retained securities and residual interests in securitization trusts), and whole loans not yet securitized.

The retained assets are initially recorded to the portfolio at a designated fair-value-based transfer price, if originated by any of the Company’s origination segments (“Net origination gains” recognized by the origination segments), or at the price purchased from external parties. Retained financial assets are subsequently recorded at their current fair value on an ongoing basis.

The Portfolio Management segment generates revenue and earnings in the form of gain on sale of loans, fair value gains, interest income, servicing income, fees for underwriting, advisory and valuation services and other ancillary fees.

Mortgage Originations

Our Mortgage Originations segment originates residential mortgage loans through our Finance of America Mortgage LLC (“FAM”) subsidiary. This segment generates revenue through fee-based mortgage loan origination services and the origination and sale of mortgage loans into the secondary market. We generally sell all originated mortgage loans into the secondary market within 30 days of origination and elect whether to sell or retain the rights to service the underlying mortgage loans based on the economics in the market and Company portfolio investment strategies. Whether the Company elects to sell or retain the rights to service the underlying loans, the Mortgage Originations segment realizes the fair value of the mortgage servicing rights in gain on sale. Performance of the retained mortgage servicing rights after origination are accounted for within the Portfolio Management segment results.

The Mortgage Originations segment includes three channels:


Distributed Retail - Our distributed retail lending channel relies on mortgage advisors in retail branch locations across the country to acquire, interact with, and serve customers.


Direct to Consumer - Our direct-to-consumer lending channel relies on our call centers, website and mobile apps to interact with customers. Our primary focus is to assist our customers with a refinance or home purchase by providing them with a needs-based approach to understanding their current mortgage options.


TPO - Our third-party-originator (“TPO”) lending channel works with mortgage brokers to source loans which are underwritten and funded by us in our name. Counterparty risk is mitigated through quality and compliance monitoring, and all brokers are subject to our eligibility requirements coupled with an annual recertification process.

Our mortgage lending activities primarily consist of the origination and sale of residential mortgage loans to the government sponsored entities (“GSEs”), Federal National Mortgage Association (“Fannie Mae” or “FNMA”), Federal Home Loan Mortgage Corporation (Freddie Mac or (FHLMC”), and Ginnie Mae, as well as private investors. The Mortgage Originations segment generates revenue and earnings in the form of gain on sale of loans, fair value gains, interest income, servicing income, and origination fees earned on the successful origination of mortgage loans.

Reverse Originations

Our Reverse Originations segment originates or acquires reverse mortgage loans through our Finance of America Reverse LLC (“FAR”) subsidiary. This segment originates HECMs, and proprietary jumbo reverse mortgages, referred to as “non-agency reverse mortgages.”


81


Table of Contents

We securitize HECMs into Home Equity Conversion Mortgage-Backed Securities (“HMBS”), which Ginnie Mae guarantees, and sell them in the secondary market while retaining the rights to service. Non-agency reverse mortgages, which compliment the Federal Housing Administration (“FHA”) HECM for higher value homes, may be sold as whole loans to investors or held for investment and pledged as collateral to securitized nonrecourse debt obligations. Non-agency reverse mortgage loans are not insured by the FHA.

We originate reverse mortgage loans through the following channels:


Retail - Our retail channel consists of a centralized retail platform, which includes a telephone based platform with multiple loan officers in one location. Our retail network controls all of the loan origination process, including sourcing the borrower, processing the application, setting the interest rate, ordering appraisal and underwriting, processing, closing and funding the loan.


TPO - Our TPO channel originates through third-party mortgage brokers and correspondent lenders. Our wholesale channel reviews and underwrites the application submitted by our mortgage brokers and correspondent lenders and approves or denies the application and sets the interest rate.

Our reverse mortgage lending activities primarily consist of the origination and securitization of mortgage loans to Ginnie Mae and other private investors. The Reverse Originations segment generates revenue and earnings in the form of fair value gains at the time of origination (“Net origination gains”) and origination fees earned on the successful origination of mortgage loans.

Commercial Originations

Our Commercial Originations segment originates or acquires commercial mortgage loans through our Finance of America Commercial LLC (“FACo”) subsidiary. The segment provides business purpose lending solutions for residential real estate investors in two principal ways: short-term loans to provide rehab and construction of investment properties meant to be sold upon completion, and investor rental loans collateralized by either a single asset or portfolio of properties. The segment does not provide financing for consumer-purpose, owner occupied loans or non-residential purpose commercial lending.

We originate commercial mortgage loans through the following channels:


Retail - Our retail channel consists of sales team members located throughout the United States with concentrations in Charlotte, NC, Chicago, IL, and Irvine, CA. Our retail network controls all of the loan origination process, including sourcing the borrower, processing the application, setting the interest rate, ordering appraisal and underwriting, processing, closing and funding the loan.


TPO - Our TPO channel originates through third-party mortgage brokers and correspondent lenders. Our wholesale channel reviews and underwrites the application submitted by our mortgage brokers and correspondent lenders and approves or denies the application and sets the interest rate.

Our commercial mortgage lending activities primarily consist of the origination, sale or securitization of commercial mortgages to private investors. The Commercial Originations segment generates revenue and earnings in the form of fair value gains at the time of origination (“Net origination gains”) and origination fees earned on the successful origination of mortgage loans.

Lender Services

Our Lender Services segment provides ancillary business services, title agency and title insurance services, mortgage servicing rights (“MSR”) valuation and trade brokerage, and appraisal management services to customers in the residential mortgage, student lending, and commercial lending industries. The segment also operates a foreign branch in the Philippines for fulfillment transactional and administrative support.


82


Table of Contents

Our Lender Services business typically generates revenue and earnings in the form of fee-for-service revenue or commissions on successful MSR trades.

Business Trends and Conditions

There are a number of key factors and trends affecting our results of operations. A summary of key factors impacting our revenue include:


prevailing interest rates which impact loan origination volume, with declining interest rates leading to increases in refinance volume, and an increasing interest rate environment leading to decreases in the refinance volume;


housing market trends which also impact loan origination volume, with a strong housing market leading to higher loan origination volume, and a weak housing market leading to lower loan origination volume;


demographic and housing stock trends which impact the addressable market size of mortgage, reverse and commercial loan originations;


increases in loan modifications, delinquency rates, delinquency status and prepayment speeds; and


broad economic factors such as the strength and stability of the overall economy, including the unemployment level and real estate values which have been substantially affected by the COVID-19 pandemic, further discussed below. The COVID-19 outbreak poses unique challenges to our business and the effects of the pandemic could adversely impact our ability to originate and service mortgages, manage our portfolio of assets and provide lender services and could also adversely impact our counterparties, liquidity and employees.

Other factors that may affect our cost base include trends in salaries and benefits costs, sales commissions, technology, rent, legal, compliance and other general and administrative costs. Management continually monitors these costs through operating plans.

Impact of COVID-19

On January 30, 2020, the World Health Organization (“WHO”) announced a global health emergency because of a new strain of coronavirus (the “COVID-19 outbreak”) and the risks to the international community as the virus spreads globally. In March 2020, the WHO classified the COVID-19 outbreak as a pandemic, based on the rapid increase in exposure globally beyond its point of origin. In March 2020, the WHO classified the COVID-19 outbreak as a pandemic, based on the rapid increase in exposure globally.

The COVID-19 pandemic adversely impacted global financial markets and contributed to significant volatility in market liquidity and yields required by market investors in the type of financial instruments originated by the Company’s primary operating subsidiaries. In the U.S., significant fiscal stimulus measures, monetary policy actions and other relief measures have helped to moderate the negative economic impacts of COVID-19, and have supported the economic recovery which began in 2020 and continues into 2021. On March 27, 2020, the Coronavirus Aid, Relief, and Economic Security Act (the “CARES Act”) was enacted into law. In March 2021, the U.S. federal government passed a $1.9 trillion American Rescue Plan Act (“ARPA”), which together with the CARES Act and other fiscal stimulus measures put in place in 2020, provide for, among other things, funding to state and local governments, direct payments to households, support for small businesses, renter assistance and funding for transport, airlines, healthcare and education. Monetary policy decisions have included quantitative easing and the provision of liquidity to financial institutions and credit markets. In addition, housing measures, such as forbearance on mortgages and suspension of foreclosures and evictions, and various executive orders have helped to provide relief.

The full impact of the COVID-19 pandemic continues to evolve as of the date of this report. The Company’s management is actively monitoring the global situation and its effect on the Company’s financial condition,


83


Table of Contents

liquidity, operations, industry, and workforce. Further, the Company cannot estimate the length or gravity of the impact that the COVID-19 pandemic on the residential mortgage and commercial lending industries. As of March 31, 2021, the COVID-19 pandemic continues to impact the economic environment in which the Company conducts business, but did not had a material impact to the Company’s consolidated financial statements for three months ended March 31, 2021. See “—Results of Operations” in this MD&A.

The economic impacts of the COVID-19 pandemic may continue to into 2021, including for example the implementation of the ARPA and the cessation of forbearance options and eviction moratoria. These continuing economic impacts, and the continuation of the pandemic itself, may have an adverse effect on the Company’s results of future operations, financial position, intangible assets and liquidity in fiscal year 2021.

For further discussion on the potential impacts of the COVID-19 pandemic reference “Risk Factors—Risks Related to the Business of the Company—Risks Related to COVID-19”.

Reorganization Transactions

New Pubco was incorporated in October 2020 and is a holding corporation, the principal asset of which will be a controlling interest in FoA. The business, property and affairs of FoA will be managed by a board of managers, appointed by New Pubco in its sole discretion. In periods subsequent to the April 1, 2021 closing of the Business Combination, New Pubco will consolidate FoA in its Consolidated Financial Statements and will report a non-controlling interest related to the FoA Units held by the Continuing Unitholders in New Pubco’s Consolidated Financial Statements.

In connection with the consummation of the Business Combination, we will execute several reorganization transactions, as a result of which the limited liability company agreement of FoA will be amended and restated to, among other things, reclassify its outstanding limited liability company units into a single new class of units that are referred to as “FoA Units.” New Pubco appointed in its sole discretion the members of the FoA board of managers. For a description of the reorganization transactions, see “Certain Agreements Related to the Business Combination,” in the Proxy Statement/Prospectus.

New Pubco, FoA and the Continuing Unitholders will enter into an exchange agreement under which they (or certain permitted transferees) have the right (subject to the terms of the exchange agreement) to exchange their FoA Units for shares of New Pubco Class A Common Stock on a one-for-one basis, subject to customary conversion rate adjustments for stock splits, stock dividends and reclassifications.

The Continuing Unitholders will hold all of the issued and outstanding shares of FoA’s Class B Common Stock. The shares of Class B Common Stock will have no economic rights, but will entitle each holder, without regard to the number of shares of Class B Common Stock held by such holder, to a number of votes that is equal to the aggregate number of FoA Units held by such holder on all matters on which stockholders of New Pubco are entitled to vote generally. Holders of shares of FoA’s Class B Common Stock will vote together with holders of FoA’s Class A Common Stock as a single class on all matters on which stockholders are entitled to vote generally, except as otherwise required by law.

Factors Affecting the Comparability of our Results of Operations

As a result of a number of factors, our historical results of operations are not comparable from period to period and may not be comparable to our financial results of operations in future periods. Set forth below is a brief discussion of the key factors that may impact the comparability of our results of operations in future operations.

Impact of the Business Combination

New Pubco is a corporation for U.S. federal and state income tax purposes. FoA, was and is treated as a flow-through entity for U.S. federal income tax purposes, and as such, has generally not been subject to U.S. federal


84


Table of Contents

income tax at the entity level. Accordingly, other than for certain consolidated subsidiaries of FoA that are structured as corporations and unless otherwise specified, the historical results of operations and other financial information presented does not include any provision for U.S. federal income tax.

Following the consummation of the Business Combination, New Pubco (together with certain corporate subsidiaries through which it owns its interest in FoA) will pay U.S. federal and state income taxes as a corporation on its share of our taxable income. The Business Combination will be accounted for as a business combination using the acquisition method of accounting. Accordingly, the assets and liabilities, including any identified intangible assets, of FoA will be recorded at their fair values at the date of the consummation of the Business Combination, with any excess of the purchase price over the estimated fair value recorded as goodwill. The application of business combination accounting will require the use of significant estimates and assumptions.

As a result of the application of business combination accounting, the historical Consolidated Financial Statements of FoA are not necessarily indicative of FoA’s future results of operations, financial position and cash flows. For example, increased tangible and intangible assets resulting from adjusting the basis of tangible and intangible assets to their fair value would result in increased depreciation and amortization expense in the periods following the consummation of the Business Combination, and in the future New Pubco may need to recognize impairment charges related to goodwill, identified intangible assets and fixed assets that are adjusted to fair value.

Additionally, in connection with the Business Combination, New Pubco will enter into Tax Receivable Agreements with the TRA Parties that provide for the payment by New Pubco to such owners of 85% of the benefits that New Pubco is deemed to realize as a result of (i) tax basis adjustments that will increase the tax basis of the tangible and intangible assets of New Pubco as a result of sales or exchanges of FoA Units in connection with or after the Business Combination or distributions with respect to the FoA Units prior to or in connection with the Business Combination, (ii) New Pubco’s utilization of certain tax attributes attributable to the Blocker or the Blocker Shareholders, and (iii) certain other tax benefits related to entering into the Tax Receivable Agreements, including tax benefits attributable to payments under the Tax Receivable Agreements.

Impact of Becoming a Public Company

Following the completion of the Business Combination, we expect to incur additional costs associated with operating as a public company. We expect that these costs will include additional personnel, legal, consulting, regulatory, insurance, accounting, investor relations and other expenses that we did not incur as a private company. The Sarbanes-Oxley Act, as well as rules adopted by the SEC and national securities exchanges, requires public companies to implement specified corporate governance practices that are not applicable to us as a private company. These additional rules and regulations will increase our legal, regulatory and financial compliance costs and will make some activities more time-consuming and costly.

Components of Our Results of Operations

Revenue

Our primary sources of revenue include gains on sale and other income from mortgage loans held for sale, net, net fair value gains on mortgage loans and related obligations, fee income and net interest income (expense).

Gain on sale and other income from mortgage loans held for sale, net

Net gain on sale and other income from mortgage loans held for sale include realized and unrealized gains and losses on loans held for sale, interest rate lock commitments, hedging derivatives, and retained mortgage servicing rights. The Company sells mortgage loans into the secondary market, including sales to the GSEs on a servicing-released basis, where the loans are sold to an investor with the associated MSRs transferred to the investor or to a separate third-party investor. In addition, the Company may opportunistically sell loans on a


85


Table of Contents

servicing-retained basis, where the loan is sold and retain the rights to service that loan are retained. Unrealized gains and losses include fair value gains and losses resulting from changes in fair value in the underlying mortgages, interest rate lock commitments, hedging derivatives, and retained MSRs, from the time of origination to the ultimate sale of the loan or other settlement of those financial instruments.

Net fair value gains on mortgage loans and related obligations

The majority of our outstanding financial instruments are carried at fair value. The yield recognized on these financial instruments and any changes in estimated fair value are recorded as a component of net fair value gains on mortgage loans and related obligations. See Note 5 - Fair Value within our interim unaudited consolidated financial statements for a discussion of fair value measurements.

Fee Income

We earn various fees from our customers during the process of origination and servicing of loans as well as providing services to third party customers. These fees include loan servicing and origination fees, title and closing service fees, title underwriting servicing fees, settlement fees, appraisal fees and broker fees. Revenue is recognized when the performance obligations have been satisfied, which is typically at the time of loan origination.

Net interest income (expense)

We earn interest income on mortgage, reverse and commercial loans held for sale. Interest expense incurred on warehouse lines of credit and non-funding debt is included in net interest income (expense). Interest income and interest expense also accrues to loans held for investment, including securitized loans subject to HMBS and other nonrecourse debt. Interest income and expense on loans held for investment and their related obligations are recorded to net fair value gains on mortgage loans and related obligations.

Operating Expenses

Our operating expenses include salaries, benefits and related expenses, occupancy, equipment rentals and other office related expenses, and general and administrative expenses.

Salaries, benefits and related expenses

Salaries, benefits and related expenses includes commissions, bonuses, salaries, benefits, taxes and all payroll related expenses for our employees.

Occupancy, equipment rentals and other office related expenses

Occupancy, equipment rentals and other office related expenses includes rent expense on office space, equipment and other related occupancy costs.

General and administrative expenses

General and administrative expenses primarily include loan origination fees, loan portfolio expenses, professional service fees, business development costs, communications and data processing costs, legal costs such as title and closing, depreciation and amortization and other expenses.

Income Taxes

FoA is currently treated as a flow-through entity for U.S. federal income tax purposes. As a result, entity level taxes at FoA are not significant. Provision for income taxes consists of tax expense primarily related to certain of the consolidated subsidiaries of FoA that are structured as corporations and subject to U.S. federal income taxes as well as state taxes.


86


Table of Contents

After consummation of the Business Combination, New Pubco (together with certain corporate subsidiaries through which it owns its interest in FoA) will be treated as a U.S. corporation for U.S. federal and state income tax purposes and, in periods following the Business Combination, will be subject to U.S. federal income taxes with respect to its allocable share of any taxable income of FoA and will be taxed at the prevailing corporate tax rates. Accordingly, a provision for income taxes will be recorded for the anticipated tax consequences of our reported results of operations for federal income taxes. In addition to tax expenses, we will also incur expenses related to our operations, as well as payments under the Tax Receivable Agreements, which we expect to be significant. We intend to cause FoA to make distributions in an amount sufficient to allow New Pubco to pay its tax obligations and operating expenses, including distributions to fund any payments due under the Tax Receivable Agreements. See “Certain Agreements Related to the Business Combination—Tax Receivable Agreements.” However, our ability to make such distributions may be limited due to, among other things, restrictive covenants in our financing lines of credit and senior notes. New Pubco is a holding company and its only material asset in periods following the Business Combination will be its direct and indirect interest in FoA. New Pubco accordingly will be dependent upon distributions from FoA to pay taxes, make payments under the Tax Receivable Agreements and pay dividends.

Results of Operations

Consolidated Results

The following table summarizes our consolidated operating results for the periods indicated (in thousands):


     For the three months ended
March 31,
    For the year ended
December 31,
 
     2021     2020     2020     2019     2018  

Gain on sale and other income from mortgage loans held for sale, net

   $ 291,334     $ 130,684     $ 1,178,995     $ 464,308     $ 400,302  

Net fair value gains on mortgage loans and related obligations

     76,663       13,380       311,698       329,526       310,864  

Fee income

     152,509       69,956       386,752       201,628       151,602  

Net interest expense

     (21,705     (25,761     (80,417     (101,408     (73,506


Total revenue

     498,801       188,259       1,797,028       894,054       789,262  

Total expenses

     373,344       230,347       1,296,771       816,475       741,731  


NET INCOME (LOSS) BEFORE TAXES

   $ 125,457     $ (42,088   $ 500,257     $ 77,579     $ 47,531  


Net fair value gains on mortgage loans and related obligations

In the table below is a summary of the components of net fair value gains on mortgage loans and related obligations for the periods indicated (in thousands):


     For the three months ended
March 31,
    For the year ended
December 31,
 
     2021     2020     2020     2019     2018  

Interest income on loans

   $ 160,568     $ 183,672     $ 709,679     $ 749,240     $ 568,378  

Change in fair value of loans

     (51,346     (98,566     294,238       272,709       219,076  

Change in fair value of mortgage backed securities

     —         2,287       2,438       (153     —    


Net fair value gains on mortgage loans

     109,222       87,393       1,006,355       1,021,796       787,454  


Interest expense on related obligations

     (119,201     (134,357     (526,690     (527,646     (441,421

Change in fair value of derivatives

     43,972       (14,310     (12,482     (15,068     (3,120

Change in fair value of related obligations

     42,670       74,654       (155,484     (149,556     (32,049


Net fair value losses on related obligations

     (32,559     (74,013     (694,656     (692,270     (476,590


Total net fair value gains on mortgage loans and related obligations

   $ 76,663     $ 13,380     $ 311,699     $ 329,526     $ 310,864  


87


Table of Contents

Principally all of our outstanding financial instruments are carried at fair value. The yield recognized on these financial instruments and any changes in estimated fair value are recorded as a component of net fair value gains on mortgage loans and related obligations in the Consolidated Statements of Operations and Comprehensive Income. However, for certain of our outstanding financing lines of credit, we have not elected to account for these liabilities under the fair value option. Accordingly, interest expense is presented separately on our Consolidated Statements of Operations and Comprehensive Income. Accordingly, interest income on collateralized loans may be reflected in net fair value gains on mortgage loans and related obligations on the Consolidated Statements of Operations and Comprehensive Income, while the associated interest expense on the pledged loans will be included as a component of net interest expense. We evaluate net interest margin (“NIM”) for our outstanding investments through an evaluation of all components of interest income and interest expense.

Certain of our financial instruments, are valued utilizing a process that combines the use of a discounted cash flow model and analysis of current market data to arrive at an estimate of fair value. The cash flow assumptions and prepayment and repayment assumptions used in the model are based on various factors, with the key assumptions being prepayment and repayment speeds, credit loss frequencies and severity, and discount rate assumptions. Any changes in fair value on these financials instruments is recorded as a gain or loss in net fair value gains on mortgage loans and related obligations on the Consolidated Statement of Operations and Comprehensive Income.

The following table provides an analysis of all components of NIM for the periods indicated (in thousands):


     For the three months ended
March 31,
    For the year ended
December 31,
 
     2021     2020     2020     2019     2018  

Interest income on commercial and reverse loans

   $ 160,568     $ 183,672     $ 709,679     $ 749,240     $ 568,378  

Interest expense on HBMS and nonrecourse obligations

     (119,201     (134,357     (526,690     (527,646     (441,421


Net interest margin included in net fair value gains on mortgage loans (1)

     41,367       49,315       182,989       221,594       126,957  


Interest income on mortgage loans held for sale

     12,621       8,093       42,398       37,050       34,145  

Interest expense on warehouse lines of credit

     (26,546     (32,449     (113,669     (133,381     (106,074

Non-funding debt interest expense

     (7,756     (1,417     (8,946     (5,167     (1,717

Other interest income

     40       78       186       273       1,189  

Other interest expense

     (64     (66     (386     (183     (1,049


Net interest expense

     (21,705     (25,761     (80,417     (101,408     (73,506


NET INTEREST MARGIN

   $ 19,662     $ 23,554     $ 102,572     $ 120,186     $ 53,451  


(1) 

Net interest margin included in fair value gains on mortgage loans includes interest income and expense on all commercial and reverse loans and their related nonrecourse obligations. Interest income on mortgage loans and warehouse lines of credit are classified in net interest expense. See Note 2 - Summary of Significant Accounting Policies within the interim unaudited consolidated financial statements for additional information on the Company’s accounting related to commercial and reverse mortgage loans.

For the three months ended March 31, 2021 versus the three months ended March 31, 2020

Net income before taxes increased $167.5 million or 398.1% primarily as a result of higher gains on loans held for sale, fee income on originated mortgage loans, and fee income from our Lender Services segment, offset partially by higher expenses.


88


Table of Contents
   

Gain on sale and other income from mortgage loans held for sale, net, increased $160.7 million or 122.9% as a result of higher loan originations during the three months ended March 31, 2021 and higher margin on originated mortgage loans. Our Mortgage Originations segment had $8,405.3 million in net rate lock volume related to mortgage loans for the three months ended March 31, 2021 compared to $6,216.3 million for the comparable 2020 period.


Net fair value gains on mortgage loans and related obligations increased by $63.3 million primarily as a result of $70.5 million in fair value losses from assumption changes taken in the first quarter of 2020 driven largely by unfavorable shocks to fair value during the early months of the COVID-19 outbreak. This compares to $2.1 million of fair value losses from assumption changes taken in the first quarter of 2021. See Note 5 - Fair Value within the interim unaudited consolidated financial statements for additional information on assumptions impacting the value of our loans held for investment.


Fee income increased $82.6 million or 118.0% as a result of our higher loan origination volumes and growth in fee income from our Lender Services segment.


Net interest expense decreased $4.1 million or 15.7% in 2021 due primarily to a lower average cost of funds on our financing lines of credit and increases in interest income on mortgage loans held for sale, partially offset by an increase in non-funding debt interest expense for the three months ended March 31, 2021 compared to the same period 2020.


Total expenses increased $143.0 million or 62.1% due to higher salaries, benefits and related expenses combined with increases in general and administrative expenses primarily as a result of our higher loan origination volumes during the 2021 period and overall enterprise growth.

For the year ended December 31, 2020 versus the year ended December 31, 2019

Net income before taxes increased $422.7 million or 544.8% as a result of higher gain on sale and other income from mortgage loans held for sale, net, and fee income on originated mortgage loans and from our Lender Services segment, offset partially by lower net fair value gains on loans and related obligations and higher expenses.


Gain on sale and other income from mortgage loans held for sale, net, increased $714.7 million or 153.9% primarily as a result of higher loan originations in our Mortgage Originations segment and a general widening in margins related to GSE and government guaranteed loan products. We originated $29,064.4 million in residential mortgage loans in 2020, compared to $15,437.1 million, an 88.3% increase over 2019. The higher loan origination volume is attributable to the favorable interest rate environment in 2020, which was 99 bps lower than 2019, leading to an increase in refinance production.


Net fair value gains on mortgage loans and related obligations decreased by $17.8 million primarily as a result of a $49.9 million in fair value losses from assumption changes in 2020 driven largely by shocks to fair value yields during the early months of the COVID-19 outbreak, partially offset by $34.1 million increase in new origination gains during 2020. See Note 5 - Fair Value within the annual audited consolidated financial statements for additional information on assumptions impacting the value of loans held for investment.


Fee income increased $185.1 million or 91.8% as a result of our higher loan origination volumes.


Net interest expense decreased $21.0 million or 20.7% in 2020 as a result of the favorable interest rate environment in 2020 compared to 2019. This reduced the interest expense on our warehouse lines of credit. Additionally, the favorable interest rate environment resulted in lower interest rates on the debt associated with the 10 securitizations executed in 2020, which are recorded in net fair value gains on mortgage loans and related obligations.


89


Table of Contents
   

Total expenses increased $480.3 million or 58.8% due to higher salaries, benefits and related expenses combined with an increase in general and administrative expenses as a result of higher loan origination volumes during the period and overall enterprise growth.

For the year ended December 31, 2019 versus the year ended December 31, 2018

Net income before taxes increased $30.0 million or 63.2% as a result of higher net fair value gains and fee income on originated mortgage loans, offset partially by an increase in net interest expense and higher expenses.


Gain on sale and other income from mortgage loans held for sale, net, increased $64.0 million or 16.0% primarily as a result of higher loan originations in our Mortgage Originations segment, and a general widening in margins related to GSE and government guaranteed loan products. We originated $15,437.1 million in residential mortgage loans in 2019, compared to $13,573.5 million, a 13.7% increase over 2018.


Net fair value gains on mortgage loans and related obligations increased by $18.7 million primarily as a result of fair value accretion to loans held for investment, partially offset by $20.0 million of fair value losses driven primarily by increased loss rate assumptions on HECM buyout loans. See Note 5 - Fair Value within the annual audited consolidated financial statements for additional information on assumptions impacting the value of loans held for investment.


Fee income increased $50.0 million or 33.0% as a result of higher loan origination volumes.


Net interest expense increased $27.9 million or 38.0% as a result of higher loan origination volumes.


Total expenses increased $74.7 million or 10.1% due to higher salaries, benefits and related expenses combined with an increase in general and administrative expenses as a result of higher loan origination volumes during the period.

SEGMENT RESULTS

Revenue generated on inter-segment services performed are valued based on estimated market value. Revenue and fees are directly allocated to their respective segments at the time services are performed. Expenses directly attributable to the operating segments are expensed as incurred. Other expenses are allocated to individual segments based on the estimated value of services performed, total revenue contributions, personnel headcount or the equity invested in each segment based on the type of expense allocated. Expenses for enterprise-level general overhead, such as executive administration, are not allocated to the business segments.

Portfolio Management Segment

The following table summarizes our Portfolio Management segment results for the periods indicated (in thousands):


     For the three months ended
March 31,
    For the year ended
December 31,
 
     2021     2020     2020     2019     2018  

Gain on sale and other income from mortgage loans held for sale, net

   $ 5,065     $ 5,617     $ 10,192     $ 9,303     $ 7,725  

Net fair value gains (losses)

     2,750       (31,356     103,872       151,679       135,182  

Net interest expense

     (14,816     (24,773     (73,163     (95,694     (74,037

Fee income

     37,086       961       28,002       7,923       14,151  


Total revenue

     30,085       (49,551     68,903       73,211       83,021  


Total expenses

     24,406     $ 17,372     $ 90,854     $ 63,907     $ 52,089  


NET INCOME (LOSS) BEFORE TAXES

   $ 5,679     $ (66,923   $ (21,951   $ 9,304     $ 30,932  


90


Table of Contents

Our Portfolio Management segment generates its revenues primarily from the sale and securitization of residential mortgages into the secondary market, fair value gains and losses on loans and MSRs that we hold to maturity, and mortgage advisory fees earned on various investment and trading activities we provide our internal and external customers. The fair value gains and losses include the yield we recognize on the contractual interest income that is expected to be collected based on the stated interest rates of the loans and related liabilities, and any contractual service fees earned while servicing these assets.

Fair value gains and losses in our Portfolio Management segment includes fair value adjustments related to the following assets and liabilities:


Loans held for investment, subject to HMBS liabilities, at fair value


Loans held for investment, subject to nonrecourse debt, at fair value


Loans held for investment, at fair value


Mortgage servicing rights, at fair value


Loans held for sale, at fair value(1)


HMBS liabilities, at fair value; and


Nonrecourse debt, at fair value.


(1) 

Fair value gains and losses in our Portfolio Management segment for loans held for sale only include fair value adjustments related to loans originated in the Commercial Originations segment.

For the three months ended March 31, 2021 versus the three months ended March 31, 2020

Net income before taxes improved primarily as a result of a $68.4 million of changes in model-assumptions in the first quarter of 2021 compared to the 2020 period. In the first quarter of 2020, capital markets were affected by the COVID-19 outbreak, with investors requiring significantly increased cost of funds. Due to the higher cost of funds, a write down to the securitized assets in inventory was required, coupled with hedge losses realized during the same quarter of 2020. Capital markets demand and spreads have since returned to more normal levels, and we have adjusted the product guidelines and pricing to reflect the market requirements to produce desired yields. See Note 5 - Fair Value within the interim unaudited consolidated financial statements for additional information.

For the year ended December 31, 2020 versus the year ended December 31, 2019

Net loss before taxes increased $31.3 million as a result of $49.9 million of fair value adjustments required during 2020. This was $29.9 million higher market and model assumption-driven losses than 2019. Capital markets were affected by the COVID-19 outbreak, with investors requiring significantly increased cost of funds. Our Portfolio Management segment successfully executed on 10 securitizations during 2020, but due to the higher cost of funds, a write down to the securitized assets in inventory was required, coupled with hedge losses realized during the year. Capital markets demand and spreads have since returned to more normal levels, and we have adjusted the product guidelines and pricing to reflect the market requirements to produce desired yields. See Note 5 - Fair Value within the annual audited consolidated financial statements for additional information.

For the year ended December 31, 2019 versus the year ended December 31, 2018

Net income before taxes decreased $21.6 million as a result of $20.0 million of fair value losses driven by temporarily higher losses in the HECM portfolio. These losses were primarily the result of Ginnie Mae slowing its acceptance of assignments of performing buyout loans and losses incurred in the resolution of assignable and non-assignable loans in Puerto Rico following hurricanes in the region and moratoriums limiting the Company’s ability to process claims with Ginnie Mae. Both events increased the unrecoverable costs of resolving HECM buyout loans.


91


Table of Contents

KEY METRICS

The following table provides a trend in the assets and liabilities under management by our Portfolio Management segment (in thousands):


     March 31,
2021
     December 31,
2020
     December 31,
2019
     December 31,
2018
 

Restricted cash

     302,937      $ 303,925      $ 262,835      $ 146,209  

Loans held for investment, subject to HMBS liabilities, at fair value

     10,071,192        9,929,163        9,480,504        9,615,846  

Loans held for investment, subject to nonrecourse debt, at fair value

     5,291,444        5,396,167        3,433,800        1,282,080  

Loans held for investment, at fair value

     1,100,544        730,821        971,365        944,361  

Debt securities, at fair value

     —          —          101,960        —    

Mortgage servicing rights, at fair value

     267,364        180,684        2,600        3,376  

Other assets, net

     178,263        165,810        195,374        110,582  


Total long-term investment assets

     17,211,744        16,706,570        14,448,438        12,102,454  


Loans held for sale, at fair value

     118,397        142,226        607,388        709,164  


Total earning assets

   $ 17,330,141      $ 16,848,796      $ 15,055,826      $ 12,811,618  


HMBS liabilities, at fair value

   $ 9,926,132      $ 9,788,668      $ 9,320,209      $ 9,438,791  

Nonrecourse debt, at fair value

     5,227,943        5,271,842        3,490,196        1,592,592  

Other secured financing

     1,343,739        1,010,669        1,663,134        1,202,601  

Other liabilities

     101,515        96,762        132,964        173,746  


Total financing of portfolio

     16,599,329        16,167,941        14,606,503        12,407,730  


Net equity in earning assets

   $ 730,812      $ 680,855      $ 449,323      $ 403,888  


The following table provides a summary of some of our Portfolio Management segment’s key metrics (dollars in thousands):


     For the three months ended
March 31,
    For the year ended
December 31,
 
     2021     2020     2020     2019     2018  

Mortgage Servicing Rights Portfolio


Loan count

     83,032       1,813       69,301       1,489       1,481  

Ending unpaid principal balance (“UPB”)

   $ 26,675,358     $ 402,852     $ 22,269,362     $ 288,057     $ 283,230  

Average unpaid principal balance

   $ 321     $ 222     $ 321     $ 193     $ 191  

Weighted average coupon

     3.05     4.18     3.2     4.4     4.3

Weighted average age (in months)

     5       30       4       41       36  

Weighted average FICO credit score

     759       729       760       717       718  

90+ day delinquency rate

     0.11     0.22     0.2     3.3     1.7

Total prepayment speed

     8.6     16.0     12.1     31.6     6.4

Reverse Mortgages


Loan count

     58,786       58,731       58,230       58,942       60,879  

Active UPB

   $ 13,622,100     $ 12,488,508     $ 13,355,570     $ 12,195,801     $ 10,954,365  

Due and payable

   $ 577,422     $ 263,295     $ 484,233     $ 225,217     $ 213,953  

Foreclosure

   $ 341,011     $ 374,501     $ 348,768     $ 404,675     $ 383,302  


92


Table of Contents
     For the three months ended
March 31,
    For the year ended
December 31,
 
     2021     2020     2020     2019     2018  

Claims pending

   $ 69,858     $ 123,897     $ 76,346     $ 123,409     $ 92,380  


Ending unpaid principal balance

   $ 14,610,391     $ 13,250,201     $ 14,264,917     $ 12,949,102     $ 11,644,000  

Average unpaid principal balance

   $ 249     $ 226     $ 245     $ 220     $ 191  

Weighted average coupon

     4.1     5.1     4.3     5.2     5.2

Weighted average age (in months)

     44.5       43.7       44.2       44.4       45.6  

Percentage in foreclosure

     2.3     2.8     2.4     3.1     3.3

Commercial (SRL/Portfolio/Fix & Flip)


Loan count

     1,675       3,970       1,993       3,978       2,606  

Ending unpaid principal balance

   $ 391,538     $ 886,419     $ 493,817     $ 927,444     $ 645,632  

Average unpaid principal balance

   $ 234     $ 223     $ 248     $ 233     $ 248  

Weighted average coupon

     7.90     8.30     8.5     8.3     8.4

Weighted average loan age (in months)

     11       6       12       6       5  

SRL conditional prepayment rate

     3.2     —       2.9     3.71     2.10

SRL non-performing (60+ DPD)

     2.7     2.0     2.2     0.7     0.3

F&F single month mortality

     13.3     7.4     8.8     7.4     7.1

F&F non-performing (60+ DPD)

     15.9     3.5     6.5     2.2     0.5

Agricultural Loans


Loan count

     58       32       42       8       —    

Ending unpaid principal balance

   $ 123,356     $ 62,837     $ 69,127     $ 11,369     $ —    

Average unpaid principal balance

   $ 2,127     $ 1,964     $ 1,646     $ 1,421     $ —    

Weighted average coupon

     7.2     8.0     7.7     8.3     —  

Weighted average loan age (in months)

     3       1       5       2       —    

Conditional prepayment rate

     1.0     1.0     1.0     1.0     —  

Conditional default rate

     2.0     2.0     2.0     2.0     —  

Investment and Trading


Number of structured deals

     1       2       10       7       3  

Structured deals (size in notes)

   $ 571,448     $ 572,912     $ 3,270,257     $ 2,455,050     $ 940,936  

Number of whole loan trades

     8       2       11       12       184  

UPB of whole loan trades

   $ 195,929     $ 124,165     $ 366,242     $ 451,377     $ 2,204,663  


93


Table of Contents

Revenue

In the table below is a summary of the components of our Portfolio Management segment’s total revenue for the periods indicated (in thousands):


     For the three months ended
March 31,
    For the year ended
December 31,
 
     2021     2020     2020     2019     2018  

REVENUE


Gain on sale and other income from mortgage loans held for sale, net

   $ 5,065     $ 5,617     $ 10,192     $ 9,303     $ 7,725  

Interest income

     149,875       162,838       699,036       700,498       567,380  

Interest expense (nonrecourse)

     (114,910     (127,850     (520,884     (528,062     (418,372

Net fair value losses on portfolio assets

     (32,215     (66,344     (74,280     (20,757     (13,826


Net fair value gains

     2,750       (31,356     103,872       151,679       135,182  


Net interest expense

     (14,816     (24,773     (73,163     (95,694     (74,037


Servicing income (MSR)

     33,698       104       25,175       (573     4,361  

Underwriting, advisory and valuation fees

     997       90       818       1,193       6,121  

Asset management fees

     9       511       1,154       3,094       1,382  

Other fees

     2,382       256       854       4,209       2,287  


Fee income

     37,086       961       28,002       7,923       14,151  


Total revenue

   $ 30,085     $ (49,551   $ 68,903     $ 73,211     $ 83,021  


Principally all of our outstanding financial instruments are carried at fair value. The yield recognized on these financial instruments and any changes in estimated fair value are recorded as a component of net fair value gains on mortgage loans and related obligations in the Consolidated Statements of Operations and Comprehensive Income. However, for certain of our outstanding financing lines of credit, we have not elected to account for these liabilities under the fair value option. Accordingly, interest expense is presented separately on our Consolidated Statements of Operations and Comprehensive Income. We evaluate net interest margin (“NIM”) for our outstanding investments through an evaluation of all components of interest income and interest expense.

Certain of our financial instruments, are valued utilizing a process that combines the use of a discounted cash flow model and analysis of current market data to arrive at an estimate of fair value. The cash flow assumptions and prepayment and repayment assumptions used in the model are based on various factors, with the key assumptions being prepayment speeds, credit loss frequencies and severity, and discount rate assumptions. Any changes in fair value on these financials instruments is recorded as a gain or loss in net fair value gains on mortgage loans and related obligations on the Consolidated Statement of Operations and Comprehensive Income.


94


Table of Contents

The following table provides an analysis of all components of NIM for the periods indicated (in thousands):


     For the three months ended
March 31,
    For the year ended
December 31,
 
     2021     2020     2020     2019     2018  

Interest income on commercial and reverse loans

   $ 149,875     $ 162,838     $ 699,036     $ 700,498     $ 567,380  

Interest expense on HBMS and nonrecourse obligations

     (114,910     (127,850     (520,884 )      (528,062 )      (418,372


Net interest margin included in net fair value gains on mortgage loans (1)

     34,965       34,988       178,152       172,436     149,008  


Interest income on mortgage loans held for sale

     138       174       714       367       1,320  

Interest expense on warehouse lines of credit

     (14,954     (24,951     (73,877 )      (96,061 )      (75,357

Other interest income

     —         4       —         —         —    


Net interest expense

     (14,816     (24,773     (73,163 )      (95,694 )      (74,037


NET INTEREST MARGIN

   $ 20,149     $ 10,215     $ 104,989     $ 76,742     $ 74,971  


(1) 

Net interest margin included in fair value gains on mortgage loans includes interest income and expense on all commercial and reverse loans and their related nonrecourse obligations. Interest income on mortgage loans and warehouse lines of credit are classified in net interest expense. See Note 2 - Summary of Significant Accounting Policies within the interim unaudited consolidated financial statements for additional information on the Company’s accounting related to commercial and reverse mortgage loans.

For the three months ended March 31, 2021 versus the three months ended March 31, 2020

Total revenue increased $79.6 million or 161% as a result of negative fair value adjustments recognized during the three months ended March 31, 2020 primarily driven by higher required cost of funds for securitizations during the COVID-19 outbreak. These losses were partially offset by $10.0 million decrease in warehouse interest expense.


Interest income decreased $13.0 million due to the weighted average coupon decreasing on our portfolio of loans for the three months ended March 31, 2021 compared to the same period in 2020.


Interest expense on nonrecourse debt decreased $12.9 million due to issuances of nonrecourse debt in a favorable interest rate environment during the three months ended March 31, 2021 and retirement of nonrecourse debt issued in prior periods.


Net interest expense on our warehouse lines decreased $10.0 million due primarily to a lower average cost of funds on our financing lines of credit.


Net fair value losses on portfolio assets decreased $34.1 million primarily as a result of higher fair value losses incurred in the first quarter of 2020 primarily driven by higher required cost of funds for securitizations during the COVID-19 pandemic. Financial markets were significantly disrupted resulting in significant negative fair value adjustments during 2020.

For the year ended December 31, 2020 versus the year ended December 31, 2019

Total revenue decreased $4.3 million or 5.9% as a result of negative fair value adjustments recognized in 2020 primarily driven by higher required cost of funds for securitizations during the COVID-19 outbreak. These losses were partially offset by $21.7 million decrease in warehouse interest expense.


Interest income decreased $3.7 million due to a decreasing rate environment in 2020 compared to 2019. The 10-year treasury rate, a leading indicator of mortgage interest rates, was 0.93% as of December 31, 2020 and 1.92% as of December 31, 2019, a decrease of 99 bps.


95


Table of Contents
   

Interest expense on nonrecourse debt decreased $7.3 million due to issuances of nonrecourse debt in a favorable interest rate environment during December 31, 2020 and retirement of nonrecourse debt issued in prior periods.


Interest expense on warehouse lines decreased $21.7 million as the result of a decreasing interest rate environment year over year.


Net fair value changes on portfolio assets decreased $44.3 million as a result of a $29.9 million increase to fair value losses recognized in 2020 primarily driven by higher required cost of funds for securitizations during the COVID-19 outbreak. Financial markets were significantly disrupted resulting in significant negative fair value adjustments during 2020. See Note 5 - Fair Value to the annual audited consolidated financial statements for additional information.


Servicing income increased $17.3 million. As a result of the COVID-19 outbreak and the effect on the market for MSRs, we increased retention of MSRs in March 2020. Our mortgage servicing portfolio increased to $22,269.4 million UPB as of December 31, 2020, compared to $288.1 million as of December 31, 2019.

For the year ended December 31, 2019 versus the year ended December 31, 2018

Total revenue decreased $9.8 million or 11.8% as a result of fair value adjustments primarily driven by temporarily higher losses in the HECM portfolio. These losses were primarily the result of Ginnie Mae slowing its acceptance of assignments of performing buyout loans and losses incurred in the resolution of assignable and non-assignable loans in Puerto Rico following hurricanes in the region and moratoriums limiting the Company’s ability to process claims with Ginnie Mae. Both events increased the unrecoverable costs of resolving HECM buyout loans.


Interest income increased $135.3 million due to an increase in the aggregate UPB of loans managed by our Portfolio Management segment. As of December 31, 2019, we serviced an aggregate UPB of $13,886.0 million compared to $11,842.0 million as of December 31, 2018.


Interest expense on nonrecourse debt increased $109.8 million due to an increase in total outstanding nonrecourse debt secured by loans in the Portfolio Management segment. As of December 31, 2019, we had an aggregate UPB of $3,494.7 million in outstanding nonrecourse debt compared to $1,586.6 million as of December 31, 2018.


Interest expense on warehouse lines increased $22.7 million as a result of increased origination volumes combined with longer dwell times on warehouse lines of credit.


Net fair value changes on portfolio assets decreased $8.0 million. This change was primarily the result of $20.0 million of fair value market to market losses recognized during 2019 to reflect higher loss rates observed in our HECM portfolio. Ginnie Mae slowing its acceptance of assignments of performing buyout loans and losses incurred in the resolution of assignable and non-assignable loans in Puerto Rico following hurricanes in the region and moratoriums limiting the Company’s ability to process claims with Ginnie Mae. Both events increased the unrecoverable costs of resolving HECM buyout loans. See Note 5 - Fair Value within the annual audited consolidated financial statements for additional information.


96


Table of Contents

Expenses

In the table below is a summary of the components of our Portfolio Management segment’s total expenses for the periods indicated (in thousands):


     For the three months ended
March 31,
     For the year ended
December 31,
 
     2021      2020      2020      2019      2018  

Salaries and bonuses

   $ 5,650      $ 4,731      $ 25,470      $ 18,760      $ 11,005  

Other salary related expenses

     497        369        2,358        1,427        1,587  


Total salaries, benefits and related expenses

     6,147        5,100        27,828        20,187        12,592  

Securitization expenses

     4,459        3,333        17,173        12,851        12,769  

Servicing related expenses

     8,651        5,392        28,360        21,198        18,817  

Other general and administrative expenses

     4,887        3,393        17,226        8,979        7,300  


Total general and administrative expenses

     17,997        12,118        62,759        43,028        38,886  

Occupancy and equipment rentals

     262        154        267        692        611  


Total expenses

   $ 24,406      $ 17,372      $  90,854      $ 63,907      $  52,089  


For the three months ended March 31, 2021 versus the three months ended March 31, 2020

Total expenses increased $7.0 million or 40% as a result of higher salaries, benefits and related expenses combined with an increase in general and administrative expenses.


Salaries, benefits and related expenses increased $1.0 million or 21%, primarily due to an increase in bonus compensation.


General and administrative expenses increased $5.9 million or 49% primarily due to servicing related expenses related to the increase in the retained MSR portfolio.

For the year ended December 31, 2020 versus the year ended December 31, 2019

Total expenses increased $26.9 million or 42.2% as a result of higher salaries, benefits and related expenses combined with an increase in general and administrative expenses.


Salaries, benefits and related expenses increased $7.6 million or 37.9%, primarily due to an increase in average headcount, which was 106 for the 2020 period versus 82 for the 2019 period. This increase is a result of growth in our servicing oversight function.


General and administrative expenses increased $19.7 million or 45.9% primarily due to servicing related expenses related to the increase in the retained MSR portfolio.

For the year ended December 31, 2019 versus the year ended December 31, 2018

Total expenses increased $11.8 million or 22.7% as a result of higher salaries, benefits and related expenses combined with an increase in general and administrative expenses.


Salaries, benefits and related expenses increased $7.6 million or 60.3%, primarily due to an increase in average headcount, which was 82 for the 2019 period versus 70 for the 2018 period. This increase was a result of growth in our servicing oversight function, to include the hiring of senior leadership with guaranteed bonuses that were accrued for during the 2019 period.


General and administrative expenses increased $4.1 million or 10.7% primarily as a result of increased fees related to the securitization of assets into nonrecourse securitizations and increased loan portfolio expenses related to the increase in subservicing expense.


97


Table of Contents

Mortgage Originations Segment

The following table summarizes our Mortgage Origination segment’s results for the periods indicated (in thousands):


     For the three months ended
March 31,
     For the year ended
December 31,
 
     2021      2020      2020      2019     2018  

Gain on sale and other income from mortgage loans held for sale, net

   $ 286,481      $ 127,291      $  1,171,368      $  462,700     $  397,648  

Fee income

     32,731        20,527        118,237        64,372       48,547  

Net interest income (expense)

     891        486        1,896        (403     2,884  


Total revenue

     320,103        148,304        1,291,501        526,669       449,079  


Total expenses

     224,246        138,191        831,563        506,894       481,381  


NET INCOME (LOSS) BEFORE TAXES

   $ 95,857      $ 10,113      $ 459,938      $ 19,775     $  (32,302


Our Mortgage Originations segment generates its revenues primarily from the origination and sale of residential mortgages, including conforming mortgages, government mortgages insured by the FHA, VA and USDA, non-conforming products such as jumbo mortgages, non-qualified mortgages, and closed-end second mortgages into the secondary market. Revenue from our Mortgage Originations segment includes cash gains recognized on the sale of mortgages, net of any estimated repurchase obligations, realized hedge gains and losses, fair value adjustments on loans held for sale, and any fair value adjustments on our outstanding interest rate lock pipeline and derivatives utilized to mitigate interest rate exposure on our outstanding mortgage pipeline. We also earn origination fees on the successful origination of mortgage loans which are recorded at the time of origination of the associated loans.

We utilize forward loan sale commitments, TBAs, and other forward delivery securities to fix the forward sales price that we will realize in the secondary market and to mitigate the interest rate risk to loan prices that we may be exposed to from the date we enter into rate locks with our customers until the date the loan is sold. We realize hedge gains and losses based on the value of the change in price in the underlying securities. When the position is closed, these amounts are recorded as realized hedge gains and losses.

For the three months ended March 31, 2021 versus the three months ended March 31, 2020

Net income before taxes increased $85.7 million or 847.9% as a result of higher loan originations, and a general widening in margins related to GSE and government-guaranteed loan products.


Our Mortgage Originations segment had $8,405.3 million in net rate lock volume related to mortgage loans for the three months ended March 31, 2021 compared to $6,216.3 million for the comparable 2020 period. Additionally, our margin on originated mortgage loans increased to 3.4% for the three months ended March 31, 2021 compared to 2.1% for the comparable 2020 period.


Fee income increased $12.2 million or 59.5% as a result of higher origination volume during the three months ended March 31, 2021.


Total expenses increased $86.1 million or 62.3% as a result of variable expenses related to higher loan origination volume during the three months ended March 31, 2021.


98


Table of Contents

For the year ended December 31, 2020 versus the year ended December 31, 2019

Net income before taxes increased $440.2 million as a result of higher loan originations, and a general widening in margins related to GSE and government-guaranteed loan products.


Our Mortgage Originations segment originated $29,064.4 million in mortgage loans in 2020 compared to $15,437.1 million in 2019. The higher loan origination volume is attributable to the favorable interest rate environment in 2020, leading to an increase in refinance production.


The 10-year treasury rate, a leading indicator of mortgage interest rates, was 0.93% as of December 31, 2020, a decrease of 99 bps from December 31, 2019.


Fee income increased $53.9 million or 83.7% as a result of higher loan origination volume during the year.


Total expenses increased $324.7 million or 64.1% primarily as a result of variable expenses related to higher loan origination volume during the year.

For the year ended December 31, 2019 versus the year ended December 31, 2018

Net income before taxes increased $52.1 million or 161.2% primarily as a result of higher loan originations.


Our Mortgage Originations segment originated $15,437.1 million in mortgage loans in 2019 compared to $13,573.5 million in 2018. The higher origination volume is attributable to the favorable interest rate environment in 2019, leading to an increase in refinance production.


The 10-year treasury rate, a leading indicator of mortgage interest rates, declined 77 bps during 2019 compared to an increase of 29 bps during 2018.


Fee income increased $15.8 million or 32.6% as a result of higher loan origination volume during the year.


Total expenses increased $25.5 million or 5.3% primarily as a result of variable expenses related to higher loan origination volume during the year.


99


Table of Contents

KEY METRICS

The following table provides a summary of some of our Mortgage Origination segment’s key metrics (dollars in thousands):


     For the three months ended
March 31,
     For the year ended
December 31,
 
     2021      2020      2020      2019      2018  

Loan origination volume (dollars)


Conforming

   $ 5,397,708      $ 2,599,040      $ 19,217,582      $ 8,574,829      $ 7,162,835  

Government

     1,068,650        794,813        4,305,439        3,763,708        3,770,235  

Non-conforming

     1,937,860        826,659        5,541,415        3,098,610        2,640,385  


Total loan origination volume

   $ 8,404,218      $ 4,220,512      $ 29,064,436      $ 15,437,147      $ 13,573,455  

Loan origination volume by channel (dollars)


Retail

   $ 5,622,487      $ 3,210,787      $ 21,497,101      $ 11,750,830      $ 10,037,748  

Wholesale/Correspondent

     1,706,365        541,378        4,316,952        2,306,909        2,708,166  

Consumer direct

     1,075,366        468,347        3,250,383        1,379,408        827,541  


Total loan origination volume by channel

   $ 8,404,218      $ 4,220,512      $ 29,064,436      $ 15,437,147      $ 13,573,455  

Loan origination volume by type (dollars)


Purchase

   $ 2,664,493      $ 1,698,392      $ 9,877,305      $ 8,651,747      $ 10,291,553  

Refinance

     5,739,725        2,522,120        19,187,131        6,785,400        3,281,902  


Total loan origination volume by type

   $ 8,404,218      $ 4,220,512      $ 29,064,436      $ 15,437,147      $ 13,573,455  

Loan origination volume (units)


Conforming

     18,090        9,366        65,072        32,195        29,403  

Government

     3,426        2,869        14,764        13,525        14,467  

Non-conforming

     2,472        1,182        7,816        4,661        4,081  


Total loan origination volume

     23,988        13,417        87,652        50,381        47,951  

Loan origination volume by channel (units)


Retail

     16,123        10,585        66,232        39,969        36,822  

Wholesale/Correspondent

     4,745        1,470        12,383        6,476        8,346  

Consumer direct

     3,120        1,362        9,037        3,936        2,783  


Total loan origination volume by channel

     23,988        13,417        87,652        50,381        47,951  

Loan origination volume by type (units)


Purchase

     7,534        6,071        31,389        30,984        37,152  

Refinance

     16,454        7,346        56,263        19,397        10,799  


Total loan origination volume by type

     23,988        13,417        87,652        50,381        47,951  

Loan sales by investor (dollars)


Agency

   $ 7,246,418      $ 3,260,543      $ 25,749,257      $ 11,513,455      $ 10,590,424  

Private

     1,152,810        758,103        2,241,787        3,339,131        3,265,125  


Total loan sales by investor

   $ 8,399,228      $ 4,018,646      $ 27,991,044      $ 14,852,586      $ 13,855,549  


100


Table of Contents
     For the three months ended
March 31,
    For the year ended
December 31,
 
     2021     2020     2020     2019     2018  

Loan sales by type (dollars)


Servicing released

   $ 2,086,550     $ 3,882,965     $ 6,747,669     $ 14,477,231     $ 13,796,783  

Servicing retained

     6,312,678       135,681       21,243,375       375,355       58,766  


Total loan sales by type

   $ 8,399,228     $ 4,018,646     $ 27,991,044     $ 14,852,586     $ 13,855,549  

Net rate lock volume

   $ 8,405,313     $ 6,216,254     $ 30,157,239     $ 16,523,535     $ 13,378,331  

Mortgage originations margin (including servicing margin) (1)

     3.4     2.1     3.88     2.80     2.97

Capitalized servicing rate (in bps)

     89.1       94.9       78.3       97.7       136.1  


(1) 

Calculated for each period as Gain on sale and other income from mortgage loans held for sale, net, divided by Net rate lock volume.

Revenue

In the table below is a summary of the components of our Mortgage Origination segment’s total revenue for the periods indicated (in thousands):


     For the three months ended
March 31,
    For the year ended
December 31,
 
     2021     2020     2020     2019     2018  

Gain on sale, net

   $ 200,874     $ 137,414     $ 1,251,005     $ 501,592     $ 359,371  

Provision for repurchases

     (2,258     (2,125     (22,402     (4,950     (1,514

Realized hedge gains (losses)

     74,823       (49,562     (164,141     (48,315     24,367  

Changes in fair value of loans held for sale

     (41,485     22,301       50,204       8,187       12,083  

Changes in fair value of interest rate locks

     (49,946     56,345       73,637       3,605       7,151  

Changes in fair value of derivatives/hedges

     104,473       (37,082     (16,935     2,581       (3,810


Gain on sale and other income from mortgage loans held for sale, net

     286,481       127,291       1,171,368       462,700       397,648  


Origination related fee income

     32,731       20,527       118,237       64,372       48,547  

Net interest income (expense)

     891       486       1,896       (403     2,884  


Total revenue

   $ 320,103     $ 148,304     $ 1,291,501     $ 526,669     $ 449,079  


Net interest income was comprised of the following (in thousands):


     For the three months ended
March 31,
    For the year ended
December 31,
 
     2021     2020     2020     2019     2018  

Interest income

   $ 12,483     $ 7,918     $ 41,688     $ 36,673     $ 33,899  

Interest expense

     (11,592     (7,432     (39,792     (37,076     (31,015


Net interest income (expense)

   $ 891     $ 486     $ 1,896     $ (403   $ 2,884  


WAC - loans held for sale

     2.9     3.5     2.9     3.9     5.1

WAC - warehouse lines of credit

     3.0     3.9     3.1     3.7     4.5


101


Table of Contents

For the three months ended March 31, 2021 versus the three months ended March 31, 2020

Total revenue increased $171.8 million or 115.8% as a result of higher mortgage origination volume and overall higher mortgage originations margin.


Gain on sale, net, increased $63.5 million or 46.2% as a result of higher sales volume during the three months ended March 31, 2021 partially offset by decreased gain on sale margin on sold volume. We sold $8,399.2 million in mortgage loans for the three months ended March 31, 2021 compared to $4,018.6 million for the comparable 2020 period. Weighted average gain on sale margin on sold loans were 2.4% for the three months ended March 31, 2021 compared to 3.4% for the comparable 2020 period. Gain on sale margins decreased primarily due to the impact of significant increases in market interest rates between the time of loan origination and loan sale during the period and a reduction in overall market loan origination margins.


Changes in fair value of loans held for sale decreased $63.8 million or 286.0% as a result of lower net change in the end-of-period fair value of our higher outstanding originated loan production not yet sold or securitized combined with lower margins on our unsold loan pipeline. The unsold pipeline decreased from $2.0 billion with a weighted average margin of 4.2% at December 31, 2020 to $1.9 billion and 2.1% at March 31, 2021. Comparatively, the unsold pipeline increased from $1.0 billion with a weighted average margin of 2.9% at January 1, 2020 to $1.2 billion and 4.3% at March 31, 2020.


Changes in fair value of interest rate locks similarly decreased $106.3 million or 188.6% as a result of lower net change in our interest rate lock pipeline. The fair value of the interest rate lock pipeline decreased from $87.6 million at December 31, 2020 to $37.6 million at March 31, 2021. Comparatively, the fair value of the interest rate lock pipeline increased from $13.9 million at January 1, 2020 to $56.3 million at March 31, 2020.


Origination related fee income increased $12.2 million or 59.5% as a result of higher loan origination volume during the three months ended March 31, 2021.


The decreases to gain on sale and fair value gains on loans sold, loans held for sale and interest rate lock pipeline driven by increases to market interest rates while those loans were in the pipeline during the three months ended March 31, 2021 were offset by realized and unrealized hedge gains. Conversely, increases to gain on sale and fair value gains on loans sold, loans held for sale and interest rate lock pipeline driven by increases to market interest rates while those loans were in the pipeline during the comparable 2020 period were offset by realized and unrealized hedge losses.

For the year ended December 31, 2020 versus the year ended December 31, 2019

Total revenue increased $764.8 million or 145.2% as a result of higher gain on sale, net.


Gain on sale, net, increased $749.4 million or 149.4% as a result of higher sales volume during the year combined with increased margins on sold volume. We originated $29,064.4 million in mortgage loans in 2020 compared to $15,437.1 million in 2019. Weighted average margins on originated loans were 4.30% for 2020 compared to 3.25% for 2019.


Changes in fair value of loans held for sale increased $42.0 million or 513.2% as a result of a higher net change in mortgage loans held for sale and higher margins on the unsold loan pipeline. The unsold pipeline increased $938.2 million or 89.4% during the year ended December 31, 2020 compared to the year ended December 31, 2019. As of December 31, 2020, weighted average margins on unsold production was 4.15%, compared to 2.80% as of December 31, 2019.


Changes in fair value of interest rate locks increased $70.0 million or 1,942.6% as a result of a higher net change in our interest rate lock pipeline. The interest rate lock pipeline increased $1,976.1 million or 211.3% during the year ended December 31, 2020 compared to the year ended December 31, 2019. As of December 31, 2020, the weighted average net margin on our interest rate lock pipeline was 3.02% compared to 1.50% as of December 31, 2019.


102


Table of Contents
   

Origination related fee income increased $53.9 million or 83.7% as a result of higher loan origination volume during the year.


The above revenues were partially offset by an increase in net realized hedge losses on mortgage loan commitments of $115.8 million or 239.7% as a result of net declining market interest rates during the year.

For the year ended December 31, 2019 versus the year ended December 31, 2018

Total revenue increased $77.6 million or 17.3% as a result of higher gain on sale, net.


Gain on sale, net, increased $142.2 million or 39.6% as a result of higher sales volume during the year combined with increased margins on sold volume. We originated $15,437.1 million in mortgage loans in 2019 compared to $13,573.5 million in 2018. Weighted average margins on originated loans were 3.25% for 2019 compared to 2.65% for 2018.


Changes in fair value of loans held for sale decreased $3.9 million or 32.2% as a result of a lower net change in mortgage loans held for sale. The unsold pipeline increased $0.5 million or 90.3% during the year ended December 31, 2019 compared to the year ended December 31, 2018. As of December 31, 2019, weighted average margins on unsold production were 2.80%, compared to 3.90% as of December 31, 2018.


Changes in fair value of interest rate locks decreased $3.5 million or 49.6% as a result of a lower net change in our interest rate lock pipeline. The interest rate lock pipeline increased $0.2 million or 32.3% during the year ended December 31, 2019 compared to the year ended December 31, 2018.


Origination related fee income increased $15.8 million or 32.6% as a result of higher loan origination volume during the period.


The above revenues were partially offset by an increase in net realized hedge losses on mortgage loan commitments of $72.7 million or 298.3% as a result of net declining market interest rates during the year.

Expenses

In the table below is a summary of the components of our Mortgage Originations segment’s total expenses for the periods indicated (in thousands):


     For the three months ended
March 31,
     For the year ended
December 31,
 
     2021      2020      2020      2019      2018  

Commissions and bonus

   $ 111,766      $ 58,829      $ 458,674      $ 218,647      $ 160,429  

Salaries

     46,232        30,707        155,266        117,478        146,832  

Other salary related expenses

     18,451        12,450        48,666        38,400        42,849  


Total salaries, benefits and related expenses

     176,449        101,986        662,606        374,525        350,110  

Loan origination fees

     14,003        9,125        47,341        17,244        16,507  

Loan processing expenses

     5,462        2,593        11,877        8,687        3,500  

Other general and administrative expenses

     23,112        19,109        87,922        80,985        81,437  


Total general and administrative expenses

     42,577        30,827        147,140        106,916        101,444  

Occupancy, equipment rentals and other office related expenses

     5,220        5,378        21,817        25,453        29,827  


Total expenses

   $ 224,246      $ 138,191      $ 831,563      $ 506,894      $ 481,381  


103


Table of Contents

For the three months ended March 31, 2021 versus the three months ended March 31, 2020

Total expenses increased $86.1 million or 62.3% as a result of higher salaries, benefits and related expenses combined with an increase in general and administrative expenses.


Salaries, benefits and related expenses increased $74.5 million or 73.0%, primarily due to a $52.9 million increase in commissions and bonus expense as a result of the 99.1% increase in origination volume during the three months ended March 31, 2021. Our average headcount increased from 2,540 for the three months ended March 31, 2020 to 3,058 for the 2021 period in order to originate and fulfill the increase in loan origination volume.


General and administrative expenses increased $11.8 million or 38.1% primarily due to an increase in loan origination fees as a result of higher origination volumes. Additionally, other general and administrative expenses increased by $4.0 million, primarily attributable to increases in business development and communications and data processing, with a slight offset through a reduction in travel and entertainment expenses.

For the year ended December 31, 2020 versus the year ended December 31, 2019

Total expenses increased $324.7 million or 64.1% as a result of higher salaries, benefits and related expenses combined with an increase in general and administrative expenses.


Salaries, benefits and related expenses increased $288.1 million or 76.9%, primarily due to a $240.0 million increase in commissions and bonus expense as a result of the 88.3% increase in origination volume during 2020. Additionally, the increase was attributable to an increase of $37.8 million or 32.2% in salaries due to higher headcount. Average headcount was 2,766 for 2020 compared to 2,645 for 2019.


General and administrative expenses increased $40.2 million or 37.6% primarily due to increased loan origination fees as a result of higher origination volumes.

For the year ended December 31, 2019 versus the year ended December 31, 2018

Total expenses increased $25.5 million or 5.3% as a result of higher salaries, benefits and related expenses combined with an increase in general and administrative expenses, offset by lower occupancy, equipment rentals, and other office related expenses.


Salaries, benefits and related expenses increased $24.4 million or 7.0%, primarily due to a $58.2 million increase in commission and bonus expense as a result of the 13.7% increase in origination volume during 2019. This increase was partially offset by a decrease of $29.4 million in salary expense due to lower headcount. Average headcount was 2,645 for 2019 compared to 3,349 for 2018.

Reverse Originations Segment

The following table summarizes our Reverse Originations segment’s results for the periods indicated (in thousands):


     For the three months ended
March 31,
     For the year ended
December 31,
 
     2021      2020      2020      2019      2018  

Net origination gains

   $ 68,449      $ 34,589      $ 192,257      $ 141,022      $ 148,925  

Fee income

     558        603        1,837        3,478        7,588  


Total revenue

     69,007        35,192        194,094        144,500        156,513  


Total expenses

     23,693        18,584        87,219        79,522        68,802  


NET INCOME BEFORE TAXES

   $ 45,314      $ 16,608      $ 106,875      $ 64,978      $ 87,711  


104


Table of Contents

Our Reverse Originations segment generates its revenues primarily from the origination of reverse mortgage loans, including loans insured by FHA, and non-agency jumbo reverse mortgage loans. Revenue from our Reverse Originations segment include both our initial estimate of fair value gains on the date of origination (“Net origination gains”), which is determined by utilizing quoted prices on similar securities or internally-developed models utilizing observable market inputs, in addition to fees earned at the time of origination of the associated loans. We elect to account for all originated loans at fair value. The loans are immediately transferred to our Portfolio Management segment, and any future fair value adjustments, including interest earned, on these originated loans are reflected in revenues of our Portfolio Management segment until final disposition.

For the three months ended March 31, 2021 versus the three months ended March 31, 2020

Net income before taxes increased $28.7 million or 172.8% as a result of higher net origination gains on originated reverse mortgage loans.


During 2021, the weighted average margin on production was 8.90% compared to 5.27% in 2020. The Reverse Originations segment originated $768.8 million of reverse mortgage loans for the three months ended March 31, 2021 compared to $656.3 million for the 2020 period. The higher loan origination volume is attributable to the favorable interest rate environment and increased market penetration in 2021.


Total expenses increased $5.1 million or 27.5% as a result of higher loan origination volume during the three months ended March 31, 2021 compared to the 2020 period.

For the year ended December 31, 2020 versus the year ended December 31, 2019

Net income before taxes increased $41.9 million or 64.5% as a result of higher net origination gains on originated reverse mortgage loans.


During 2020, the weighted average margin on production was 6.03% compared to 4.72% in 2019. The Reverse Originations segment originated $2,706.8 million of reverse mortgage loans in 2020 compared to $2,487.2 million in 2019. The higher loan origination volume is attributable to the favorable interest rate environment and increased market penetration in 2020.


Fee income decreased $1.6 million or 47.2%. In June 2019, we reduced origination fees on non-agency reverse mortgage products to make our products more attractive to borrowers.


Total expenses increased $7.7 million or 9.7% as a result of higher loan origination volume during the year.

For the year ended December 31, 2019 versus the year ended December 31, 2018

Net income before taxes decreased $22.7 million or 25.9% as a result of lower net origination gains on originated reverse mortgage loans combined with higher general and administrative expenses.


Net origination gains decreased $7.9 million or 5.3% as a result of lower weighted average margin on production due to product and channel mix, partially offset by higher loan origination volumes. We originated $2,487.2 million of reverse mortgage loans in 2019 compared to $1,881.8 million in 2018. During 2019, the weighted average margin on loan originations was 4.72% compared to 6.26% in 2018, a decrease of 24.6%.


Fee income decreased $4.1 million or 54.2% despite the increase in loan origination volume. In June 2019, we reduced origination fees on non-agency reverse mortgage products to make our products more attractive to borrowers.


Total expenses increased $10.7 million or 15.6% as a result of higher origination volume during the period combined with higher professional fees.


105


Table of Contents

KEY METRICS

The following table provides a summary of some of our Reverse Originations segment’s key metrics (dollars in thousands):


     For the three months ended
March 31,
     For the year ended
December 31,
 
     2021      2020      2020      2019      2018  

Loan origination volume


Total loan origination volume - New originations - dollars(1)

   $ 768,795      $ 656,277      $ 2,706,780      $ 2,487,192      $ 1,881,795  

Total loan origination volume - Tails - dollars(2)

     120,775        129,985        479,882        502,349        496,209  


Total loan origination volume - dollars

   $ 889,570      $ 786,262      $ 3,186,662      $ 2,989,541      $ 2,378,004  

Total loan origination volume - units

     2,864        2,296        9,653        7,942        7,572  

Loan origination volume by channel (dollars)(3)


Retail

   $ 127,679      $ 72,624      $ 389,382      $ 268,084      $ 210,418  

TPO

     641,116        583,653        2,317,398        2,219,108        1,671,377  


Total loan origination volume by channel

   $ 768,795      $ 656,277      $ 2,706,780      $ 2,487,192      $ 1,881,795  


(1)

New loan origination volumes consist of initial reverse mortgage loan borrowing amounts.

(2) 

Tails consist of subsequent borrower advances, mortgage insurance premiums, service fees and advances which we are able to subsequently pool into a security.

(3)

Loan origination volumes by channel consist of initial reverse mortgage loan borrowing amounts, exclusive of subsequent borrower advances, mortgage insurance premiums, service fees and advances which we are able to subsequently pool into a security.

Revenue

In the table below is a summary of the components of our Reverse Originations segment’s total revenue for the periods indicated (in thousands):


     For the three months ended
March 31,
    For the year ended
December 31,
 
     2021     2020     2020     2019     2018  

Net origination gains


Retail

   $ 16,913     $ 6,489     $ 41,641     $ 20,508     $ 20,571  

TPO

     99,678       68,098       307,851       237,887       221,476  

Acquisition costs

     (48,142     (39,998     (157,235     (117,373     (93,122


Total net origination gains

     68,449       34,589       192,257       141,022       148,925  

Fee income

     558       603       1,837       3,478       7,588  


Total revenue

   $ 69,007     $ 35,192     $ 194,094     $ 144,500     $ 156,513  


For the three months ended March 31, 2021 versus the three months ended March 31, 2020

Total revenue increased $33.8 million or 96.1% as a result of higher net origination gains.


Net origination gains increased $33.9 million or 97.9% as a result of higher loan origination volume during the three months ended March 31, 2021 combined with increased margins on this origination volume. The higher origination volumes were due to the favorable interest rate environment and


106


Table of Contents
 

increased market penetration during the period. We originated $768.8 million of reverse mortgage loans for the three months ended March 31, 2021, an increase of 17.1%, compared to $656.3 million for the comparable 2020 period. During the three months ended March 31, 2021, the weighted average margin on production was 8.90% compared to 5.27% in 2020, an increase of 68.9%.

For the year ended December 31, 2020 versus the year ended December 31, 2019

Total revenue increased $49.6 million or 34.3% as a result of higher net origination gains.


Net origination gains increased $51.2 million or 36.3% as a result of higher loan origination volume during the period combined with increased margins on this origination volume. The higher origination volumes were due to the favorable interest rate environment and increased market penetration during the year. We originated $2,706.8 million of reverse mortgage loans in 2020 compared to $2,487.2 million in 2019. During 2020, the weighted average margin on production was 6.03% compared to 4.72% in 2019, an increase of 27.8%.

For the year ended December 31, 2019 versus the year ended December 31, 2018

Total revenue decreased $12.0 million or 7.7% as a result of lower net origination gains and lower origination fee income.


Net origination gains decreased $7.9 million or 5.3% as a result of lower weighted average margin on originated volume partially offset by higher loan origination volumes as a result of product and channel mix. We originated $2,487.2 million of reverse mortgage loans in 2019 compared to $1,881.8 million in 2018. During 2019, the weighted average margin on loan originations was 4.72% compared to 6.26% in 2018, a decrease of 24.6%.


Fee income decreased $4.1 million or 54.2%. In 2019, we reduced certain origination fees on our non-agency reverse mortgage products to make our products more attractive to our borrowers.

Expenses

In the table below is a summary of the components of our Reverse Originations segment’s total expenses for the periods indicated (in thousands):


     For the three months ended
March 31,
     For the year ended
December 31,
 
     2021      2020      2020      2019      2018  

Salaries and bonuses

   $ 11,692      $ 9,703      $ 41,355      $ 36,760      $ 33,637  

Other salary related expenses

     1,395        1,218        3,716        3,293        3,431  


Total salaries, benefits and related expenses

     13,087        10,921        45,071        40,053        37,068  

Loan origination fees

     3,258        2,619        12,230        9,981        5,844  

Professional fees

     2,079        2,106        8,303        11,545        5,959  

Other general and administrative expenses

     4,958        2,566        20,036        16,628        17,706  


Total general and administrative expenses

     10,295        7,291        40,569        38,154        29,509  

Occupancy, equipment rentals and other office related expenses

     311        372        1,579        1,315        2,225  


Total expenses

   $ 23,693      $ 18,584      $ 87,219      $ 79,522      $ 68,802  


107


Table of Contents

For the three months ended March 31, 2021 versus the three months ended March 31, 2020

Total expenses increased $5.1 million or 27.5% as a result of higher general and administrative expenses combined with an increase in salaries, benefits and related expenses.


Salaries, benefits and related expenses increased $2.2 million or 19.8%, primarily due to an increase in average headcount and production related compensation. Average headcount for the three months ended March 31, 2021 was 329 compared to 265 for the 2020 period.


General and administrative expenses increased $3.0 million or 41.2% primarily due to higher loan originations in 2021.

For the year ended December 31, 2020 versus the year ended December 31, 2019

Total expenses increased $7.7 million or 9.7% as a result of higher salaries, benefits and related expenses combined with an increase in general and administrative expenses.


Salaries, benefits and related expenses increased $5.0 million or 12.5%, primarily due to an increase in average headcount in addition to an increase in commissions and accrued bonus compensation. Average headcount for the year ended December 31, 2020 was 279 compared to 259 for the year ended December 31, 2019.


General and administrative expenses increased $2.4 million or 6.3% primarily due to increased loan origination fees of $2.2 million as a result of higher loan origination volume combined with an increase in business development expenses of $5.3 million, offset by a decrease in professional fees of $3.2 million for the year ended December 31, 2020 compared to the year ended December 31, 2019. During 2020, we began to shift our marketing strategy to a branded lead generation strategy, rather than a purchased lead or referral spend strategy utilized in 2019.

For the year ended December 31, 2019 versus the year ended December 31, 2018

Total expenses increased $10.7 million or 15.6% as a result of higher salaries, benefits and related expenses combined with an increase in general and administrative expenses.


Salaries, benefits and related expenses increased $3.0 million or 8.1%, primarily due to increased allocations of salaries, benefits and related expenses from Corporate for the year ended December 31, 2019 compared to 2018. Average headcount for 2019 was 259 compared to 286 for 2018.


General and administrative expenses increased $8.6 million or 29.3% primarily due to an increase in loan origination fees of $4.1 million combined with higher professional fees of $5.6 million as a result of higher loan origination volume and increased utilization of Corporate services.

Commercial Originations Segment

The following table summarizes our Commercial Originations segment’s results for the periods indicated (in thousands):


     For the three months ended
March 31,
     For the year ended
December 31,
 
     2021      2020      2020     2019      2018  

Net origination gains

   $ 5,431      $ 8,561      $ 13,350     $ 30,512      $ 22,981  

Fee income

     9,079        10,836        23,862       36,094        19,382  


Total revenue

     14,510        19,397        37,212       66,606        42,363  


Total expenses

     13,391        15,890        41,341       51,882        35,753  


NET INCOME (LOSS) BEFORE TAXES

   $ 1,119      $ 3,507      $ (4,129   $ 14,724      $ 6,610  


108


Table of Contents

Our Commercial Originations segment generates its revenues primarily from the origination of loans secured by 1-8 family residential properties, which are owned for investment purposes as either long-term rentals (“SFR”) or “fix and flip” properties which are undergoing construction or renovation. Revenue from our Commercial Originations segment include both our initial estimate of fair value gains on the date of origination (“Net origination gains”), which is determined by utilizing quoted prices on similar securities or internally-developed models utilizing observable market inputs, in addition to fees earned at the time of origination of the associated loans. We elect to account for all originated loans at fair value. The loans are immediately transferred to our Portfolio Management segment, and any future fair value adjustments, including interest earned, on these originated loans are reflected in revenues of our Portfolio Management segment until final disposition.

For the three months ended March 31, 2021 versus the three months ended March 31, 2020

Net income before taxes decreased $2.4 million or 68.1% as a result of lower net origination gains on originated loans combined with lower fee income.


We originated $340.9 million in loans for the 2021 period compared to $459.1 million during the 2020 period. Lower loan origination volume is attributable to a reduction in commercial production and a decrease in capital market demand for non-GSE or government loan products since the COVID-19 outbreak began in March of 2020. Production volume and margins have been rebuilding and are approaching pre- COVID-19 levels.


Fee income decreased $1.8 million or 16.2% primarily as a result of the 25.7% decrease in origination volume during the 2021 period.

For the year ended December 31, 2020 versus the year ended December 31, 2019

Net loss before taxes increased $18.9 million or 128.0% as a result of lower net origination gains on originated loans combined with lower fee income.


We originated $855.3 million in commercial loans in 2020 compared to $1,234.8 million in 2019. Lower loan origination volume is attributable to a temporary deferment of commercial production in March to May of 2020 due to the COVID-19 outbreak and impact to capital markets demand for non-GSE or government loan products.


Fee income decreased $12.2 million or 33.9% primarily as a result of the 30.7% decrease in origination volume during the year.

For the year ended December 31, 2019 versus the year ended December 31, 2018

Net income before taxes increased $8.1 million or 122.8% as a result of higher net origination gains on originated loans combined with higher fee income.


We originated $1,234.8 million in commercial loans in 2019 compared to $897.1 million in 2018. Higher loan origination volume is attributable to growth in market penetration of the Commercial Originations segment. The business expanded due to competitive products and pricing combined with an experienced sales and marketing team specializing in investor real estate loans. During 2019, the business increased capacity through a 21% growth in headcount and improved productivity to 37 loans per employee compared to 33 loans per employee in 2018.


Fee income increased $16.7 million or 86.2% as a result of a 37.6% increase in origination volume during the year and increased fees charged to borrowers from a 2.16% average in 2018 to 2.97% on average in 2019.


Total expenses increased $16.1 million or 45.1% as a result of an increase in salaries, benefits and related expenses and general and administrative expenses due to the higher origination volume during 2019.


109


Table of Contents

KEY METRICS

The following table provides a summary of some of our Commercial Originations segment’s key metrics (dollars in thousands):


     For the three months ended
March 31,
     For the year ended
December 31,
 
     2021      2020      2020      2019      2018  

Loan origination volume (dollars)(1)


Portfolio

   $ 59,458      $ 39,695      $ 93,234      $ 85,118      $ 74,063  

SRL

     104,992        89,187        180,362        181,321        109,157  

Fix & flip

     90,018        169,621        339,696        798,620        713,876  

New construction

     3,422        95,855        95,855        151,152        —    

Agricultural

     83,013        64,728        146,168        18,542        —    


Total loan origination volume

   $ 340,903      $ 459,086      $ 855,315      $ 1,234,753      $ 897,096  


Loan origination volume (units)(1)


Portfolio

     71        22        84        49        49  

SRL

     643        543        1,129        1,173        691  

Fix & flip

     430        818        1,630        3,481        3,054  

New construction

     13        291        291        496        —    

Agricultural

     27        28        54        8        —    


Total loan origination volume

     1,184        1,702        3,188        5,207        3,794  


(1)

Loan originations volume and units consist of approved total borrower commitments. These amounts include amounts available to our borrowers but have not yet been drawn upon.

Revenue

In the table below is a summary of the components of our Commercial Originations segment’s total revenue for the periods indicated (in thousands):


     For the three months ended
March 31,
     For the year ended
December 31,
 
     2021      2020      2020      2019      2018  

Net origination gains

   $ 5,431      $ 8,561      $ 13,350      $ 30,512      $ 22,981  

Fee income

     9,079        10,836        23,862        36,094        19,382  


Total revenue

   $ 14,510      $ 19,397      $ 37,212      $ 66,606      $ 42,363  


For the three months ended March 31, 2021 versus the three months ended March 31, 2020

Total revenue decreased $4.9 million or 25.2% as result of lower net origination gains combined with lower fee income.


We originated $340.9 million in commercial loans for the three months ended March 31, 2021 compared to $459.1 million during the 2020 period. Lower loan origination volume is attributable to reduced production volume due to the COVID-19 outbreak and impact to capital markets demand for non-GSE or government loan products in 2020. Production volumes and margins have been rebuilding from the temporary deferment of commercial production in March to May of 2020 and are approaching pre-COVID-19 levels.


Fee income decreased $1.8 million or 16.2% primarily as a result of a 25.7% decrease in loan origination volume during the three months ended March 31, 2021.


110


Table of Contents

For the year ended December 31, 2020 versus the year ended December 31, 2019

Total revenue decreased $29.4 million or 44.1% as result of lower net origination gains combined with lower fee income.


We originated $855.3 million in commercial loans in 2020 compared to $1,234.8 million in comparable 2019. Lower loan origination volume is attributable to a temporary deferment of commercial production in March to May of 2020 due to the COVID-19 outbreak and impact to capital markets demand for non-GSE or government loan products.


Fee income decreased $12.2 million or 33.9% primarily as a result of a 30.7% decrease in loan origination volume during the year.

For the year ended December 31, 2019 versus the year ended December 31, 2018

Total revenue increased $24.2 million or 57.2% as a result of higher net origination gains combined with higher fee income.


We originated $1,234.8 million in commercial loans in 2019 compared to $897.1 million in 2018. Higher origination volume is attributable to growth in the Commercial Originations segment. The business expanded due to competitive products and pricing combined with an experienced sales and marketing team specializing in investor real estate products. During 2019, the business increased capacity through a 21% growth in headcount and improved productivity to 37 loans per employee compared to 33 loans per employee in 2018.


Fee income increased $16.7 million or 86.2% as a result of 37.6% increase in origination volume during the year and higher origination fees earned on originated loans. During 2019, we were able to increase the fees charged to borrowers from 2.2% on average in 2018 to 2.9% on average in 2019.

Expenses

In the table below is a summary of the components of our Commercial Originations segment’s total expenses for the periods indicated (in thousands):


     For the three months ended
March 31,
     For the year ended
December 31,
 
     2021      2020      2020      2019      2018  

Salaries

   $ 4,769      $ 4,127      $ 12,842      $ 12,889      $ 10,373  

Commissions and bonus

     2,092        2,820        6,923        9,280        6,931  

Other salary related expenses

     797        947        2,233        2,298        1,747  


Total salaries, benefits and related expenses

     7,658        7,894        21,998        24,467        19,051  

Loan origination fees

     3,140        4,542        10,075        16,830        7,488  

Professional fees

     891        1,449        3,963        5,766        4,221  

Other general and administrative expenses

     1,164        1,833        4,632        4,031        3,843  


Total general and administrative expenses

     5,195        7,824        18,670        26,627        15,552  

Occupancy, equipment rentals and other office related expenses

     538        172        673        788        1,150  


Total expenses

   $ 13,391      $ 15,890      $ 41,341      $ 51,882      $ 35,753  


111


Table of Contents

For the three months ended March 31, 2021 versus the three months ended March 31, 2020

Total expenses decreased $2.5 million or 15.7% primarily as a result of lower general and administrative expenses.


General and administrative expenses decreased $2.6 million or 33.6% primarily due to the decrease in loan origination fees as a result of the 25.7% decrease in loan origination volume during the three months ended March 31, 2021 compared to the 2020 period.

For the year ended December 31, 2020 versus the year ended December 31, 2019

Total expenses decreased $10.5 million or 20.3% as a result of lower general and administrative expenses combined with a decrease in salaries, benefits and related expenses.


Salaries, benefits and related expenses decreased $2.5 million or 10.1%, due to lower commissions and bonuses of $2.4 million or 25.4% as a result of the $379.4 million decrease in origination volume in 2020. The decrease in origination volume also caused a reduction in average headcount from 139 employees in 2019 to 136 employees in 2020. These decreases were driven by the temporary deferment of commercial production in March to May of 2020 due to the COVID-19 pandemic and the impact to capital markets demand for non-GSE or government loan products. In March 2020, certain employees were transitioned from our Commercial Originations segment to our Mortgage Originations segment to support the growth in production volume in that segment.


General and administrative expenses decreased $8.0 million or 29.9% primarily due to decreased loan origination fees related to the suspension of loan originations in March 2020 due to the COVID-19 outbreak.

For the year ended December 31, 2019 versus the year ended December 31, 2018

Total expenses increased $16.1 million or 45.1% as a result of higher salaries, benefits and related expenses combined with an increase in general and administrative expenses.


Salaries, benefits and related expenses increased $5.4 million or 28.4%, primarily due to a $2.3 million increase in commissions and bonus expense and a $2.5 million increase in salaries as a result of the 37.6% increase in loan origination volume during 2019. Commissions and bonuses for 2019 and 2018 amounted to 0.8% of loan originations. We had an average headcount of 139 employees with average salaries of $92.7 thousand in 2019 compared to 115 employees with average salaries of $90.2 thousand in 2018.


General and administrative expenses increased $11.1 million or 71.2% primarily due to increased loan origination fees of $9.3 million and professional fees of $1.5 million as a result of higher origination volumes. Origination fees as a percentage of loan origination volume in 2019 was 1.4% compared to 0.8% in 2018. The increase in professional fees is due to the outsourcing of certain loan fulfillment activities to third-party vendors.


112


Table of Contents

Lender Services Segment

The following table summarizes our Lender Services segment’s results for the periods indicated (in thousands):


     For the three months ended
March 31,
     For the year ended
December 31,
 
     2021     2020      2020     2019      2018  

Fee income

   $ 76,385     $ 41,258      $ 205,197     $ 110,046      $ 78,831  

Net interest (expense) income

     (36     9        (81     30        (489


Total revenue

     76,349       41,267        205,116       110,076        78,342  


Total expenses

     62,970       38,595        185,361       105,203        79,181  


NET INCOME (LOSS) BEFORE TAXES

   $ 13,379     $ 2,672      $ 19,755     $ 4,873      $ (839


For the three months ended March 31, 2021 versus the three months ended March 31, 2020

Net income before taxes increased $10.7 million or 400.7% as a result of increased fee income, primarily driven by an increase in title insurance underwriting, increased title agent closings in a lower interest rate environment and a larger client base.


Fee income increased or $35.1 million or 85.1% as a result of higher title insurance underwriting, title insurance orders, and title agent closings during the three months ended March 31, 2021 compared to the 2020 period.


Total expenses increased $24.4 million or 63.2% as a result of higher salaries and benefits combined with higher general and administrative expenses as a result of the 272.9% increase in title insurance underwriting policies and 118.1% increase in title agent closings in 2021 compared to the 2020 period.

For the year ended December 31, 2020 versus the year ended December 31, 2019

Net income before taxes increased $14.9 million or 305.4% as a result of increased fee income, primarily driven by an increase in title insurance underwriting, increased residential mortgage loan closings in a lower interest rate environment and a larger client base.


Fee income increased $95.2 million or 86.5% as a result of higher title agent closings and title insurance orders during the year ended December 31, 2020 compared to 2019.


Total expenses increased $80.2 million or 76.2% as a result of higher salaries and benefits combined with higher general and administrative expenses as a result of the 84.1% increase in residential mortgage loan closings in 2020.

For the year ended December 31, 2019 versus the year ended December 31, 2018

Net income before taxes increased $5.7 million or 680.8% as a result of increased fee income, primarily driven by residential mortgage loan closings in a lower interest rate environment, combined with a larger client base.


Fee income increased $31.2 million or 39.6% as a result of higher title agent closings and title insurance orders for the year ended December 31, 2019 compared to 2018.


Total expenses increased $26.0 million or 32.9% as a result of higher salaries, benefits and related expenses combined with higher general and administrative expenses as a result of the increase in our residential mortgage loan closings in 2019.


113


Table of Contents

KEY METRICS

The following table provides a summary of some of our Lender Services segment’s key metrics:


     For the three months ended
March 31,
     For the year ended
December 31,
 
     2021      2020      2020      2019      2018  

Incenter Title Agent Orders

     54,960        34,615        148,705        76,513        39,394  

Incenter Title Agent Closings

     46,991        21,550        99,144        53,867        24,791  

Total appraisals

     7,427        4,021        22,862        8,263        —    

Title Insurance Underwriter Policies

     48,814        13,092        86,960        40,113        35,074  

FTE Count for Fulfillment Revenue

     858        704        827        530        360  

Total MSR valuations performed

     124        134        529        450        408  

Revenue

In the table below is a summary of the components of our Lender Services segment’s total revenue for the periods indicated (in thousands):


     For the three months ended
March 31,
     For the year ended
December 31,
 
     2021     2020      2020     2019      2018  

Title agent and closing services

   $ 31,750     $ 23,531      $  94,292     $  53,356      $ 30,770  

Insurance underwriting services

     33,322       9,022        69,643       19,357        11,632  

Student and consumer loan origination services

     2,012       2,922        11,140       10,856        10,552  

Fulfillment services

     6,779       3,806        18,781       14,053        10,678  

MSR trade brokerage, valuation and other services

     2,462       1,974        11,245       5,799        7,004  

Other income

     60       3        96       6,625        8,195  

Net interest (expense) income

     (36     9        (81     30        (489


Total revenue

   $ 76,349     $ 41,267      $  205,116     $ 110,076      $  78,342  


For the three months ended March 31, 2021 versus the three months ended March 31, 2020

Total revenue increased $35.1 million or 85.0% as a result of higher title agent closings, and an increase in insurance underwriting services.


In 2021, we acted as title agent on 46,991 loan closings, compared to 21,550 loan closings in the 2020 period, an increase of 118.1%. We underwrote 48,814 policies during the three months ended March 31, 2021, compared to 13,092 underwritten policies for the 2020 period, an increase of 272.9%. These increases were primarily the result of the favorable interest rate environment during the three months ended March 31, 2021 compared to 2020.


MSR trade brokerage, valuation and other services increased $0.5 million or 24.7% for the three months ended March 31, 2021 compared to 2020, respectively. In 2021, we acted as broker for over $8,750.4 million in co-issue MSR sales, compared to $664.1 million in co-issue MSR sales in 2020.

For the year ended December 31, 2020 versus the year ended December 31, 2019

Total revenue increased $95.0 million or 86.3% as a result of higher title agent closings, title agent orders, and an increase in insurance underwriting services.


In 2020, we acted as title agent on 99,144 loan closings, compared to 53,867 loan closings in 2019, an increase of 84.1%. In addition, our insurance underwriting service underwrote 86,960 policies during the year ended December 31, 2020, compared to 40,113 underwritten policies for 2019, an increase of 116.8%. These increases were primarily the result of the favorable interest rate environment during the year ended December 31, 2020 compared to 2019 and a larger client base.


114


Table of Contents
   

Fulfillment services revenue increased $4.7 million or 33.6% in 2020 over 2019 as we increased the average number of our fulfillment professionals employed to 704 employees, an increase of 61.5% of our average fulfillment professionals employed during the year ended 2019.


MSR trade brokerage, valuation and other services increased $5.4 million or 93.9% for the year ended December 31, 2020 compared to 2019. In 2020, we acted as broker for $9.5 million in co-issue MSR sales, compared to $2.7 million in co-issue MSR sales for 2019.

For the year ended December 31, 2019 versus the year ended December 31, 2018

Total revenue increased $31.7 million or 40.5% as a result of higher agent closings and an increase in insurance underwriting services.


In 2019, we acted as title agent on 53,867 loan closings, compared to 24,791 loan closings in 2018, an increase of 117.3%. We underwrote 40,113 policies in 2019, compared to 35,074 underwritten policies for 2018, an increase of 14.4%. These increases were primarily the result of the favorable interest rate environment during 2019 compared to 2018.


Fulfillment services revenue increased $3.4 million or 31.6% in 2019 over 2018 as we increased the average number of our fulfillment professionals employed to 436 employees, an increase of 18.2% of our average fulfillment professionals employed during the year ended 2018.

Expenses

In the table below is a summary of the components of our Lender Services segment’s total expenses for the periods indicated (in thousands):


     For the three months ended
March 31,
     For the year ended
December 31,
 
     2021      2020      2020      2019     2018  

Salaries

   $ 16,715      $ 8,713      $  42,554      $ 35,674     $  28,494  

Commissions and bonus

     7,045        3,952        30,014        10,989       10,686  

Other salary related expenses

     4,001        2,911        11,602        6,351       5,408  


Total salaries, benefits and related expenses

     27,761        15,576        84,170        53,014       44,588  

Title and closing

     25,062        15,995        64,252        26,217       14,065  

Communication and data processing

     2,960        1,929        11,317        8,338       6,226  

Fair value change in deferred purchase price liability

     —          69        1,900        (2,195     325  

Other general and administrative expenses

     6,040        4,136        19,647        17,034       11,634  


Total general and administrative expenses

     34,062        22,129        97,116        49,394       32,250  

Occupancy, equipment rentals and other office related expenses

     1,147        890        4,075        2,795       2,343  


Total expenses

   $ 62,970      $ 38,595      $  185,361      $  105,203     $ 79,181  


For the three months ended March 31, 2021 versus the three months ended March 31, 2020

Total expenses increased $24.4 million or 63.2% as a result of higher salaries, benefits and related expenses combined with an increase in general and administrative expenses.


Salaries, benefits and related expenses increased $12.2 million or 78.2%, primarily due to the staffing required to support the 118.1% increase in title agent closings and 272.9% increase in title insurance underwriting policies. Commissions and bonus expense increased $3.1 million in conjunction with the increase in revenue.


115


Table of Contents
   

General and administrative expenses increased $11.9 million or 53.9% primarily due to higher title and closing expenses incurred associated with the 118.1% increase in title agent closings and 272.9% increase in title insurance underwriting policies.

For the year ended December 31, 2020 versus the year ended December 31, 2019

Total expenses increased $80.2 million or 76.2% as a result of higher salaries, benefits and related expenses combined with an increase in general and administrative expenses.


Salaries, benefits and related expenses increased $31.2 million or 58.8%, primarily due to the staffing required to support the 84.1% increase year-over-year in title agent closings and a 116.8% increase year-over-year in title insurance underwriting policies.


General and administrative expenses increased $47.7 million or 96.6% primarily due to higher title and closing expenses incurred associated with the 84.1% increase year-over-year in title agent closings and a 116.8% increase year-over-year in title insurance underwriting policies.

For the year ended December 31, 2019 versus the year ended December 31, 2018

Total expenses increased $26.0 million or 32.9% as a result of higher salaries, benefits and related expenses combined with an increase in general and administrative expenses.


Salaries, benefits and related expenses increased $8.4 million or 18.9%, primarily due to the staffing required to support the 94.2% increase year-over-year in title agent orders and 14.4% increase year-over-year in title insurance underwriting policies.


General and administrative expenses increased $17.1 million or 53.2% primarily due to the direct costs associated with the 94.2% increase year-over-year in title agent orders and 14.4% increase year-over-year in title insurance underwriting policies. In addition, we realized $2.2 million in fair value charges related to the change in fair value of contingent earnouts related to the prior years’ business acquisitions.

Corporate and Other

Our Corporate and Other segment consists of our BXO and other corporate services groups. These groups support our operating segments, and the cost of services directly supporting the operating segments are allocated to those operating segments on a cost of service basis. Enterprise-focused Corporate and Other expenses that are not incurred in direct support of the operating segments are kept unallocated within our Corporate and Other segment.

The following table summarizes our Corporate and Other segment’s results for the periods indicated (in thousands):


     For the three months ended
March 31,
    For the year ended
December 31,
 
     2021     2020     2020     2019     2018  

Net interest expense

   $ (7,744   $ (1,416     (8,937     (5,144     (1,717

Fair value adjustments to minority investments

     (9,464     —         —         —         —    


Total interest and other expense

     (17,208     (1,416     (8,937     (5,144     (1,717


Total expenses

     18,683       6,649       51,294       33,334       43,157  


NET LOSS

   $ (35,891   $ (8,065   $ (60,231   $ (38,478   $ (44,874


116


Table of Contents

In the table below is a summary of the components of our Corporate and Other segment’s total expenses for the periods indicated (in thousands):


     For the three months ended
March 31,
    For the year ended
December 31,
 
     2021     2020     2020     2019     2018  

Salaries and bonuses

   $ 22,779     $ 10,501     $ 63,837     $ 40,074     $ 41,438  

Other salary related expenses

     3,306       1,721       4,482       5,885       7,428  

Shared services - payroll allocations

     (18,657     (9,321     (41,727     (26,552     (26,812


Total salaries, benefits and related expenses

     7,428       2,901       26,592       19,407       22,054  

Communication and data processing

     3,015       1,334       6,613       4,638       11,179  

Professional fees

     10,334       1,415       16,685       15,292       18,697  

Other general and administrative expenses

     1,481       1,358       4,606       3,585       8,075  

Shared services - general and administrative allocations

     (3,694     (796     (4,412     (11,356     (18,648


Total general and administrative expenses

     11,136       3,311       23,492       12,159       19,303  

Occupancy, equipment rentals and other office related expenses

     119       437       1,210       1,768       1,800  


Total expenses

   $ 18,683     $ 6,649     $ 51,294     $ 33,334     $ 43,157  


For the three months ended March 31, 2021 versus the three months ended March 31, 2020

Net loss increased $27.8 million or 345.0% as a result of higher interest expense on non-funding corporate debt, fair value adjustment to minority investments, higher general and administrative expenses, net of allocations, combined with higher salaries, benefits and related expenses, net of allocations.


Total interest and other expense increased $15.8 million or 1,115.3% as a result of a $9.5 million decrease in the fair value of minority investments combined with $7.7 million of interest expense related to the senior unsecured notes issued in November 2020.


General and administrative expenses, net of shared services allocations, increased $7.8 million or 236.3% due to higher professional fees, including legal and accounting advisory fees related to the Business Combination.


Salaries, benefits, and related expenses, net of allocations, increased $4.5 million or 156.1% primarily due to an increase in average headcount and bonus compensation. Average headcount for the three months ended March 31, 2021 was 353 compared to 263 for the 2020 period.

For the year ended December 31, 2020 versus the year ended December 31, 2019

Net loss increased $21.8 million or 56.5% as a result of higher salaries, benefits and related expenses, net of allocations, combined with higher general and administrative expenses, net of allocations.


Total interest expense increased $3.8 million or 73.7% as a result of higher interest expense due to higher average outstanding balances on our non-funding lines of credit and the issuance of $350.0 million in senior unsecured notes in November 2020. In 2020, the average balance on our non-funding lines of credit was $48.6 million, compared to an average balance of $37.4 million during 2019.


Salaries, benefits, and related expenses, net of allocations, increased $7.2 million or 37.0% primarily due to an increase in commissions and accrued bonus compensation partially offset by increased allocations due to higher utilization of corporate services by our other segments.


General and administrative expenses, net of allocations, increased $11.3 million or 93.2% primarily due to higher nonrecurring professional fees, including legal and accounting advisory fees related to the


117


Table of Contents
 

Business Combination. The increase in general and administrative expenses was coupled with a decrease in shared services allocations of $6.9 million for 2020 compared to 2019.

For the year ended December 31, 2019 versus the year ended December 31, 2018

Net loss decreased $6.4 million or 14.3% as a result of lower salaries, benefits and related expenses, net of allocations combined with a decrease in general and administrative expenses, net of allocations.


Total interest expense increased $3.4 million as a result of higher interest expense due to higher average outstanding balances on our non-funding lines of credit. In 2019, our average balance on our non-funding lines of credit was $37.4 million, compared to an average balance of $2.0 million during 2018.


Salaries, benefits, and related expenses, net of allocations, decreased $2.6 million or 12.0% as a result of a realignment of certain BXO professionals during 2018. Our BXO office employed an average of 268 professionals during 2019, compared to 321 professionals employed during 2018. During 2019, we transferred several marketing and IT professionals out of BXO back into the operating segments to further align business development with the strategic objectives of these businesses.


General and administrative expenses, net of allocations, decreased $7.1 million or 37.0% due to lower communication and data processing expenses. During 2018, the Company began implementing Total Expert, an LO marketing tool kit that aims to provide a borrower interface into the loan process, and incurred $0.3 million, through June 2020, in implementation costs related to this software implementation.

NON-GAAP FINANCIAL MEASURES

The presentation of non-GAAP measures is used to enhance the investors’ understanding of certain aspects of our financial performance. This discussion is not meant to be considered in isolation, superior to, or as a substitute for the directly comparable financial measures prepared in accordance with U.S. Generally Accepted Accounting Principles (“GAAP”). These key financial measures provide an additional view of our performance over the long-term and provide useful information that we use in order to maintain and grow our business.

Adjusted EBITDA

We define Adjusted EBITDA as earnings before change in fair value of loans and securities held for investment due to assumption changes, interest on non-funding debt, depreciation, amortization and other impairments, change in fair value of earnouts, share-based compensation, change in fair value of minority investments and certain non-recurring costs. We manage our Company by each of our operating and non-operating segments: Loan Originations (made up of Mortgage, Reverse, and Commercial Originations segments), Portfolio Management, Lender Services and Corporate and Other. We evaluate the performance of our segments through the use of Adjusted EBITDA as a non-GAAP measure. Management considers Adjusted EBITDA important in evaluating our business segments and the Company as a whole. Adjusted EBITDA is a supplemental metric utilized by our management team to assess the underlying key drivers and operational performance of the continuing operations of the business and our operating segments. In addition, analysts, investors, and creditors may use these measures when analyzing our operating performance. Adjusted EBITDA is not a presentation made in accordance with GAAP and our use of this measure and term may vary from other companies in our industry.

Adjusted EBITDA provides visibility to the underlying operating performance by excluding the impact of certain items, including income taxes, interest expense on non-funding debt, depreciation of fixed assets, amortization of intangible assets and other impairments, share-based compensation, changes in fair value of loans and securities held for investment due to assumption changes, change in fair value of earnouts and minority investments, and


118


Table of Contents

other non-recurring costs that management does not believe are representative of our core earnings. Adjusted EBITDA may also include other adjustments, as applicable based upon facts and circumstances, consistent with our intent of providing a supplemental means of evaluating our operating performance.

Adjusted EBITDA should not be considered as an alternate to (i) net income (loss) or any other performance measures determined in accordance with GAAP or (ii) operating cash flows determine in accordance with GAAP. Adjusted EBITDA has important limitations as an analytical tool and should not be considered in isolation or as a substitute for analysis of our results as reported under GAAP. Some of these limitations of this metric are:


cash expenditures for future contractual commitments;


cash requirements for working capital needs;


cash requirements for certain tax payments; and


all non-cash income/expense items reflected in the Consolidated Statements of Cash Flows.

Because of these limitations, Adjusted EBITDA should not be considered as a measure of discretionary cash available to us to invest in the growth of our business or distribute to stockholders. We compensate for these limitations by relying primarily on our GAAP results and using Adjusted EBITDA only as a supplement. Users of our interim consolidated financial statements are cautioned not to place undue reliance on Adjusted EBITDA.

The following table provides a reconciliation of our net income (loss) before taxes to adjusted EBITDA (in thousands):


     For the three months ended
March 31,
    For the year ended
December 31,
 
     2021      2020     2020      2019     2018  

Net income (loss) before taxes to Adjusted EBITDA Reconciliation


Net income (loss) before taxes

   $ 125,457      $ (42,088   $ 500,257      $ 77,579     $ 47,531  

Adjustments for:


Change in fair value of loans and securities held for investment due to assumption changes(1)

     2,143        70,532       49,875        19,985       (10,455

Interest expense on non-funding debt

     7,706        1,076       7,685        2,908       1,359  

Depreciation, amortization and other impairments

     2,792        2,373       11,029        9,183       7,650  

Change in fair value of earnouts(2)

     30        273       3,014        (1,804     (1,525

Share-based compensation

     —          —         —          2,919       341  

Change in fair value of minority investments(3)

     9,464        —         5,512        (1,429     (2,168

Certain non-recurring costs(4)

     6,719        2,829       19,250        15,073       17,264  


Adjusted EBITDA

   $ 154,311      $ 34,995       $596,622      $ 124,414     $ 59,997  


(1)

Change in Fair Value of Loans and Securities Held for Investment due to Assumption Changes - This adjustment relates to changes in the significant market or model input components of the fair value for loans and securities which are held for investment, net of related liabilities. We include an adjustment for the significant market or model input components of the change in fair value because, while based on real observable and/or predicted changes in drivers of the valuation of assets, they may be mismatched in any given period with the actual change in the underlying economics or when they will be realized in actual cash flows. We do not record this change as a separate component in our financial records, but have generated this information based on modeling and certain assumptions. Changes in Fair Value of Loans and Securities


119


Table of Contents
  Held for Investment due to Assumption Changes includes changes in fair value for the following mortgage servicing rights, loans held for investment, and related liabilities:


  1.

Reverse mortgage loans held for investment, subject to HMBS related obligations, at fair value;

  2.

Mortgage loans held for investment, subject to nonrecourse debt, at fair value;

  3.

Mortgage loans held for investment, at fair value;

  4.

Debt Securities;

  5.

Mortgage servicing rights, at fair value;

  6.

HMBS related obligations, at fair value; and

  7.

Nonrecourse debt, at fair value.

The adjustment for changes in fair value of loans and securities held for investment due to assumption changes is calculated based on changes in fair value associated with the above assets and liabilities calculated in accordance with GAAP, excluding the period-to-date estimated impact of the change in fair value attributable to current period additions and the change in fair value attributable to portfolio run-off, net of hedge gains and losses and any securitization expenses incurred in securitizing our mortgage loans held for investment, subject to nonrecourse debt. This adjustment represents changes in accounting estimates that are measured in accordance with US GAAP. Actual results may differ from those estimates and assumptions due to factors such as changes in the economy, interest rates, secondary market pricing, prepayment assumptions, home prices or discrete events affecting specific borrowers, and such differences could be material. Accordingly, this number should be understood as an estimate and the actual adjustment could vary if our modeling is incorrect.


(2) 

Change in Fair Value of Earnouts - We are obligated to pay contingent consideration to sellers of acquired businesses based on future loan originations and profits. Change in fair value of earnouts represents impacts to revenue or expense due to changes in the estimated fair value of expected payouts as a result of changes in various assumptions, including future loan origination volumes, projected earnings and discount rates.

(3) 

Change in Fair Value of Minority Investments - The adjustment to minority equity investments and debt investments is based on the change in fair value, which is an item that management believes should be excluded when discussing our ongoing and future operations. Although the change in fair value of minority equity investments and debt investments is a recurring part of our business, we believe the adjustment is appropriate as the fair value fluctuations from period to period make it difficult to analyze core-operating trends.

(4) 

Certain Non-Recurring Costs - This adjustment relates to various one-time expenses and adjustments that management believes should be excluded as they do not relate to a recurring part of the core business operations. These items include certain one-time charges including estimated settlements for legal and regulatory matters, acquisition related expenses and other one-time charges.

Liquidity and Capital Resources

Impact of the Business Combination

New Pubco is a holding company and has no material assets other than its direct and indirect ownership of FoA Units. New Pubco has no independent means of generating revenue. FoA makes distributions to its holders of FoA Units, including New Pubco and the Continuing Unitholders, in an amount sufficient to cover all applicable taxes at assumed tax rates, payments under the Tax Receivable Agreements and dividends, if any, declared by it.

Deterioration in the financial condition, earnings or cash flow of FoA and its subsidiaries for any reason could limit or impair their ability to pay such distributions. Additionally, the terms of our financing arrangements, including financing lines of credit and senior notes, contain covenants that may restrict FoA and its subsidiaries from paying such distributions, subject to certain exceptions. In addition, one of our subsidiaries, FAM, is subject to various regulatory capital and minimum net worth requirements as a result of their mortgage origination and servicing activities. Further, FoA is generally prohibited under Delaware law from making a distribution to a member to the extent that, at the time of the distribution, after giving effect to the distribution, liabilities of FoA


120


Table of Contents

(with certain exceptions) exceed the fair value of its assets. Subsidiaries of FoA are generally subject to similar legal limitations on their ability to make distributions to FoA.

Our cash flows from operations, borrowing availability and overall liquidity are subject to risks and uncertainties. We may not be able to obtain additional liquidity on reasonable terms, or at all. Additionally, our liquidity and our ability to meet our obligations and to fund our capital requirements are dependent on our future financial performance, which is subject to general economic, financial, and other factors that are beyond our control. Accordingly, our business may not generate sufficient cash flow from operations and future borrowings may not be available from additional indebtedness or otherwise to meet our liquidity needs. Although we have no specific current plans to do so, if we decide to pursue one or more significant acquisitions, we may incur additional debt or sell additional equity to finance such acquisitions, which would result in additional expenses or dilution.

Tax Receivable Agreements

New Pubco will enter into Tax Receivable Agreements with certain of FoA’s existing owners that provides for the payment by New Pubco to such existing owners of 85% of the benefits, if any, that New Pubco is deemed to realize as a result of (i) tax basis adjustments that increased the tax basis of the tangible and intangible assets of FoA as a result of sales or exchanges of FoA Units in connection with or after the Business Combination or distributions with respect to the FoA Units prior to or in connection with the Business Combination, (ii) New Pubco’s utilization of certain tax attributes attributable to the Blockers or the Blocker Shareholders, and (iii) certain other tax benefits related to entering into the Tax Receivable Agreements, including tax benefits attributable to payments under the Tax Receivable Agreements. These increases in tax basis generated over time may increase (for tax purposes) New Pubco’s depreciation and amortization deductions and, therefore, these adjustments and other tax attributes may reduce the amount of tax that New Pubco would otherwise be required to pay in the future, although the IRS may challenge all or part of the validity of that tax basis or other tax attributes, and a court could sustain such a challenge. The anticipated tax basis adjustments upon exchanges of FoA Units for shares of Class A Common Stock may also decrease gains (or increase losses) on future dispositions of certain capital assets to the extent tax basis is allocated to those capital assets. Actual tax benefits realized by New Pubco may differ from tax benefits calculated under the Tax Receivable Agreements as a result of the use of certain assumptions in the Tax Receivable Agreements, including the use of an assumed weighted-average state and local income tax rate to calculate tax benefits. The payment obligation under the Tax Receivable Agreements is an obligation of New Pubco and not of FoA. New Pubco expects to benefit from the remaining 15% of cash tax benefits, if any, it realizes from such tax benefits. For purposes of the Tax Receivable Agreements, the cash tax benefits will be computed by comparing the actual income tax liability of New Pubco to the amount of such taxes that New Pubco would have been required to pay had there been no tax basis adjustments of the assets of New Pubco as a result of sales or exchanges and no utilization of certain tax attributes attributable to the Blockers or Blocker Shareholders, and had New Pubco not entered into the Tax Receivable Agreements. The term of the Tax Receivable Agreements will continue until all such tax benefits have been utilized or expired, unless (i) New Pubco exercises its right to terminate the Tax Receivable Agreements for an amount based on the agreed payments remaining to be made under the Tax Receivable Agreements, or (ii) New Pubco breaches any of its material obligations under the Tax Receivable Agreements or certain change of control events occur, in which case all obligations generally will be accelerated and due as if New Pubco had exercised its right to terminate the Tax Receivable Agreements. Estimating the amount of payments that may be made under the Tax Receivable Agreements is by its nature imprecise, insofar as the calculation of amounts payable depends on a variety of factors. The anticipated tax basis adjustments, as well as the amount and timing of any payments under the Tax Receivable Agreements, will vary depending upon a number of factors, including the timing of exchanges, the price of shares of our Class A Common Stock at the time of the exchange, the extent to which such exchanges are taxable, the amount of tax attributes, changes in tax rates and the amount and timing of our income.

The payments that New Pubco may make under the Tax Receivable Agreements are expected to be substantial. The payments under the Tax Receivable Agreements are not conditioned upon continued ownership of New Pubco or FoA by the Continuing Unitholders.


121


Table of Contents

We anticipate that New Pubco will account for the effects of these increases in tax basis and associated payments under the Tax Receivable Agreements arising from exchanges in connection with or after the Business Combination as follows:


New Pubco will record an increase in deferred tax assets for the estimated income tax effects of the increases in tax basis based on enacted federal and state tax rates at the date of the exchange;


to the extent we estimate that New Pubco will not realize the full benefit represented by the deferred tax asset, based on an analysis that will consider, among other things, our expectation of future earnings, New Pubco will reduce the deferred tax asset with a valuation allowance; and


New Pubco will record 85% of the estimated realizable tax benefit (which is the recorded deferred tax asset less any recorded valuation allowance) as an increase to the liability due under the Tax Receivable Agreements and the remaining 15% of the estimated realizable tax benefit as an increase to additional paid-in capital.


All of the effects of changes in any of New Pubco’s estimates after the date of the exchange will be included in net income. Similarly, the effect of subsequent changes in the enacted tax rates will be included in net income.

Sources and Uses of Cash

Our primary sources of funds for liquidity include: (i) payments received from sale or securitization of loans; (ii) payments from the liquidation or securitization of our outstanding participating interests in loans; and (iii) advance and warehouse facilities, other secured borrowings and the unsecured senior notes.

Our primary uses of funds for liquidity include: (i) funding of borrower advances and draws on outstanding loans; (ii) originations of loans; (iii) payment of operating expenses; (iv) repayment of borrowings and repurchases or redemptions of outstanding indebtedness, and (v) distributions to shareholders for the estimated taxes on pass-through taxable income.

Our cash flows from operating activities, as well as capacity through existing facilities, provide adequate resources to fund our anticipated ongoing cash requirements. We rely on these facilities to fund operating activities. As the facilities mature, we anticipate renewal of these facilities will be achieved. Future debt maturities will be funded with cash and cash equivalents, cash flow from operating activities and, if necessary, future access to capital markets. We continue to optimize the use of balance sheet cash to avoid unnecessary interest carrying costs.

Cash Flows

Our cash increased $113.7 million for the three months ended March 31, 2021, decreased $38.1 million for three months ended March 31, 2020 and increased $156.7 million, $143.4 million, and $111.0 million for the years ended December 31, 2020, 2019, and 2018, respectively. The increase in cash flows for these periods was primarily driven by an increase in proceeds on our loan sales of mortgage loans held for sale, net of origination activity and proceeds from securitization of mortgage loans held for investment. These cash inflows were partially offset by payments on our outstanding HMBS liabilities, net of new HMBS issuances.

Operating Cash Flow

Net cash provided by (used in) operating activities totaled $118.0 million and $(133.4) million for the three months ended March 31, 2021 and 2020, respectively and $(686.1) million, $101.1 million and $605.9 million for the years ended December 31, 2020, 2019 and 2018, respectively.

Cash provided by operating activities increased $251.4 million for the three months ended March 31, 2021 compared to three months ended March 31, 2020. The increase was primarily attributable to higher gain on sale,


122


Table of Contents

net, as a result of higher sales volume during the period combined with increased realized hedge gain proceeds. We sold $8,399.2 million in residential mortgage loans held for sale during the period compared to $4,018.6 million in the prior period. Weighted average margins on sold loans were 2.4% for 2021 compared to 3.40% for 2020. Cash proceeds from the higher sales volumes were partially offset by an increase in cash used for originations of residential mortgage loans during the period. We originated $8,404.2 million in residential mortgage loans during the period compared to $4,220.5 million in the prior period.

Cash used in operating activities increased for the year ended December 31, 2020 compared to the year ended December 31, 2019. The increase was primarily attributable to higher gain on sale, net, as a result of higher sales volume during the year combined with increased margins on sold volume. We originated $29,064.4 million in residential mortgage loans held for sale during the year compared to $15,437.1 million in the prior year. Weighted average margins on originated loans were 4.30% for 2020 compared to 3.25% for 2019. The higher origination volumes were partially offset by an increase in proceeds on the sale of residential mortgage loans and the corresponding gain on mortgage loans held for sale during the period. We sold $27,991.0 million in residential mortgage loans during the year compared to $14,852.6 million in the prior year.

Cash provided by operating activities decreased during the year ended December 31, 2019, compared to the year ended December 31, 2018. The decrease was primarily attributable to lower proceeds from the sale of originated mortgage loans during the year.

In addition, there were lower loan origination volumes on loans held for sale. In 2018, we classified originations of non-agency reverse mortgage product as cash flows from operating activities based on our previous treatment of these loans. During 2019, these cash flows have been reflected as cash outflows in investing activities.

Investing Cash Flow

Net cash used in investing activities totaled $312.0 million and $452.1 million for the three months ended March 31, 2021 and 2020, respectively and $875.1 million, $2,025.6 million and $817.0 million for the years ended December 31, 2020, 2019 and 2018, respectively.

The decrease of $140.0 million in cash used in our investing activities during the three months ended March 31, 2021, compared to three months ended March 31, 2020, was primarily attributable to higher proceeds on mortgage loans held for investment and mortgage loans held for investment, subject to nonrecourse debt during the 2021 compared to 2020. These amounts were partially offset by higher loan origination volumes on loans held for investment, primarily for reverse mortgage loans. We originated $889.6 million of reverse mortgage loans during 2021 compared to $786.3 million in 2020. Reverse mortgage loans originated consist of initial reverse mortgage loan borrowing amounts, and additional participations and accretions of reverse mortgage loans, including subsequent borrower advances, mortgage insurance premiums, service fees and advances for which we are able to subsequently pool into a security.

The decrease in cash used in investing activities during the year ended December 31, 2020, compared to the year ended December 31, 2019, was primarily attributable to higher proceeds on mortgage loans held for investment and mortgage loans held for investment, subject to nonrecourse debt during 2020 compared to 2019. These amounts were offset by higher loan origination volumes on loans held for investment, primarily for reverse mortgage loans. We originated $3,186.7 million of reverse mortgage loans during 2020 compared to $2,989.5 million in 2019.

The increase in cash used in investing activities during the year ended December 31, 2019, compared to the year ended December 31, 2018, was primarily attributable to higher loan origination volumes on loans held for investment, primarily for reverse mortgage loans. We originated $2,989.5 million of reverse mortgage loans during 2019 compared to $2,378.0 million in 2018. Reverse mortgage loans originated consist of initial reverse mortgage loan borrowing amounts, and additional participations and accretions of reverse mortgage loans,


123


Table of Contents

including subsequent borrower advances, mortgage insurance premiums, service fees and advances for which we are able to subsequently pool into a security. In 2018, we classified originations of our non-agency reverse mortgage product as cash flows from operating activities based on our previous treatment of these loans. During 2019, these cash flows have been reflected as cash flows in investing activities. In 2019, we purchased approximately $128.8 million in mortgage backed securities for investment purposes. These amounts are partially offset by higher proceeds on loans held for investment due to higher liquidations from payoffs and claim receipts.

Financing Cash Flow

Net cash provided by financing activities totaled $307.7 million and $547.4 million for the three months ended March 31, 2021 and 2020, respectively and $1,717.9 million, $2,067.9 million, and $322.2 million for the years ended December 31, 2020, 2019 and 2018, respectively.

The decrease of $239.7 million in cash provided by our financing activities during the three months ended March 31, 2021, compared to the three months ended March 31, 2020, was primarily attributable to a decrease in net proceeds from our financing lines of credit of $367.1 million compared to $466.3 million, respectively, a decrease in net proceeds from nonrecourse debt of $(78.8) million compared to $115.3 million, respectively, and member distributions of $75.0 million in 2021. The decrease in net proceeds provided from our financing lines of credit was partially offset by higher net proceeds on issuance of securitization of reverse mortgage loans subject to HMBS obligations of $96.0 million in 2021 compared to $(33.9) million in 2020.

The decrease in cash provided by financing activities during the year ended December 31, 2020, compared to the year ended December 31, 2019, was primarily attributable to net proceeds from financing lines of credit of $246.3 million for 2020 compared to $959.5 million for 2019. The decrease in net proceeds provided from financing lines of credit was partially offset by higher proceeds on issuance of nonrecourse debt. In 2020, we executed 10 securitizations and issued $3.3 billion in nonrecourse notes compared to 7 securitizations with an issuance of $2.5 billion in nonrecourse debt in 2019. Additionally, in November 2020, we issued $350.0 million of senior unsecured notes, less debt issuance costs of $13.4 million.

The increase in cash provided by financing activities during the year ended December 31, 2019, compared to the year ended December 31, 2018, was primarily attributable to higher proceeds on issuance of nonrecourse debt. In 2019, we executed 7 securitizations and issued $2.5 billion in nonrecourse notes compared to 4 securitizations with an issuance of $1.4 billion in nonrecourse debt in 2018. In addition, we had higher net proceeds from our financing lines of credit of $959.5 million compared to net payments of $95.6 million in 2018.

Financial Covenants

Our credit facilities contain various financial covenants, which primarily relate to required tangible net worth amounts, liquidity reserves, leverage ratio requirements, and profitability requirements. These covenants are measured at our operating subsidiaries. As of March 31, 2021, we were in compliance with all of our required financial covenants.

Seller/Servicer Financial Requirements

We are also subject to net worth, capital ratio and liquidity requirements established by the Federal Housing Finance Agency (“FHFA”) for Fannie Mae and Freddie Mac Seller/Servicers, and Ginnie Mae for single family issuers. In both cases, these requirements apply to our operating subsidiaries, FAM and FAR, which are licensed sellers/ servicers of the respective GSEs. As of March 31, 2021, we were in compliance with all of our seller/servicer financial requirements for FHA and Ginnie Mae. For additional information see Note 28 - Liquidity and Capital Requirements within the interim unaudited consolidated financial statements.


124


Table of Contents

Minimum Net Worth

The minimum net worth requirement for Fannie Mae and Freddie Mac is defined as follows:


Base of $2.5 million plus 25 basis points of outstanding UPB for total loans serviced.


Tangible Net Worth comprises of total equity less goodwill, intangible assets, affiliate receivables and certain pledged assets.

The minimum net worth requirement for Ginnie Mae is defined as follows:


The sum of (i) base of $2.5 million plus 35 basis points of the issuer’s total single-family effective outstanding obligations, and (ii) base of $5 million plus 1% of the total effective HMBS outstanding obligations.


Tangible Net Worth is defined as total equity less goodwill, intangible assets, affiliate receivables and certain pledged assets. Effective for fiscal year 2020, under the Ginnie Mae MBS Guide, the issuers will no longer be permitted to include deferred tax assets when computing the minimum net worth requirement.

Minimum Capital Ratio


In addition to the minimum net worth requirement, we are also required to hold a ratio of Tangible Net Worth to Total Assets (excluding HMBS securitizations) greater than 6%.


FAR received a permanent waiver for the minimum outstanding capital requirements from Ginnie Mae.

Minimum Liquidity

The minimum liquidity requirement for Fannie Mae and Freddie Mac is defined as follows:


3.5 basis points of total Agency Mortgage Servicing, plus


Incremental 200 basis points times the sum of the following:


The total UPB of nonperforming (90 or more days delinquent) Agency Mortgage Servicing that is not in forbearance, plus


The total UPB of nonperforming (90 or more days delinquent) Agency Mortgage Servicing that is in forbearance and which were delinquent at the time it entered forbearance, plus


30% of the UPB of nonperforming (90 or more days delinquent) Agency Mortgage Servicing that is in forbearance and which were current at the time it entered forbearance


This liquidity must only be maintained to the extent this sum exceeds 6% of the total Agency Mortgage Servicing UPB.


Allowable assets for liquidity may include: cash and cash equivalents (unrestricted), available for sale or held for trading investment grade securities (e.g., Agency MBS, Obligations of GSEs, US Treasury Obligations); and unused/available portion of committed servicing advance lines.

The minimum liquidity requirement for Ginnie Mae is defined as follows:


Maintain liquid assets equal to the greater of $1.0 million or 10 basis points of our outstanding single-family MBS.


Maintain liquid assets equal to at least 20% of our net worth requirement for HECM MBS.


125


Table of Contents

Summary of Certain Indebtedness

The following description is a summary of certain material provisions of our outstanding indebtedness. As of March 31, 2021, our debt obligations were approximately $18,663.0 million. This summary does not restate the terms of our outstanding indebtedness in its entirety, nor does it describe all of the material terms of our indebtedness.

Warehouse Lines of Credit

Mortgage facilities

As of March 31, 2021, our Mortgage Originations segment had $3.1 billion in warehouse lines of credit collateralized by first lien mortgages with $1.9 billion aggregate principal amount drawn through 13 funding facility arrangements with 13 active lenders. These facilities are generally structured as master repurchase agreements under which ownership of the related eligible loans is temporarily transferred to a lender or as participation arrangements pursuant to which the lender acquires a participation interest in the related eligible loans. The funds advanced to us are generally repaid using the proceeds from the sale or securitization of the loans to, or pursuant to, programs sponsored by Fannie Mae, Freddie Mac, and Ginnie Mae or to private secondary market investors, although prior payment may be required based on, among other things, certain breaches of representations and warranties or other events of default.

When we draw on these facilities, we generally must transfer and pledge eligible loans to the lender, and comply with various financial and other covenants. The facilities generally have one-year terms and expire at various times during 2021. Under our facilities, we generally transfer the loans at an advance rate less than the principal balance or fair value of the loans (the “haircut”), which serves as the primary credit enhancement for the lender. Since the advances to us are generally for less than 100% of the principal balance of the loans, we are required to use working capital to fund the remaining portion of the principal balance of the loans. The amount of the advance that is provided under the various facilities ranges from 94% to 100% of the market value or principal balance of the loans. Upon expiration, management believes it will either renew its existing warehouse facilities or obtain sufficient additional lines of credit. The interest rate on all outstanding facilities is LIBOR plus applicable margin.

The following table presents additional information about our Mortgage Originations segment’s warehouse facilities as of March 31, 2021 (in thousands):


Mortgage Warehouse Facilities

   Maturity Date    Total Capacity      March 31, 2021  

April 2021 $350M Facility(1)

   April 2021    $ 350,000      $ 244,633  

May 2021 $250M Facility(1)(2)

   May 2021      250,000        215,401  

July 2021 $150M Facility(1)

   July 2021      150,000        137,486  

August 2021 $300M Facility(2)

   August 2021      300,000        69,587  

August 2021 $200M Facility(2)

   August 2021      200,000        122,513  

October 2021 $250M Facility(2)

   October 2021      250,000        227,789  

October 2021 $200M Facility(2)

   October 2021      200,000        120,156  

November 2021 $150M Facility(1)

   November 2021      150,000        118,611  

February 2022 $300M Facility(2)

   February 2022      300,000        5,080  

March 2022 $300M Facility(2)

   March 2022      300,000        166,592  

March 2022 $225M Facility

   March 2022      225,000        189,820  

March 2022 $200M Facility(2)

   March 2022      200,000        171,598  

March 2022 $200M Facility(2)

   March 2022      200,000        118,041  


Total mortgage warehouse facilities

      $ 3,075,000      $ 1,907,307  


(1)

See Note 32 - Subsequent Events within the interim unaudited consolidated financial statements for additional information on facility amendments.

(2)

Denotes uncommitted facilities


126


Table of Contents

Reverse mortgage facilities

As of March 31, 2021, our Reverse Originations segment had $1.2 billion in warehouse lines of credit collateralized by first lien mortgages with $0.7 billion million aggregate principal amount drawn through 7 funding facility arrangements with 8 active lenders. These facilities are generally structured as master repurchase agreements under which ownership of the related eligible loans is temporarily transferred to a lender, or as participation arrangements pursuant to which the lender acquires a participation interest in the related eligible loans. The funds advanced to us are generally repaid using the proceeds from the sale or securitization of the loans to, or pursuant to, programs sponsored by Ginnie Mae or private secondary market investors, although prior payment may be required based on, among other things, certain breaches of representations and warranties or other events of default.

When we draw on these warehouse lines of credit, we generally must transfer and pledge eligible loans, and comply with various financial and other covenants. The facilities generally have one-year terms and expire at various times during 2021. Under our facilities, we generally transfer the loans at a haircut which serves as the primary credit enhancement for the lender. Since the advances to us are generally for less than the acquisition cost of the loans, we are required to use working capital to fund the remaining portion of the funding required for the loan. The amount of the advance that is provided under the various facilities ranges from 90 to 104% of the market value or principal balance of the loans. Upon expiration, management believes it will either renew its existing facilities or obtain sufficient additional lines of credit. The interest rate on all outstanding facilities is LIBOR plus applicable margin.

The following table presents additional information about our Reverse Origination segment’s warehouse facilities as of March 31, 2021 (in thousands):


Reverse Warehouse Facilities

   Maturity Date    Total Capacity      March 31, 2021  

April 2021 $250M Facility(1)(2)

   April 2021    $ 250,000      $ 163,787  

April 2021 $200M Facility(1)

   April 2021      200,000        19,422  

June 2021 $75M Facility

   June 2021      75,000        51,173  

August 2021 $50M Facility(2)

   August 2021      50,000        —    

October 2021 $400M Facility

   October 2021      400,000        367,253  

December 2021 $100M Facility(2)

   December 2021      100,000        56,777  

March 2022 $100M Facility(2)

   March 2022      100,000        15,726  


Total reverse warehouse facilities

      $ 1,175,000      $ 674,138  


(1)

See Note 32 - Subsequent Events within the interim unaudited consolidated financial statements for additional information on facility amendments.

(2)

Denotes uncommitted facilities

Commercial loan facilities

As of March 31, 2021, our Commercial Originations segment had $0.7 billion in warehouse lines of credit collateralized by first lien mortgages and encumbered agricultural loans with $0.3 billion aggregate principal amount drawn through 6 funding facility arrangements with 6 active lenders. These facilities are either structured as master repurchase agreements under which ownership of the related eligible loans is temporarily transferred to a lender, as loan and security agreements pursuant to which the related eligible assets are pledged as collateral for the loan from the related lender or are collateralized by first lien loans or crop loans. The funds advanced to us are generally repaid using the proceeds from the sale or securitization of the loans to private secondary market investors, although prior payment may be required based on, among other things, certain breaches of representations and warranties or other events of default.

When we draw on these facilities, we must transfer and pledge eligible loan collateral, and comply with various financial and other covenants. The facilities generally have one-year terms and expire at various times during


127


Table of Contents

2021. Under our facilities, we generally transfer the loans at a haircut, which serves as the primary credit enhancement for the lender. One of our warehouse lines of credit is also guaranteed by our wholly-owned subsidiary, Finance of America Holdings LLC (“FAH”), the parent holding company to the commercial lending business. Since the advances to us are generally for less than 100% of the principal balance of the loans, we are required to use working capital to fund the remaining portion of the principal balance of the loans. The amount of the advance that is provided under the various facilities generally ranges from 70% to 85% of the principal balance of the loans. Upon expiration, management believes it will either renew its existing facilities or obtain sufficient additional lines of credit. The interest rate on all outstanding facilities is LIBOR plus applicable margin.

The following table presents additional information about our Commercial Origination segment’s warehouse facilities as of March 31, 2021 (in thousands):


Commercial Warehouse Facilities

   Maturity Date      Total Capacity      March 31, 2021  

November 2021 $50M Facility

     November 2021      $ 50,000      $ 28,520  

February 2022 $150M Facility(1)

     February 2022        150,000        22,572  

February 2022 $150M Facility

     February 2022        150,000        14,534  

August 2022 $75M

     August 2022        75,000        13,900  

September 2022 $150M Facility

     September 2022        150,000        88,124  

April 2023 $145M Facility

     April 2023        145,000        106,575  


Total commercial warehouse facilities

      $ 720,000      $ 274,225  


(1) 

Denotes uncommitted facilities

General

With respect to each of our warehouse facilities, we pay certain up-front and/or ongoing fees which can be based on our utilization of the facility. In some instances, loans held by a lender for a contractual period exceeding 45 to 60 calendar days after we originate such loans are subject to additional fees and interest rates.

Certain of our warehouse facilities contain sub-limits for “wet” loans, which allow us to finance loans for a minimal period of time prior to delivery of the note collateral to the lender. “Wet” loans are loans for which the collateral custodian has not yet received the related loan documentation. “Dry” loans are loans for which all the sale documentation has been completed at the time of funding. Wet loans are held by a lender for a contractual period, typically between five and ten business days and are subject to a reduction in the advance amount.

Interest is generally payable at the time the loan is settled off the line or monthly in arrears and principal is payable upon receipt of loan sale proceeds or transfer of a loan to another line of credit. The facilities may also require the outstanding principal to be repaid if a loan remains on the line longer than a contractual period of time, which ranges from 45 to 365 calendar days.

Interest on our warehouse facilities vary by facility and may depend on the type of asset that is being financed. Interest is based on an applicable margin over the London Inter-Bank Offered Rate (“LIBOR”) or the prime rate as illustrated in the tables in this section above.

Loans financed under certain of our warehouse facilities are subject to changes in market valuation and margin calls. The market value of our loans depends on a variety of economic conditions, including interest rates and market demand for loans. Under certain facilities, if the market value of the underlying loans declines below the outstanding asset balance on such loans or if the UPB of such loans falls below a threshold related to the repurchase price for such loans, we could be required to (i) repay cash in an amount that cures the margin deficit


128


Table of Contents

or (ii) supply additional eligible assets or rights as collateral for the underlying loans to compensate for the margin deficit. Certain warehouse facilities allow for the remittance of cash back to us if the value of the loan exceeds the principal balance.

Our warehouse facilities require each of our borrowing subsidiaries to comply with various customary operating and financial covenants, including, without limitation, the following tests:


minimum tangible or adjusted tangible net worth;


maximum leverage ratio of total liabilities (which may include off-balance sheet liabilities) or indebtedness to tangible or adjusted tangible net worth;


minimum liquidity or minimum liquid assets; and


minimum net income or pre-tax net income.

In the event we fail to comply with the covenants contained in any of our warehouse lines of credit, or otherwise were to default under the terms of such agreements, we may be restricted from paying dividends, reducing or retiring our equity interests, making investments or incurring more debt. As a result of market disruptions and fair value accounting adjustments taken in March 2020 resulting from the COVID-19 outbreak, our commercial loan origination subsidiary was in violation of its first, second, and third quarter 2020 profitability covenants with two of its warehouse lenders. We received waivers of the covenant violations from both lenders as well as amendments to profitability covenants for the remaining quarter of 2020. As of March 31, 2021, we were in compliance with all financial covenants.

Other Secured Lines of Credits

As of March 31, 2021, our Mortgage, Reverse, and Commercial Originations segments collectively had $0.6 billion in additional secured facilities with $0.5 billion aggregate principal amount drawn through credit agreements or master repurchase agreements with 7 active lenders. These facilities are secured by, among other things, eligible asset-backed securities, MSRs, and HECM tails. In certain instances, these assets are subject to existing first lien warehouse financing, in which case these facilities (i.e., mezzanine facilities) are secured by the equity in these assets exceeding first lien warehouse financing. One of our facilities was with Blackstone Residential Operating Partnership LP, an affiliate of our sponsor, Blackstone, as lender. These facilities are generally structured as master repurchase agreements under which ownership of the related eligible assets are temporarily transferred to a lender. The funds advanced to us are generally repaid using the proceeds from the sale or securitization of the underlying assets or distribution from underlying securities, although prior payment may be required based on, among other things, certain breaches of representations and warranties or other events of default.

When we draw on these facilities, we generally must transfer and pledge eligible assets to the lender, and comply with various financial and other covenants. Under our facilities, we generally transfer the assets at a haircut which serves as the primary credit enhancement for the lender. Three of these facilities are guaranteed by our wholly-owned subsidiary, FAH, the parent holding company to the mortgage, reverse mortgage and commercial lending businesses, and one of these also benefits from a pledge of equity of our wholly-owned subsidiary, FAR. Upon expiration, management believes it will either renew these facilities or obtain sufficient additional lines of credit.


129


Table of Contents

The following table presents additional information about our other secured lines of credit for our Mortgage, Reverse and Commercial Originations segments as of March 31, 2021 (in thousands):


Other Secured Lines of Credit

  Maturity Date  

Interest Rate

  Total
Capacity
    March 31,
2021
 

April 2021 $50M Facility(1)

  April 2021   Prime + applicable margin; 6.00% floor   $ 50,000     $ 40,820  

August 2021 $45M Facility

  August 2021   10%     45,000       25,000  

April 2022 $52.5M Facility

  April 2022   LIBOR + applicable margin     52,500       52,500  

April 2022 $45M Facility

  April 2022   9.00%     45,000       24,853  

February 2024 $90M Facility

  February 2024   LIBOR + applicable margin     90,000       80,754  

March 2026 $150M Facility - MSR

  March 2026   LIBOR + applicable margin     150,000       89,298  

$200M Repo Facility

  N/A   Bond accrual rate + applicable margin     200,000       168,187  

$2M Securities Repo Line

  N/A   Distributed Bond Interest + 50 bps     2,048       2,048  

$1.2M Repo Facility

  N/A   LIBOR + applicable margin     1,215       1,215  


Total other secured lines of credit

      $ 635,763     $ 484,675  


(1)

See Note 32 - Subsequent Events within the interim unaudited consolidated financial statements for additional information on facility amendments.

We pay certain up-front and ongoing fees based on our utilization with respect to many of these facilities. We pay commitment fees based upon the limit of the facility and unused fees are paid if utilization falls below a certain amount.

Interest is payable either at the time the loan or securities are settled off the line or monthly in arrears and principal is payable upon receipt of asset sale proceeds, principal distributions on the underlying pledged securities or transfer of assets to another line of credit and upon the maturity of the facility.

Under these facilities, we are generally required to comply with various customary operating and financial covenants. The financial covenants are similar to those under the warehouse lines of credit. We were in compliance with all of these covenants as of March 31, 2021.

HMBS related obligations

FAR is an approved issuer of HMBS securities that are guaranteed by Ginnie Mae and collateralized by participation interests in HECMs insured by the FHA. We originate HECMs insured by the FHA. Participations in the HECMs are pooled into HMBS securities which are sold into the secondary market with servicing rights retained. We have determined that loan transfers in the HMBS program do not meet the accounting definition of a participating interest because of the servicing requirements in the product that require the issuer/servicer to absorb some level of interest rate risk, cash flow timing risk and incidental credit risk due to the buyout of HECM assets as discussed below. As a result, the transfers of the HECMs do not qualify for sale accounting, and we, therefore, account for these transfers as financings. Holders of participating interests in the HMBS have no recourse against assets other than the underlying HECM loans, remittances, or collateral on those loans while they are in the securitization pools, except for standard representations and warranties and our contractual obligation to service the HECMs and the HMBS.

Remittances received on the reverse loans, if any, and proceeds received from the sale of real estate owned and our funds used to repurchase reverse loans are used to reduce the HMBS related obligations by making payments


130


Table of Contents

to the securitization pools, which then remit the payments to the beneficial interest holders of the HMBS. The maturity of the HMBS related obligations is directly affected by the liquidation of the reverse loans or liquidation of real estate owned and events of default as stipulated in the reverse loan agreements with borrowers. As an HMBS issuer, FAR assumes certain obligations related to each security it issues. The most significant obligation is the requirement to purchase loans out of the Ginnie Mae securitization pools once they reach certain limits set at loan origination for the maximum UPB allowed. Performing repurchased loans are generally conveyed to HUD and nonperforming repurchased loans are generally liquidated in accordance with program requirements.

As of March 31, 2021, we had HMBS-related borrowings of $9,926.1 million and HECMs pledged as collateral to the pools of $10,071.2 million, both carried at fair value.

Additionally, as the servicer of reverse loans, we are obligated to fund additional borrowing capacity primarily in the form of undrawn lines of credit on floating rate reverse loans. We rely upon our operating cash flows to fund these additional borrowings on a short-term basis prior to securitization. The additional borrowings are generally securitized within 30 days after funding. The obligation to fund these additional borrowings could have a significant impact on our liquidity.

Nonrecourse Debt

We securitize and issue interests in pools of loans that are not eligible for the Ginnie Mae securitization program. These include reverse mortgage loans that were previously repurchased out of an HMBS pool (“HECM Buyouts”), fix & flip securitized loans, and non FHA-insured non-agency reverse mortgages (“non-agency reverse mortgages-Securitized”). The transactions provide investors with the ability to invest in these pools of assets. The transactions provide us with access to liquidity for these assets, ongoing servicing fees, and potential residual returns for the residual securities we retain at the time of securitization. The transactions are structured as secured borrowings with the loan assets and liabilities, respectively, included in the interim unaudited Consolidated Statements of Financial Condition as mortgage loans held for investment, subject to nonrecourse debt, at fair value, and nonrecourse debt, at fair value. As of March 31, 2021, we had nonrecourse debt-related borrowings of $5,227.9 million.

Nonrecourse MSR Financing Liability, at Fair Value

In 2020, the Company entered into a nonrevolving facility commitment with various investors of FoA to pay an amount based on monthly cashflows received in respect of servicing fees generated from certain of the Company’s originated or acquired MSRs. Under these agreements, the Company has agreed to pay an amount to these parties equal to excess servicing and ancillary fees related to the identified MSRs in exchange for an upfront payment equal to the entire purchase price of the identified acquired or originated MSRs. These transactions are accounted for as financings under ASC 470, Debt.

As of March 31, 2021, the Company had an outstanding advance against this commitment of $22.4 million, with a fair value of $22.1 million, for the purchase of MSRs. The Company accrued for excess servicing and ancillary fees against the outstanding advances in the amount of $1.1 million to these investors for the three months ended March 31, 2021.

Senior Unsecured Notes

On November 5, 2020, Finance of America Funding LLC, a consolidated subsidiary of the Company, issued $350.0 million aggregate principal amount of senior unsecured notes due November 15, 2025. The senior unsecured notes bear interest at a rate of 7.875% per year, payable semi-annually in arrears on May 15 and November 15 beginning on May 15, 2021. The 7.875% senior unsecured notes are fully and unconditionally guaranteed, jointly and severally, on a senior unsecured basis by FoA and each of FoA’s material existing and future wholly-owned domestic subsidiaries (other than Finance of America Funding LLC and subsidiaries that cannot guarantee the notes for tax, contractual or regulatory reasons).


131


Table of Contents

At any time prior to November 15, 2022, Finance of America Funding LLC may redeem some or all of the 7.875% senior unsecured notes at a redemption price equal to 100% of the principal amount thereof, plus the applicable premium as of the redemption date under the terms of the indenture and accrued and unpaid interest. The redemption price during each of the twelve-month periods following November 15, 2022, November 15, 2023, and at any time after November 15, 2024 is 103.938%, 101.969% and 100.000%, respectively, of the principal amount plus accrued and unpaid interest thereon. At any time prior to November 15, 2022, Finance of America Funding LLC may also redeem up to 40% of the aggregate principal amount of the notes at a redemption price equal to 107.875% of the aggregate principal amount of the senior unsecured notes redeemed, with an amount equal to or less than the net cash proceeds from certain equity offerings, plus accrued and unpaid interest.

Upon the occurrence of a change of control, the holders of the 7.875% senior unsecured notes will have the right to require Finance of America Funding LLC to make an offer to repurchase each holder’s 7.875% senior unsecured notes at a price equal to 101% of their principal amount, plus accrued and unpaid interest. The consummation of the Business Combination did not result in a change of control for purposes of Finance of America Funding LLC’s 7.875% senior unsecured notes.

The 7.875% senior unsecured notes contain covenants limiting, among other things, Finance of America Funding LLC’s and its restricted subsidiaries’ ability to incur certain types of additional debt or issue certain preferred shares, incur liens, make certain distributions, investments and other restricted payments, engage in certain transactions with affiliates, and merge or consolidate or sell, transfer, lease or otherwise dispose of all or substantially all of Finance of America Funding LLC’s assets. These incurrence based covenants are subject to important exceptions and qualifications (including any relevant exceptions for the Business Combination). Many of these covenants will cease to apply with respect to the 7.875% senior unsecured notes during any time that the 7.875% senior unsecured notes have investment grade ratings from either Moody’s Investors Service, Inc. or Fitch Ratings Inc. and no default with respect to the 7.875% senior unsecured notes has occurred and is continuing.

FoA’s existing owners or their affiliated entities, including Blackstone and Brian L. Libman, FoA’s founder and chairman, purchased notes in the offering in an aggregate principal amount of $135.0 million.

Contractual Obligations and Commitments

The following table provides a summary of obligations and commitments outstanding as of March 31, 2021 (in thousands). The information below does not give effect to the Business Combination or the use of proceeds therefrom.


     Total      Less than 1
year
     1- 3
years
     3 - 5
years
     More than 5
years
 

Contractual cash obligations:


Warehouse lines of credit

   $ 2,753,646      $ 2,647,071      $ 106,575      $ —        $ —    

MSR line of credit

     170,052        —          80,754        89,298        —    

Other secured lines of credit

     416,647        65,820        179,377        —          171,450  

Nonrecourse debt

     5,110,698        1,229,167        3,881,531        —          —    

Notes payable

     336,296        —          —          336,296        —    

Operating leases

     50,001        14,869        30,526        4,052        554  


Total

   $ 8,837,340      $ 3,956,927      $ 4,278,763      $ 429,646      $ 172,004  


In addition to the above contractual obligations, we have also been involved with several securitizations of HECM loans, which were structured as secured borrowings. These structures resulted in us carrying the securitized loans on the interim unaudited Consolidated Statements of Financial Condition and recognizing the


132


Table of Contents

asset-backed certificates acquired by third parties as HMBS obligations. The timing of the principal payments on this nonrecourse debt is dependent on the payments received on the underlying mortgage loans and liquidation of real estate owned REO. The outstanding principal balance of loans held for investment, subject to HMBS related obligations was $9,179.0 million as of March 31, 2021.

In addition to the above contractual obligations, we have also been involved in the sale of a portion of the excess servicing and/or an agreement to pay certain amounts based on excess servicing cashflows generated on our owned mortgage servicing rights. These transactions are treated as structured financings in the interim unaudited Consolidated Statements of Financial Condition with the recognized proceeds being recorded as nonrecourse MSR financing liability. The timing of the payments of the nonrecourse MSR financing liability is dependent on the payments received on the underlying mortgage servicing rights.

The payments that we will be required to make under the Tax Receivable Agreements that was entered into in connection with the Business Combination may be significant and are not reflected in the contractual obligations tables set forth above.

Off Balance Sheet Arrangements

In the ordinary course of business, we may engage in certain activities that are not reflected on the interim unaudited Consolidated Statements of Financial Condition, generally referred to as off-balance sheet arrangements. These activities typically involve transactions with unconsolidated variable interest entities (“VIEs”).

For all VIEs in which we are involved, we assess whether we are the primary beneficiary of the VIE on an ongoing basis. In circumstances where we have both the power to direct the activities that most significantly impact the VIEs’ performance and the obligation to absorb losses or the right to receive the benefits of the VIE that could be significant, we would conclude that we are the primary beneficiary of the VIE, and would consolidate the VIE (also referred to as on-balance sheet). In situations where we are not deemed to be the primary beneficiary of the VIE, we do not consolidate the VIE and only recognize our interests in the VIE (also referred to as off-balance sheet).

We do not have any other off-balance sheet arrangements with unconsolidated entities or financial partnerships, including entities sometimes referred to as structured finance or special purpose entities that were established for the purpose of facilitating off-balance sheet arrangements or other contractually narrow or limited purposes as of March 31, 2021.

CRITICAL ACCOUNTING POLICIES

Various elements of our accounting policies, by their nature, are inherently subject to estimation techniques, valuation assumptions and other subjective assessments. In particular, we have identified several policies that, due to the judgment, estimates and assumptions inherent in those policies, are critical to an understanding of the interim unaudited consolidated financial statements. These policies relate to fair value measurements, particularly those determined to be Level 3 as discussed in Note 5 - Fair Value within the interim unaudited consolidated financial statements. We believe that the judgment, estimates and assumptions used in the preparation of the interim unaudited consolidated financial statements are appropriate given the factual circumstances at the time. However, given the sensitivity of the interim unaudited consolidated financial statements to these critical accounting policies, the use of other judgments, estimates and assumptions could result in material differences in our results of operations or financial condition. Fair value measurements considered to be Level 3 representing estimated values based on significant unobservable inputs include (i) the valuation of loans held for investment, subject to HMBS related obligations at fair value (ii) the valuation of loans held for investment, subject to nonrecourse debt, at fair value (iii) the valuation of loans held for investment, at fair value (iv) the valuation of HMBS related obligations, at fair value and (v) valuation of nonrecourse debt, at fair value.


133


Table of Contents

Fair Value Measurements

Reverse Mortgage Loans Held for Investment, at Fair Value

We have elected to account for all outstanding reverse mortgage loans held for investment at fair value. Outstanding reverse mortgage loans held for investment, at fair value include originated reverse mortgage loans that are expected to be sold or securitized in the secondary market, reverse mortgage loans that were previously securitized into either an HMBS or private securitization, or repurchased reverse loans out of Ginnie Mae securitization pools.

We have determined that HECM loans transferred under the current Ginnie Mae HMBS securitization program do not meet the requirements for sale accounting and are not derecognized upon date of transfer. The Ginnie Mae HMBS securitization program includes certain terms that do not meet the participating interest requirements and require or provide an option for the Company to reacquire the loans prior to maturity. Due to these terms, the transfer of the loans does not meet the requirements of sale accounting. As a result, the Company accounts for HECM loans transferred into HMBS securitizations as secured borrowings and continues to recognize the loans as held for investment, along with the corresponding liability for the HMBS related obligations.

As a jumbo reverse mortgage, non-agency reverse mortgage loans are designated for homeowners aged 62 or older with higher priced homes. The minimum home value is $0.5 million and the maximum loan amount is $4.0 million. Non-agency reverse mortgage loans are not insured by the FHA and will not be placed into a Ginnie Mae HMBS. However, the Company may transfer or pledge these assets as collateral for securitized nonrecourse debt obligations.

Reverse mortgage loans held for investment, at fair value also include claims receivable that have been submitted to HUD awaiting reimbursement. These amounts are recorded net of amounts the Company does not expect to recover through outstanding claims.

As an issuer of HMBS, we are required to repurchase reverse loans out of the Ginnie Mae securitization pools once the outstanding principal balance of the related HECM is equal to or greater than 98% of the maximum claim amount (“MCA”) (referred to as unpoolable loans). Performing repurchased loans are conveyed to HUD and payment is received from HUD typically within 75 days of repurchase. Nonperforming repurchased loans are generally liquidated through foreclosure, subsequent sale of the real estate owned, and claim submissions to HUD.

We recognize reverse mortgage loans held for investment at fair value with all changes in fair value recorded as a charge or credit to net fair value gains on mortgage loans and related obligations in the Consolidated Statements of Operations and Comprehensive Income. We estimate the fair value of these loans using a process that combines the use of a discounted cash flow model and analysis of current market data to arrive at an estimate of fair value. The cash flow assumptions and prepayment assumptions used in the model are based on various factors, with the key assumptions being prepayment, borrower mortality, borrower draw, home price appreciation, and discount rate assumptions.

Commercial Loans Held for Investment, at Fair Value

We have elected to account for all outstanding commercial loans held for investment at fair value. Outstanding commercial loans include originated Fix & Flip loans, consisting of short-term loans for individual real estate investors, with terms ranging from 9-18 months for which we intend to hold to maturity.

We recognize commercial loans held for investment at fair value with all changes in fair value recorded as a charge or credit to net fair value gains on loans in the Consolidated Statements of Operations and Comprehensive Income. We estimate the fair value of these loans using a process that combines the use of a discounted cash flow model and analysis of current market data to arrive at an estimate of fair value. The cash flow assumptions used in the model are based on various factors, with the key assumptions being prepayment, default rate, and discount rate assumptions.


134


Table of Contents

Mortgage Servicing Rights, at Fair Value

We account for retained and acquired MSRs in accordance with ASC 860, Transfers and Servicing. Under this method, servicing assets are measured at fair value on a recurring basis with changes in fair value recorded through earnings in the period of the change as a component of fee income in the Consolidated Statements of Operations and Comprehensive Income.

The fair value of the MSRs is based upon the present value of the expected future net cash flows related to servicing these loans. For MSRs that we have current commitments to sell to third parties, the fair value is based on the outstanding commitment price. We receive a base servicing fee based on the remaining outstanding principal balances of the loans, which are collected from borrowers on a monthly basis. We determine the fair value of the MSRs by the use of a discounted cash flow model that incorporates prepayment speeds, delinquencies, discount rate, ancillary revenues and other assumptions (including costs to service) that management believes are consistent with the assumptions other similar market participants use in valuing the MSRs.

HMBS Obligations, at Fair Value

We have elected to account for all outstanding HMBS obligations at fair value. The HMBS obligation considers the obligation to pass FHA insured cash flows through to the beneficial interest holders (repayment of the secured borrowings) of the HMBS securities and the servicer and issuer obligations of the Company.

As issuer and servicer of the HMBS security, we are required to perform various servicing activities, including processing borrower payments, maintaining borrower contact, facilitating borrower advances, generating borrower statements, and facilitating loss-mitigation strategies in an attempt to keep defaulted borrowers in their homes.

We recognize HMBS obligations at fair value with all changes in fair value recorded as a charge or credit to net fair value gains on loans in the Consolidated Statements of Operations and Comprehensive Income. We estimate the fair value of these loans using a process that combines the use of a discounted cash flow model and analysis of current market data to arrive at an estimate of fair value. The cash flow assumptions and prepayment assumptions used in the model are based on various factors, with the key assumptions being prepayment, borrower mortality, and discount rate assumptions.

Nonrecourse Debt, at Fair Value

We have elected to account for all outstanding nonrecourse debt at fair value. We issued nonrecourse debt securities, at fair value secured by loans made to real estate investors, which provides the Company with access to liquidity for the loans and ongoing management fees. The principal and interest on the outstanding certificates are paid using the cash flows from the underlying securitized loans, which serve as collateral for the debt.

We recognize our outstanding nonrecourse debt at fair value with all changes in fair value recorded as a charge or credit to net fair value gains on loans in the Consolidated Statements of Operations and Comprehensive Income. We estimate the fair value of these loans using a process that combines the use of a discounted cash flow model and analysis of current market data to arrive at an estimate of fair value. The cash flow assumptions and prepayment assumptions used in the model are based on various factors, with the key assumptions being prepayment, borrower mortality, and discount rate assumptions.

We use various internal financial models that use market participant data to value these loans. These models are complex and use asset specific collateral data and market inputs for interest and discount rates. In addition, the modeling requirements of loans are complex because of the high number of variables that drive cash flows associated with the loans. Even if the general accuracy of our valuation models is validated, valuations are highly


135


Table of Contents

dependent upon the reasonableness of our assumptions and the predictability of the relationships that drive the results of the models. On a quarterly basis, we obtain external market valuations from independent third party valuation experts in order to validate the reasonableness of our internal valuation.

Business Combinations and Goodwill

Acquisitions that qualify as a business combination are accounted for using the acquisition method of accounting. The fair value of consideration transferred for an acquisition is allocated to the assets acquired and liabilities assumed based on their fair value as of the acquisition date. Goodwill is recorded as the difference, if any, between the aggregate consideration paid for an acquisition and the fair value of the net tangible and identified intangible assets, net acquired under a business combination.

Under the acquisition method of accounting, we complete valuation procedures for an acquisition to determine the fair value of the assets acquired and liabilities assumed. These valuation procedures require management to make assumptions and apply significant judgment to estimate the fair value of the assets acquired and liabilities assumed. If the estimates or assumptions used should significantly change, the resulting differences could materially affect the fair value of net assets. We estimate the fair value of the intangible assets acquired generally through a combination of a discounted cash flow analysis (the income approach) and an analysis of comparable market transactions (the market approach). For the income approach, we base the inputs and assumptions used to develop these estimates on a market participant perspective which include estimates of projected revenue, discount rates, economic lives and income tax rates, among others, all of which require significant management judgment. For the market approach, we apply judgment to identify the most comparable market transactions to the transaction. Finite lived intangible assets, net, which are primarily comprised of customer relationships and technology, are amortized over their estimated useful lives using the straight-line method, or on a basis more representative of the time pattern over which the benefit is derived, and are assessed for impairment whenever events or changes in circumstances indicate the carrying value of the asset may not be recoverable.

Goodwill is not amortized, but is reviewed for impairment annually as of October 1st and monitored for interim triggering events on an ongoing basis. Goodwill is reviewed for impairment utilizing either a qualitative assessment or a quantitative goodwill impairment test. If we choose to perform a qualitative assessment and determines the fair value more likely than not exceeds the carrying value, no further evaluation is necessary. For reporting units where we perform the quantitative goodwill impairment test, we compare the fair value of each reporting unit, which we primarily determine using an income approach based on the present value of discounted cash flows, to the respective carrying value, which includes goodwill. If the fair value of the reporting unit exceeds its carrying value, the goodwill is not considered impaired. If the carrying value is higher than the fair value, the difference would be recognized as an impairment loss.

New Accounting Pronouncements

Refer to Note 2 - Summary of Significant Accounting Policies within the interim unaudited consolidated financial statements for a summary of recently adopted and recently issued accounting standards and their related effects or anticipated effects on the Consolidated Statements of Operations and Comprehensive Income and Consolidated Statements of Financial Condition.

Quantitative and Qualitative Disclosures about Market Risk

Our principal market risk is to interest rate risk, primarily to changes in long-term Treasury rates and mortgage interest rates due to their impact on mortgage-related assets and commitments. Changes in short-term interest rates will also have an impact on our warehouse financing lines of credit.


136


Table of Contents

Interest Rate Risk

Changes in interest rates will impact our operating segments as follows:

Portfolio Management


an increase in interest rates could generate an increase in delinquency, default and foreclosure rates resulting in an increase in both higher servicing costs and interest expense on our outstanding debt.


an increase in interest rates and market spreads may cause a reduction in the fair value of our long-term assets.


a decrease in interest rates may generally increase prepayment speeds of our long-term assets which would lead a reduction in the fair value of our long-term assets.

Originations (Mortgage, Reverse and Commercial)


an increase in prevailing interest rates could adversely affect our loan origination volume as refinancing activity will be less attractive to existing borrowers.


an increase in interest rates will lead to a higher cost of funds on our outstanding warehouse lines of credit.

Lender Services


an increase in interest rates will lead to lower origination volumes which would negatively impact the amount of title and insurance clients we are able to service and the number of title policies that we are able to underwrite.


lower origination volumes from an increase in interest rates may lead to a reduction in our fulfillment services as we process fewer loans for our clients.


an increase in interest rates may lead to fewer student loan applications that we are asked to process for our clients.

We actively manage the risk profile of Interest Rate Lock Commitments (“IRLCs”) and loans held for sale on a daily basis and enter into forward sales of MBS in an amount equal to IRLCs expected to close assuming no change in mortgage interest rates.

Earnings on our held for investment assets depend largely on our interest rate spread, represented by the relationship between the yield on our interest-earning assets, primarily securitized assets, and the cost of our interest-bearing liabilities, primarily securitized borrowings. Interest rate spreads are impacted by several factors, including forward interest rates, general economic factors, and the quality of the loans in our portfolio.

Consumer Credit Risk

We are exposed to credit risk in the event that certain of our borrowers are unable to pay their outstanding mortgage balances. We manage this credit risk by actively managing delinquencies and defaults through our servicers. We provide servicing oversight of our servicers to ensure they perform loss mitigation, foreclosure and collection functions according to standard acceptable servicing practices and in accordance with our various pooling and servicing agreements. We estimate the fair values on our outstanding mortgage loans using a combination of historical loss frequency and loss experience.

We principally sell our mortgage loans on a nonrecourse basis. We provide representations and warranties to purchasers of the loans sold over the life of the loan. Whenever there is a breach of these representation and


137


Table of Contents

warranties we will be required to repurchase the loan or indemnify the purchaser, and any subsequent loss on the loan will be borne by us. If there is no breach of the representation and warranty provision, we have no obligation to indemnify or repurchase the investor against loss. The outstanding UPB plus any premiums on the purchased loans represent the maximum potential exposure on outstanding representation and warranties that we are exposed to.

We estimate a reserve for losses on repurchased loans and indemnifications for future breaches of representation and warranties on any sold loans. This estimate is based on historical data on loan repurchase and indemnity activity, actual losses on repurchase loans and other factors.

Counterparty Credit Risk

We are exposed to counterparty credit risk in the event of nonperformance by counterparties to various agreements. We monitor the credit ratings of counterparties and do not anticipate material losses due to counterparty nonperformance.

Sensitivity Analysis

We utilize a sensitivity analysis to assess our market risk associated with changes in interest rates. This sensitivity analysis attempts to assess the potential impact to earnings based on hypothetical changes in interest rates.

The fair value of certain of our outstanding mortgage loans and related liabilities, MSRs, and certain investments are valued utilizing a discounted cash flow analysis. The primary assumptions we utilize in these models include prepayment speeds, market discount rates, and credit default rates.

Our total market risk is impacted by a variety of other factors including market spreads and the liquidity of the markets. There are certain limitations inherent in the sensitivity analysis presented, including the necessity to conduct the analysis based on a single point in time.


138


Table of Contents

The sensitivities presented are hypothetical and should be evaluated with care. The effect on fair value of a 25 bps variation in assumptions generally cannot be determined because the relationship of the change in assumptions to the fair value may not be linear. Additionally, the impact of a variation in a particular assumption on the fair value is calculated while holding other assumptions constant. In reality, changes in one factor may lead to changes in other factors, which could impact the above hypothetical effects.


     March 31, 2021  
     Down 25 bps      Up 25 bps  
     (in thousands)  

Increase (decrease) in assets


Reverse mortgage loans held for investment, subject to HMBS related obligations

   $ 31,560      $ (29,178

Mortgage loans held for investment, subject to nonrecourse debt:


Reverse mortgage loans

     63,332        (60,879

Fix & flip mortgage loans

     311        (215

Mortgage loans held for investment:


Reverse mortgage loans

     8,127        (7,435

Fix & flip mortgage loans

     179        (179

Agricultural loans

     169        (169

Mortgage loans held for sale:


Residential mortgage loans

     29,284        (37,274

SRL

     644        (948

Portfolio

     600        (588

Mortgage servicing rights

     (10,687      8,921  

Other assets

     3        (3

Derivative assets:


Forward commitments and TBAs

     101        (81

Forward MBS

     (32,543      37,455  

IRLCs

     14,202        (18,077


Total assets

   $ 105,282      $ (108,650


Increase (decrease) in liabilities


HMBS related obligation

   $ 28,800      $ (26,435

Nonrecourse debt

     22,126        (22,143

Derivative liabilities:


Forward MBS

     473        (545

Interest rate swaps and futures contracts

     23,163        (23,163


Total liabilities

   $ 74,562      $ (72,286


139


Table of Contents

BUSINESS

Unless the context otherwise requires, all references in this section to “we,” “us,” “our,” “Finance of America” or the “Company” refer to Finance of America Companies Inc. and its consolidated subsidiaries.

Finance of America Companies

Finance of America is a vertically integrated, diversified lending platform that connects borrowers with investors. We operate our Company with the goal of minimizing risk; we offer a diverse set of high-quality consumer loan products and distribute that risk to investors for an up-front cash profit and typically some future performance-based participation. We believe we have a differentiated, less volatile strategy than monoline mortgage lenders who focus on originating interest rate sensitive traditional mortgages and retain significant portfolios of mortgage servicing rights with large potential future advancing obligations. In addition to our profitable lending operations, we provide a variety of services to lenders through our Lender Services segment, which augments our lending profits with an attractive fee-oriented revenue stream.

Our differentiated strategy is built upon a few key fundamental factors:


We operate in a diverse set of lending markets—mortgage, reverse mortgage and commercial lending—that currently benefit from strong, secular tailwinds and are each influenced by different demand drivers, which we believe results in stable and growing earnings with lower volatility and lower mortgage market correlation than a traditional monoline mortgage company.


We seamlessly connect borrowers with investors. Our consumer-facing business leaders interface directly with the investor-facing professionals in our Portfolio Management segment, facilitating the development of attractive lending solutions for our customers with the confidence that the loans we generate can be efficiently and profitably sold to a deep pool of investors. We are in the moving business, not the storage business. While we often retain a future performance-based participation in the underlying cash flows of our loan products, we seek to programmatically and profitably monetize most of our loan products through a variety of investor channels, which minimizes capital at risk.


We distribute our products through multiple channels, and utilize flexible technology platforms and a distributed workforce in order to scale our businesses and manage costs efficiently. Our businesses are supported by a centralized Business Excellence Office (“BXO”), providing all corporate support, including IT, Human Resources, Legal, Risk, and Compliance. This platform enables us to be product agnostic, with the ability to focus our resources as the opportunity set evolves while not being overly reliant on any individual product. As borrower demands for lending products change, we are able to change with them and continue to offer desirable lending solutions.

Today, we are principally focused on residential mortgage loan products throughout the U.S., offering (1) traditional mortgage loans and reverse mortgage loans to consumers, and (2) business purpose loans to residential real estate investors. We have built a distribution network that allows our customers to interact with us through their preferred method: in person, via a broker, telephonically or digitally. Our product offering diversity makes us resilient in varying rate and origination environments, and differentiates us from traditional mortgage lenders. Our Lender Services segment supports a range of financial institutions, including our lending companies, with services such as title insurance and settlement services, appraisal management, valuation and brokerage services, fulfillment services, and technology platforms for student loans, consumer loans and home sharing services. In addition to creating recurring third-party revenue streams, these service business lines allow us to better serve our lending customers and maximize our revenue per lending transaction. Furthermore, our Portfolio Management segment provides structuring and product development expertise, allowing innovation and improved visibility of execution for our originations, as well as broker/dealer and institutional asset management


140


Table of Contents

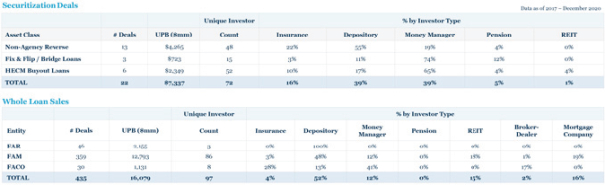
capabilities. These capabilities allowed us to complete profitable sales of our loan products via 10 securitization in 2020, demonstrating the high quality and liquidity of the loan products we originate, the deep relationships we have with our investors and the resilience of our business model in any market environment.


LOGO

We have two distinct advantages in our industry:

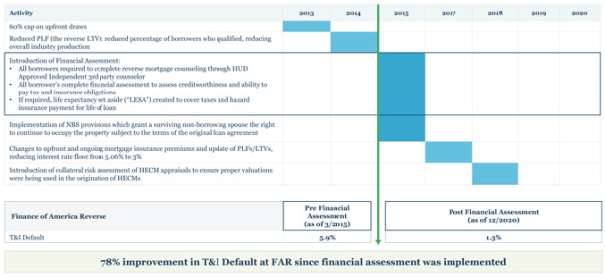
Product Innovation: Most lenders identify an investor (for example, Fannie Mae), and generate products for that existing investor. We also originate for existing investors when it is profitable to do so. However, our origination-to-investor platform collects data from both borrowers and investors, which gives us valuable insights into their unmet needs, allowing us to create innovative products that serve more of our customers’ lending needs over time. For example, at a time when HECMs insured by HUD were the only reverse mortgage loan product available to consumers, we developed a proprietary suite of reverse mortgage products, launched in 2014. We had the leading proprietary product in the market for approximately four years, and have continued as the market leader due to our ability to enhance and expand the product to meet consumer demand, while ensuring that we developed a viable exit strategy for the product through securitizations.

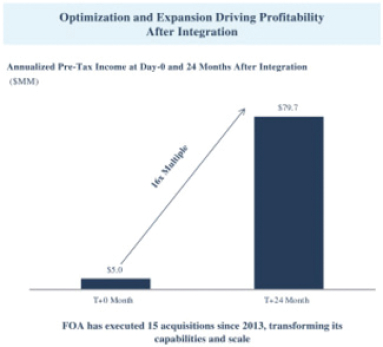
Strategic Business Acquisitions: Since our formation in 2013 through the year ended December 31, 2020, we have successfully acquired, integrated, expanded and optimized 15 companies in industries spanning from originations and lender services to capital markets. We have explored opportunities for many others. We only purchase a business after a careful analysis, focusing on (i) whether the business is strategic to our model, (ii) whether it has significant growth opportunities, and (iii) if we can add value to the acquired business, whether through financial strength, greatly expanded marketing capability, improved execution, quality and efficient shared services, or otherwise.

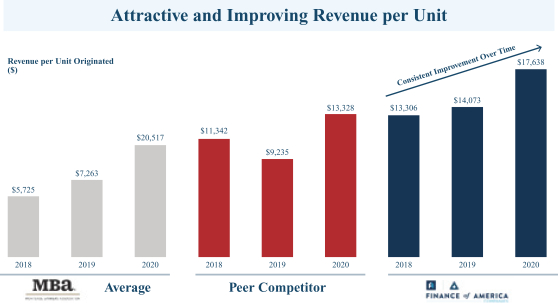
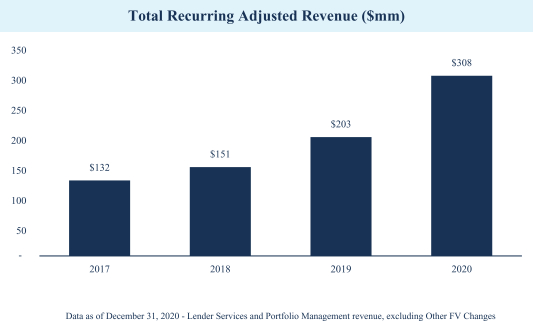
Our ability to efficiently support multiple lending products and focus resources to the products most needed in the market allows us to take advantage of market opportunities where they are presented and to counter cyclical fluctuations in earnings experienced by most traditional mortgage companies and monoline lenders. We demonstrated this capability in 2018, where we saw growth in earnings in our Reverse and Commercial segments during an exceptionally difficult time for the traditional mortgage market. As a result, between 2017 and 2018, we grew revenue by 1.4% and Adjusted EBITDA by 50.5%. From the period beginning January 1, 2017 through December 31, 2020, the compound annual growth rate of our total revenue was 32%. Additionally, our revenue per unit originated shows consistent improvement over time, growing from $13,306 in 2018 to $17,638 in 2020.


141


Table of Contents

LOGO

Our lending model is supported by a robust funding structure financed by an established and diversified mix of capital partners, which enables us to sell our loan production through various channels, including whole loan and correspondent loan sales through agency, GSEs, such as Fannie Mae and Freddie Mac and private channels, as well as through securitizations. We maintain and monitor our liquidity in order to fund our loan origination businesses, manage day-to-day operations and protect against unforeseeable market events. As of December 31, 2020, we had $5,038.7 million of committed or uncommitted loan funding capacity comprised of 33 facilities with 21 different counterparties. We had approximately $2.3 billion of liquidity sources as of December 31, 2020, comprised of (i) $233.1 million of cash and cash equivalents and (ii) $2.1 billion of undrawn warehouse lines of credit.

We believe that our culture, which seeks to promote the highest ethical standards, plays a significant role in producing superior outcomes not only for our customers but also for our business. We place a high value on honesty, transparency and integrity, which we believe has engendered trust from our customers, clients, lenders and investors. Our core values center around the mantra “customers first, last and always.” We aim to do the right thing for both our borrowers and investors every time.

Our Strengths

Platform Diversity Produces Stable, Growing Earnings.

We offer a broad variety of mortgage products, including agency, government, and non-conforming mortgages; HECMs and jumbo non-agency reverse mortgages; and single-family rental, portfolio rental, and fix-and-flip/bridge, for 1-8 family properties. This creates a complimentary portfolio of businesses with different macro drivers. As these macro cycles shift, our agile, distributed business model allows us to actively reallocate resources as the opportunity set shifts. For example, in March 2020 during the market disruption caused by COVID-19, we focused our resources on our traditional mortgage business, which saw a high volume of conforming mortgage loan originations due to the low interest rate environment, and decreased our emphasis on investor properties loans, where the secondary market had been disrupted. Due to this market disruption and fair value accounting adjustments, our commercial loan origination subsidiary was not in compliance with its profitability covenants with certain of its warehouse lenders for each of the first three quarters of 2020. While we have received waivers for all such instances, and we were in compliance with all of our financial covenants as of


142


Table of Contents

the end of December 31, 2020, no assurance can be given that we will be able to do so in the future. We also shifted quickly from our historical position of selling mortgages on a servicing-released basis, to retaining the servicing rights, due to low valuation of these rights in the market. Portfolio Management, acting through our Company’s registered investment advisor, Finance of America Equity Capital Management LLC (“FOAEC”), successfully raised third-party investor capital and closed two MSR funds for investments in MSRs, each managed by FOAEC as investment manager.

In addition, we have numerous sources of revenue which are largely independent from our lending businesses, such as Lender Services, Portfolio Management, and income from retained assets on our balance sheet. These diverse sources produce stable, recurring revenue. Our product and revenue diversity minimize the cyclicality which typically impacts traditional mortgage companies.


LOGO

Proven Ability to Innovate and Acquire.

Our ability to develop and launch proprietary products allows us to differentiate ourselves from our competitors and strengthens the value of our platform. Product development is primarily driven not only by staying current on macro secular trends, but also by gaining insights through our many contacts in the financial services industry. For example, our non-agency reverse products, or non-agency reverse mortgages, were developed and launched to address the gaps that we identified in the reverse HECM program offered by HUD – principally the absence of a reverse product suitable for senior borrowers who own homes with values in excess of the HECM lending limit. Since its launch in 2014, our non-agency reverse suite of products remain one of the most comprehensive suites of private reverse mortgages in the industry. We continue to invest in the development and launch of new product ideas and believe this will lead to significant growth opportunities for us.

Since our formation in 2013 through the year ended December 31, 2020, we have acquired fifteen businesses. The acquisitions have been strategic and opportunistic in nature. Each acquisition target is selected based upon (i) our analysis of the strategic value of the business to our model, (ii) the growth potential for the target, and (iii) the value we believe we can bring to the target’s business. Because of our size and the experience of our management team, we can provide value to the target companies through a combination of capital and reduced cost of funds, greatly expanded marketing and distribution capabilities, stronger compliance and risk


143


Table of Contents

controls, and financial and budgetary discipline. The combination of increased revenues and reduced costs proves beneficial to the acquired businesses. At the same time, the acquired businesses provide diversity to our revenues, and often provide opportunities for synergy between our businesses.


LOGO

One example of our success with this strategy is the acquisition of B2R Finance in 2017. We acquired a business with significant operating losses in the two years prior to acquisition. We first brought in new management. Management redirected the company’s focus to its core competency, which was making loans to investors in residential real estate properties, while reducing extraneous expenses. We restructured all low-margin products, leveraging our capital markets execution abilities. We acquired a complementary business which specialized in the fix-and-flip product, integrated the company into our BXO services, and instituted a culture of financial accountability. For the year ended 2016, B2R Finance incurred a loss of $33.2 million and subsequently in the year ended 2018 turned a profit of $15.2 million.

Limited Capital Investment Required to Support Growth.

We seek to run our Company on a model which allows for approximately 80% of the income we generate to be available for reinvestment, in the form of acquisitions, strategic asset portfolio growth, and product innovation, or for distributions to owners. While we hold a portion of our loans for investment, we seek to retain minimal credit risk; the majority of the assets on our balance sheet are working capital, assets which are in the process of being sold to a third-party investor or assets held in non-recourse transactions which are shown on balance sheet for GAAP accounting purposes but have little to no credit risk. This model gives us flexibility when we see opportunities in the marketplace to earn outsized returns. We achieve this by maintaining financing options for all assets with diversified counterparties including international, domestic and regional banks, private equity investors, hedge funds, insurance companies and other business entities. We manage interest rate and spread risk through frequent securitizations and whole loan sales. We have very deep and liquid take-out markets in the form of nearly 100 institutional investors in the assets we sell or finance in the capital markets. Our direct relationship with these investors contributes to our ability to quickly turn over our balance sheet across all of our asset classes, thereby allowing us to maintain a capital-light structure.


144


Table of Contents

Highly Experienced Management Team with a History of Value Creation.

As of December 31, 2020, our six named executive officers have been working in the financial services industry for at least 15 years, with an average of 26 years of experience in financial services. Our executive team has many years of experience at some of the most well-known companies in our industry. In addition, four of our six named executive officers have been involved with the Company, or one of its acquired businesses, for at least five years, and most of them have worked together for ten years or more. This has resulted in a cohesive team that has provided leadership through multiple financial and political cycles and events of global impact, garnering important lessons along the way. Their diverse backgrounds and experience, coupled with a long history of professional relationships and mutual respect, have come together to build a truly exceptional management team.

Our operations across all business lines are supported by our centralized shared services, BXO, which allows us to provide the highest quality services in information technology, human resources, risk and quality control, internal audit, finance, accounting, legal and compliance at extremely competitive costs. Our corporate load factor, which is calculated as the aggregate shared general and administrative expenses divided by total company headcount, was 34% less than industry standard for large independent mortgage bankers (Source: Spring 2020 MBA and Stratmor PGR). At the same time, we believe the quality of our BXO services is very high. Because of the size of our organization, we are able to hire and retain more sophisticated BXO employees than smaller companies focusing only on mortgage lending, although the smaller companies bear the same burdens for compliance with laws and regulations, face the same risks when entering into vendor relationships, and face the same risks for information security and technology failures.

Our Strategic Vision

Our strategic vision begins with focus on the customer and continues to evolve with the goal to create and innovate, thus enabling us to fulfill customer needs and grow our market share over time. Our objective is to grow by expanding our product offerings, strategically diversifying into business lines which are complementary to our Company’s vision and further, we aim to grow organically by being well-situated to capitalize on the macroeconomic market trends. In order to maximize our profitability and attract customers, we plan to continue to invest in our technology which we believe will help us create new products with attractive terms to offer to our customers and also build on the efficiency of our business segments to increase our Company’s overall profitability. With large addressable markets for our current businesses, we have forecasted modest and achievable market share increases for each of our business segments.

Current Businesses: Long Runways for Organic Growth.

We operate in large and growing markets where we believe there are significant and distinct structural tailwinds, which should lead to a long runway for organic growth.

Mortgage

The mortgage market is the largest consumer lending market in the United States and our mortgage business is well-positioned to take advantage of opportunities in both the refinance market as well as the purchase money mortgage market through our multiple distribution channels.


Analysts expect the low mortgage interest rate environment to remain for an extended period, spurring elevated origination volume to continue. The low interest rate conditions have created a massive incentive for homeowners to refinance their mortgages. Based on data from Bloomberg and eMBS, almost 67% of the $11 trillion of mortgages outstanding as of February 2021 are “in the money” and would benefit from refinancing. Furthermore, the industry does not have the capacity to process this unprecedented level of demand and as a result, primary-secondary spreads have widened significantly since April 2020, creating a highly profitable rate and term refinance market opportunity for mortgage lenders.


145


Table of Contents
   

We anticipate increased demand for single-family homes, both as a result of new household formation, and the relocation demand resulting from COVID-19 and the move to “work from home.” Individuals working from home are seeking larger spaces and are not tied to the corporate location. Demand for purchase money loans is rising and expected to continue to rise as a result.


With record volumes, we are focusing on operational excellence — we achieve excellent turn times while locking, funding and delivering closed loans resulting in wider profit margins. FAM is rated “Average” by Moody’s as an originator of conventional, conforming residential mortgage loans. The evolution of our Cloud Virga point-of-sale, which is a third-party digital mortgage platform, is expected to further reduce the time from application to closing.

Reverse


The reverse mortgage market is an underserved market where we have significant potential to grow our customer base. Based on U.S. census data, seniors are expected to reach 20% of the population in the U.S. and further based on various data sources available to the Company, there is over $8 trillion dollars in senior home equity, however less than 2% of seniors have a reverse mortgage. Given the majority of seniors’ total net worth is tied to their home equity, we believe this population will seek alternative sources of income, such as their home to help fund their retirement. We believe through continued product innovation and improved borrower experience, we will be able to achieve increased adoption and expansion of the reverse mortgage segment. As the U.S. population of seniors continues to increase, we are investing in diversifying our products and focusing on customer service and servicing as a core part of our business. Our strategy is to originate loans that are customized to borrower needs and further, we provide a concierge team to support the borrower throughout the life of the loan to create a positive borrower experience that will help us retain our customers as well as attract new customers.

Commercial


The market for business purpose investor loans will benefit from macroeconomic trends such as millennial demand for new homes whether to purchase or rent. In addition, the aging U.S. housing inventory will require renovation and rehabilitation especially in light of other contributing factors such as climate change and natural disasters. We believe this will lead to an increase in real-estate investors looking for financing to buy and rehabilitate homes with the goal of either selling or renting those newly refurbished properties and our commercial business, with multiple channels to source loans, will be well-positioned to take advantage of such tailwinds and opportunities.

Lender Services


Our strategy for our lender service businesses is to expand third-party clients and further adopt such services within our Company’s businesses to produce recurring revenue that will continue to grow over time. Our service businesses also allow us the opportunity to create strong relationships with banks, credit unions and other financial institutions which can potentially be beneficial in the future for our other business lines.

Continue to Selectively Pursue Strategic Acquisitions.

We have built our Company thoughtfully, focusing on strategic and opportunistic business acquisitions with successful integration to create a solid foundation. We anticipate that we will continue to acquire strategically in areas that are complementary to our businesses, where we see an innovative product or accretive market opportunity that aligns with our Company’s vision and where we have the potential to create efficiencies


146


Table of Contents

and add growth which will lead to optimized earnings. Our acquisition strategy is based upon a detailed understanding of the business as it exists today, determining whether it is a strategic fit for us, forecasting realistically the growth potential for that market, and understanding how we can enhance the value of that business. Growth potential is forecast both by identifying significant tailwinds (increased demand, limitations on supply) and relevant headwinds (for example, regulatory concerns or reputational risk). We have a track record of increasing the profitability of acquired businesses significantly by provision of our cost efficient BXO services (including a disciplined budget process and forecasting of revenues), providing financial strength, and providing broad marketing opportunities. If a target business meets the parameters, our experienced team can methodically complete the acquisition, integrate the business in the Company, and immediately begin to reap the benefits of the acquisition.

Continue to Focus on Product Innovation.

At a time when HECMs insured by HUD were the leading reverse mortgage loan product available to consumers, we developed a proprietary suite of reverse mortgage products, launched in 2014. Our non-agency reverse mortgage was built for borrowers for whom the HECM product will not serve their needs (for example, borrowers whose age and property value would dictate a loan amount in excess of the HECM loan limits). We were one of the few proprietary product lenders in the market for approximately four years, and have continued as the market leader due to our ability to enhance and expand the product to meet consumer demand, while ensuring that we developed a viable exit strategy for the product.

In connection with each of our lending businesses, our product development team has used performance data, customer feedback, and trends in investor demand to continue to refine our existing loan products and create new products for our related businesses. For example, with respect to our commercial business, the investor-owned residential fix-and-flip and rental markets are developing and therefore, we use both feedback from consumers (in this case, the real estate investors) and from the investor market (securitization and whole loan investors), to adjust our guidelines and terms to create an ever-improving product, from both points of view.

We continue to explore other lending opportunities that have growth potential, often in underserved markets (such as in agricultural lending and retirement lending), and align those with our overall strategic objectives.

Our Segments

We conduct our business through five distinct segments: Portfolio Management, Mortgage Originations, Reverse Originations, Commercial Originations and Lender Services. Our operating subsidiaries, including FAM and FAR, are indirect subsidiaries of FoA, which means that FoA holds its equity interests in each of these entities through one or more holding companies (as opposed to a subsidiary in which FoA directly holds such entity’s equity interests).

Portfolio Management (PM)

At its core, our platform allows us to take insight from our borrowers on what products they need and, through our Portfolio Management business, we are able to match that borrowing demand with a corresponding investing demand from institutional investors. Using our captive broker-dealer and registered investment advisor, we have the ability to convert the lending products we manufacture into the preferred investment form for our investors, be it whole loans, rated CUSIPs, un-rated CUSIPs, structured financings, JVs, or any other form that works for investors. This creates a virtuous cycle where we continuously deliver to both our borrowers and our investors, which gives us valuable insights into their unmet needs, builds valued relationships, and enables us to realize the opportunities within each of our growing markets.


147


Table of Contents

PM provides critical capital markets intelligence and engages in a strong, ongoing partnership with the leaders of our loan originations businesses and executive management to identify opportunities that marry unmet consumer demand with investor appetite. PM is intimately involved in every step of new product development, including servicing and disposition, which may include whole loan sales (with servicing retained or released), securitization, or holding assets for investment.

PM is focused on providing product development, loan securitization, loan sale, risk management, asset management, advisory, valuations and servicing oversight services to our Company as well as third parties. Our PM team is primarily based out of St. Paul, Minnesota and New York, New York. As a key part of the vertical integration of our business, PM serves as the connector between the customers and the investors to create opportunities and minimize risk. Our experienced team has direct, long established relationships with investors giving us insight into pricing which in turn allows us to innovate and offer exceptional products to our customers. We work alongside the business leaders of our lending companies and our executive team to structure products which are designed to fulfill customer needs with pricing at profitable levels for efficient capital markets execution. We have developed a strong track record of doing successful capital markets transactions through our securitizations and whole loan sales to financial institutions, the GSEs and U.S. government agencies. In cases where we believe it’s appropriate and opportunistic, we retain assets on balance sheet as short term and long-term investments as a source for growth and recurring earnings. In cases where we believe it’s appropriate and opportunistic, we retain assets on balance sheet as short term and long-term investments as a source for growth and recurring earnings. We may not manage these investments to be interest rate neutral. MSRs, for example, may not be fully hedged as we have exposure to interest rates in our lending segments. Likewise, the durations of our assets and liabilities related to our securitizations may be different, resulting in interest rate exposure. Additionally, the fair value of our retained assets may fluctuate based on observed changes in asset yields by market participants. These factors both could result in fair value changes in the portfolio over time, specifically when looking at one asset. Where possible, management applies reasonable hedge strategies to help mitigate the impact of fair value changes. Being able to reduce expenses and use complimentary assets within the portfolio as a hedge to each other and also our lending segments provides a competitive advantage in the market. See “Risk Factors—Risks Related to Our Business and Industry—We use estimates in measuring or determining the fair value of the majority of our assets and liabilities. If our estimates prove to be incorrect, we may be required to write down the value of these assets or write up the value of these liabilities, which could adversely affect our business, financial condition and results of operations” for additional discussion.

PM analyzes the takeout economics and risk for each execution strategy on a constant basis using analytical tools and processes. There are three primary disposition strategies for originated whole loans:


Securitization;


Bulk Sale (servicing retained or released, or co-issue); and


Flow Sale (servicing retained or released).


LOGO

Whole Loan Sales includes Bulk Sales and Flows Sales, does not include loans to agencies.


148


Table of Contents

Once the disposition strategy for a specified set of loan assets is determined, PM executes on that strategy and follows through. PM primarily operates through our Incenter companies. Our registered broker dealer, Incenter Securities Group LLC, acts as placement agent or initial purchaser in securitization transactions (including securitizations sponsored by our Company as well as third party sponsors). Our registered investment advisor, FOAEC, provides advisory services to our enterprise as well as third party funds, in particular in connection with the reinvestment strategies for securitizations, loan sales and acquisition of MSRs. Incenter LLC (“Incenter”) provides our lending businesses with services to assist them with execution of our securitizations and whole loan sales, including in connection with the selection and pooling of our HECM loans for Ginnie Mae securitizations.

PM actively manages our originated loan portfolio, as well as strategic acquisitions or retention of non-operating assets, such as our crop loans and mortgage servicing rights. Our retained asset portfolio consists of two categories of assets: short-term assets held for immediate sale, such as our proprietary whole loans and securities that are held for sale and loans bought out from HECM securitizations prior to assignment to Ginnie Mae, and long-term assets held for value creation such as mortgage servicing rights, securitized HECM loans, assets backed by our securitized proprietary whole loans (including retained securities and residual interests in securitization trusts), and whole loans (including crop loans) not yet securitized.

During tough market conditions, PM shows its strength through durable and agile execution and is a key factor in our Company being cycle resistant. During the volatility in the capital markets due to COVID-19, our team was able to successfully complete nine securitization offerings from the period beginning in March 2020 through December 31, 2020 in three different asset classes which directly amounted to $2.9 billion in liquidity during this period.

In March 2020, our team working together with the business leaders of FAM made the decision to strategically retain our MSRs. As of December 31, 2020, this strategy has led to approximately $22.3 billion in retained MSR. PM, acting through our Company’s registered investment advisor, FOAEC, successfully raised third-party investor capital and closed two MSR funds for investments in MSRs, each managed by FOAEC as investment manager.

Where Finance of America has retained servicing or master servicing responsibilities, PM’s Servicing Oversight team provides disciplined supervision of the subservicers, including data monitoring and oversight of the subservicer’s financial condition and performance. The Servicing Oversight and Asset Management Team is comprised of approximately 50 full-time employees, supported by our BXO partners in Transaction Management, Legal and Compliance, and Risk Management. This team utilizes a data-driven oversight process and a team of very experienced, hands-on servicing professionals to ensure that our subservicers are meeting their obligations, and where appropriate, to actively handle customer needs, in particular in cases of default or hardship to offer solutions, modifications and workouts to assist our customers in their time of need and also efficiently manage the related loans for our companies and investors.

Mortgage Originations

Our traditional mortgage business, FAM, is a leading nationwide residential mortgage loan originator with a broad offering of products and a wide, multi-channel distribution network. For the year ending December 31, 2020, FAM originated 87,652 loans with an aggregate unpaid principal balance of approximately $29.1 billion.

Headquartered in Horsham, Pennsylvania, FAM operates in all 50 states and the District of Columbia. We offer a broad array of products to meet the residential lending needs of our customers including conforming mortgages, government mortgages insured by the FHA, VA and UDSA, non-conforming products such as jumbo mortgages, non-qualified mortgages and closed-end second mortgages. FAM is rated “Average” by Moody’s as an originator of conventional, conforming residential mortgage loans.


149


Table of Contents

In 2015, Finance of America acquired Gateway Funding Mortgage Services, L.P. and subsequently the entity was converted to a limited liability company and renamed as Finance of America Mortgage LLC. Subsequently, FAM acquired certain assets and operations of three other mortgage originators to expand FAM’s geographic presence and channel distribution. Over the last six years, we have focused on integrating our acquisitions into a unified traditional mortgage company with emphasis on maintaining and building a strong employee base that not only possesses the skills required to serve our customers but also the passion and energy that embraces our culture of innovation and service. Our origination business is robust and provides refinance and purchase opportunities to new and existing customers through three distinct channels: distributed retail, direct-to-consumer, and third-party originations or TPO, which includes wholesale and correspondent. As of December 31, 2020, FAM employs approximately 3,000 employees of which over 1,100 are productive sales members. According to Inside Mortgage Finance, we were the 18th largest non-bank home loan lender for the year ended December 31, 2020.


LOGO

Mortgage Origination Channels

The retail origination channel is made up of a nationwide network of branches, with local licensed mortgage loan originators who solicit loan applications primarily through personal, local relationships and direct contact with borrowers. The retail origination channel offers a full suite of lending products, including refinances.

FAM’s consumer direct origination channel develops customer leads through nationwide marketing, primarily through the internet. Licensed mortgage loan originators and loan production services are strategically located across the U.S. to provide appropriate service hours in every time zone. Like the retail origination channel, consumer direct provides the full suite of lending products; however, the product mix in consumer direct skews towards refinancing. Leads are sourced through third-party lead generators, primarily on the internet. FAM consumer direct does not engage in outbound calling of any leads who are not current FAM customers.

While we plan to grow both the retail origination and consumer direct channels incrementally, we anticipate third party originations to be the primary growth driver for FAM going forward. This channel is comprised of Wholesale (broker originations), Non-Delegated Correspondent (where individual loans are underwritten by FAM, but originated by the correspondent), and Delegated Correspondent (where select, high-quality lenders are permitted to underwrite loans and sell them to FAM in flow or bulk loan sales). To facilitate this growth, we have added an East Coast Operations Center, and added sales staff across the country.

Reverse Originations

Overview

Through our reverse mortgage company, FAR, we originate, acquire, service, invest in and manage reverse mortgage loans. A reverse mortgage loan is a secured, non-recourse loan that enables homeowners, generally 62 years and older, to convert the equity in their home into cash in the form of a lump sum payment, a


150


Table of Contents

line of credit, a series of monthly advances, or a combination of the three methods. Our reverse origination products can be broken out into two main categories: HUD’s HECMs, which are reverse mortgage loans that are insured by the FHA; and our proprietary jumbo reverse mortgage loans or non-agency reverse mortgages. Our goal is to offer a variety of mortgage products to provide older Americans with more affordable options to support their financial needs during their retirement years and to make it easier to age in place.

In 2013, Finance of America acquired Urban Financial Group, Inc., and subsequently the entity was converted to a limited liability company and renamed Finance of America Reverse LLC. Headquartered in Tulsa, Oklahoma, FAR is licensed to originate reverse mortgage loans in all 50 states, Washington D.C. and Puerto Rico. We have a long running track record with respect to reverse product offerings to customers, in particular with our non-agency reverse product, which was launched in October 2014. We have continued to expand on our proprietary products which provide optionality for the customers to receive future draws after an initial upfront disbursement, either through monthly installments that span over a fixed number of years or as an open line of credit for a fixed number of years.

Reverse Origination Channels

FAR’s products are offered through retail channels and third-party originations, which includes wholesale, correspondent, and principal/agent. FAR has been a leading wholesaler in the reverse mortgage market since our acquisition of Urban Financial Group, Inc. in 2013, allowing us to get new products widely distributed to market very quickly.


LOGO

Fundamentals of Reverse Mortgage

With a reverse mortgage loan, unlike a traditional mortgage loan, the borrower does not make ongoing cash payments of principal or interest. Rather, with a reverse mortgage loan, payment of interest and repayment of principal is not triggered until a maturity event. The loan balance of a reverse mortgage loan accrues at a fixed or floating rate. The borrower continues to own and live in the home and remains responsible for maintaining the home in good repair and paying real estate taxes and property insurance premiums, as applicable, for the life of the loan. We acquire or originate our reverse mortgage loans and retain servicing for our reverse mortgage loans once they are securitized through Ginnie Mae or private securitizations. We have established a borrower care team who, in conjunction with our Finance of America Foundation, has built a nationwide database of charitable and public assistance resources that are used to cure underlying borrower hardships and mitigate or avoid default events tied to the related mortgages. We believe our involvement with a reverse mortgage loan throughout its life cycle from origination to maturity and ultimate payment gives us the ability to deliver a greater value proposition to our customers, control asset quality and create an ongoing source of income. Through our fully integrated business model, we earn net interest income from our portfolio of reverse mortgage assets.

HECM Regulation Changes

Following the 2007–2009 financial crisis, many large banks exited the reverse mortgage market due to revisions in bank regulatory requirements which led many banks to re-evaluate their mortgage risk and partly


151


Table of Contents

also due to concern that they risked damage to their reputations if they foreclosed on seniors who defaulted on their HECM loans. Since 2013, the FHA has made significant enhancements to the HECM product to protect borrowers, their respective families and estates. Specifically, the introduction of the financial assessment (which, among other things, requires all borrowers to complete mortgage counseling and requires the creation of a life expectancy set aside to cover taxes and insurance payments for the related mortgaged property for the life of the loan), was designed to protect borrowers by educating them regarding the reverse product and by requiring loan features to protect against default. Further, non-borrowing spouse (NBS) provisions were implemented to protect the mortgagor’s intent for the use of mortgaged property by granting a surviving non-borrowing spouse the right to continue to occupy the property subject to the terms of the loan agreement.


LOGO

Comparison of Non-Agency vs. Agency (“HECM”) Reverse Mortgages

The non-agency reverse product was developed by FAR as a high-quality, lump sum (fully drawn), fixed-rate product for borrowers 62+ years of age who are U.S. citizens or have resident alien status. Beginning in November 2019, FAR introduced the non-agency reverse fixed-rate product for borrowers 60+ years of age in certain jurisdictions. A non-agency reverse mortgage loan is typically made in the following cases: (i) for maximum loan amounts in excess of the HECM maximum loan amount limit of $822,375, (ii) when the borrower does not qualify for HECM but does qualify for a non-agency reverse mortgage (for example, a borrower who is 60 or 61 years old who would not qualify for HECMs), and/or (iii) the borrower receives or will receive a greater benefit from the non-agency reverse mortgage when compared to a HECM loan. The maximum loan amount under the non-agency reverse mortgage program is generally $4 million. As of December 31, 2020, non-agency reverse mortgage products are available in 25 states and the District of Columbia. Generally, non-agency reverse mortgages have a higher principal balance, a higher interest rate, no upfront or ongoing mortgage insurance fees and lower loan-to-value ratios compared to HECM loans. The non-agency reverse mortgage underwriting guidelines generally follow the HECM underwriting principles with overlays to mitigate the risk of higher balance loans. Further, non-agency reverse mortgages are underwritten by direct endorsement underwriters with a minimum of 5 years underwriting experience and at least 10 years of experience in the mortgage industry.

There are several common features of HECMs and non-agency reverse mortgages. Borrowers must generally be age 62 or older (with respect to non-agency reverse mortgages, 60 for certain states and certain products), and available proceeds are determined based on age of youngest borrower. There are fixed and adjustable interest rate options for both products. In order to be eligible for a reverse mortgage loan, the mortgaged property must be the primary residence of the borrowers. All borrowers are required to complete


152


Table of Contents

independent third party provided reverse mortgage counseling, and a financial assessment is performed on all borrowers to verify their ability to pay property taxes and homeowners’ insurance premiums. A reserve known as the life expectancy set aside (LESA) is established as needed for individual mortgage loans to cover taxes and hazard insurance to the extent required following the related borrower’s financial assessment.

Commercial Originations

Finance of America Commercial LLC (“FACo”) makes loans secured by 1-8 family residential properties which are owned for investment purposes, either long-term rentals (“SFR”) or “fix-and-flip” properties which are undergoing construction or renovation (“F&F/Bridge”). These loans feature higher interest rates, and lower loan-to-value ratios, than comparable owner-occupied mortgage collateral. Loans are originated both by retail loan officers and by mortgage loan brokers. As a lender to the investment community, FACo has significantly less regulatory burden than the consumer lending businesses. For the year ended December 31, 2020, FACo originated approximately 3,200 loans with an aggregate unpaid principal balance of approximately $855 million.


LOGO


  *

Construction Loans represent our F&F/Bridge product; Investor Loans represent our SFR and Portfolio Rental product; and Agricultural Loans represent our agricultural loan products.

Following the strategic acquisition of B2R Finance and the assets of another private money lender to real estate investors in 2017, FACo has significantly expanded and grown its predecessors’ business, focusing on creating growth in the investor-focused residential lending market. Headquartered in Charlotte, North Carolina, FACo is licensed to originate investor purpose loans, or exempt from licensing, in 46 states. FACo has robust data and technology with a proprietary customer relationship management database of over 100,000 prospective investor clients and access to more than 50,000 real estate partners, brokers, asset managers, each of which it uses to source new mortgage loans. The employees of FACo operate primarily out of three national centers located in California, Illinois, and North Carolina.

Our business purpose loans to residential real estate investors are non-agency mortgage loans sold primarily as whole loans to institutional whole loan buyers or securitized in FACo sponsored securitization transactions. In connection with our investor purpose mortgage securitizations (and many of the whole loan transactions), FACo continues to act as servicer and/or asset manager with respect to the mortgage loans. In this way, similar to FAR and FAM, FACo stays involved with its originated mortgage loan throughout its life cycle from origination to maturity and ultimate payment which gives us the ability to retain a strong customer base and also gives us insight into customer needs which in turn drives our product development efforts. Due to the nature of the product, FACo has many repeat customers.

Our Commercial Loan Products and Origination Channels

Our SFR and Portfolio Rental products are long term products with loan terms ranging from five (5) years to thirty (30) years. Our Fix & Flip loans are short term products with loan terms ranging from 12-18


153


Table of Contents

months. Single rental loans (SRL) and Fix & Flip loans are recourse to the related borrowers and if the borrowers have limited assets or are special purpose entities, full recourse to the related sponsors/guarantors, which may be institutional entities or personal guarantors. Our Portfolio Rental loans are recourse to the borrowers and are generally non-recourse loans to the sponsor/guarantor, with limited bad act guarantees.

We engage in targeted marketing efforts through our internal team members and through digital marketing, social media and paid advertising. We are also committed to developing and maintaining ongoing relationships in the real estate investor community, and developing leads from a variety of sources, including public records. Prospective clients identified in our marketing efforts are seamlessly integrated into our customer relationship management database. Our customer relationship management database and wholesale lending platform allows us to take in marketing leads and focus our efforts on the right customers for our lending platform. These platforms also provide robust reporting metrics that will allow us to measure the success of our marketing efforts.

Impact of COVID-19 on SFR and Fix & Flip

Like many of our peers in the marketplace, our commercial business was adversely impacted by COVID-19 and we paused originations in mid-March. We were able to complete a successful strategic securitization transaction in the second quarter of 2020, and while our cost of funds increased from what we expected, we were able to preserve the value of our investments by not having to sell our assets at unattractive prices. We resumed commercial business originations in May 2020.

Lender Services

Our Lender Services segment is primarily a fee for service business comprised of multiple businesses under the Incenter LLC umbrella. Incenter was formed in 2016 to develop a business focused on services for lenders and other financial institutions. Through strategic acquisitions between 2016 and 2020, the business services enterprise is now focused on providing a variety of business-to-business solutions, including:


Title Insurance;


Title Agency;


Appraisal Management Services;


Valuation and trading of MSR;


Whitelabel SaaS and outsource consumer loan platform;


Back office, fulfillment and support functions; and


Insurance services.

In addition to offering these services to third parties, Incenter is a vendor to Finance of America for Title, MSR advisory, Appraisal Management and offshore fulfillment. This relationship allows the company to capture more of the revenue normally paid to an independent third party in the processing of a loan. Finance of America accounts for 26% of Incenter’s revenue, their 1300+ customers providing the rest.


154


Table of Contents

LOGO

Boston National Title LLC (“BNT”) was founded in 2006 and has grown into a leading independent title services provider in the U.S. Based in Charlotte, North Carolina, BNT and its subsidiaries are licensed as a title agency in 42 states and the District of Columbia. BNT offers comprehensive title services across all residential and commercial channels. More than processing, BNT turns its whatever-it-takes attitude to solving industry and client problems into a continuous series of creative and innovative solutions that optimize productivity, financial performance, and the borrower experience. BNT has excelled especially in developing title work for institutional clients and has General Service Agreements with 5 of the 15 largest U.S. banks by assets, the largest correspondent aggregator in the country, and one of the two largest investors or residential mortgages in the U.S.; it has achieved this result by providing centralized, nationwide title agency and settlement services featuring customized client reporting and a single point of contact for escalations.

Agents National Title Insurance Company (“ANTIC”) was founded in 2006 and is a full-service national title insurance provider serving independent title agents across the U.S., including BNT. Headquartered in Columbia, Missouri, ANTIC is licensed to provide residential and commercial title insurance in 45 states and the District of Columbia. Reinsurance is provided by a Lloyds of London syndicate. Flexible and innovative, ANTIC is the underwriter that goes above and beyond to be a business partner to its title agents.

Incenter Mortgage Advisors (“IMA”) provides analytics, risk management tools and transaction services for the purchase, sale and portfolio management of mortgage servicing rights and whole loans. Based in Denver, Colorado, IMA has provided services in connection with the purchase and sale of MSRs and whole loans since its inception in 2001. IMA manages on average approximately 1,500 portfolio trades annually. IMA maintains a strongly integrated team of highly skilled and experienced personnel with one common goal: to create and maintain optimal execution in any given market environment while facilitating a smooth transaction for our clients.

Campus Door operates in the private student loan industry serving as a critical hub connecting all the parties involved in making education loans. Founded in 1995, Campus Door pioneered the student loan origination platform, and has processed over $35 billion in loans, lines of credit and refinancing applications and has served nearly 2 million loan applicants to date. Its state-of-the-art dynamic decisioning engine allows lenders and higher education institutions to serve the financial needs of undergraduate and graduate students from all walks of life—not just those with high credit scores and wealthy co-signers. Within this ecosystem, Campus Door streamlines the loan production process, allowing lenders such as banks, credit unions, private equity-backed online lenders and universities to launch custom-branded, compliant education lending programs quickly and cost-effectively. Based in Carlisle, Pennsylvania, Campus Door’s centralized call center provides clients with


155


Table of Contents

a host of added-value customer support and marketing services. Campus Door currently serves a national customer roster of more than 300 banks, credit unions, non-bank lenders and higher education institutions.

Incenter Appraisal Management (“IAM”) is a national appraisal management company focused on providing the highest quality property valuations to lenders and homeowners. Based in Fort Washington, Pennsylvania, IAM is licensed to conduct services in 47 states. IAM offers a full suite of appraisal products and services that support all loan types. With a growing network of more than 6,000 independent professional appraisers nationally, IAM’s differentiator is that it will only assign local appraisers to orders to ensure the right person with the relevant knowledge and experience is on the job. We also provide our network of appraisers with the support and information they need to ensure integrity and accuracy of the appraisals which are often required within tight time frames. We believe that we attract and retain top appraisers through our attractive and fair compensation model. IAM uses the latest appraisal management technologies to manage appraiser panels and performance, and enable streamlined asset and data exchanges with our clients.

Incenter Solutions is a business processing organization (BPO) that provides a wide array of fulfillment services, including loan origination support services, corporate services, IT operations and vendor-to-vendor services. With operations based in Manila, Philippines, Incenter Solutions’ highly flexible and experienced pool of over 800 full time professionals enables us to align the right resources for delivering the highest levels of service at the most efficient cost. This business began operations in 2007, and its assets were acquired by Incenter in 2015.

Competition

We compete with third-party businesses in originating traditional, reverse and commercial mortgages, including other bank and non-bank financial services companies focused on one or more of these business lines. Our competitive position varies by product. Traditional mortgages, for example, are widely available, and the market is highly fragmented. Our retail distribution model makes us very competitive in some local markets for purchase money loans, and it is anticipated that growth in our TPO business will also fuel growth in the purchase money market. In Reverse Originations, we are and have been a market leader since banks exited the space over 10 years ago. The number of Ginnie Mae issuers in the reverse space is quite limited, and the number of lenders of non-agency reverse mortgage is even smaller. Commercial Originations is also less competitive than traditional mortgages, although there are other lenders in this space. There is also significant competition in all facets of our Lender Services businesses.

Competition in our industry can take many forms, including the variety of loan programs being made available, interest rates and fees charged for a loan, convenience in obtaining a loan, client service levels, the amount and term of a loan, and marketing and distribution channels. Many of our competitors for traditional mortgage originations are commercial banks or savings institutions. These financial institutions typically have access to greater financial resources, have more diverse funding sources with lower funding costs, are less reliant on loan sales or securitizations of mortgage loans into the secondary markets to maintain their liquidity, and may be able to participate in government programs in which we are unable to participate because we are not a state or federally chartered depository institution, all of which places us at a competitive disadvantage. Fluctuations in interest rates and general economic conditions may also affect our competitive position. During periods of rising rates, competitors that have locked in low borrowing costs may have a competitive advantage. Furthermore, a cyclical decline in the industry’s overall level of originations, or decreased demand for loans due to a higher interest rate environment, may lead to increased competition for the remaining loans. Any increase in these competitive pressures could be detrimental to our business.

Intellectual Property

We use a combination of proprietary and third-party intellectual property, all of which we believe maintain and enhance our competitive position and protect our products. Such intellectual property includes


156


Table of Contents

owned or licensed trademarks, trademark applications, and domain names. While technology and intellectual property enhance our competitive position, given the nature of our lending business, patents, trademarks and licenses are not material to our operations as a whole or to any of our segments.

We enter into confidentiality, intellectual property invention assignment and/or non-competition and non-solicitation agreements or restrictions with our employees, independent contractors and business partners, and we strictly control access to and distribution of our intellectual property.

Cyclicality and Seasonality

The demand for loan originations is affected by consumer demand for home loans and the market for buying, selling, financing and/or re-financing residential and commercial real estate, which in turn, is affected by the national economy, regional trends, property valuations, interest rates, socio-economic trends and by state and federal regulations and programs which may encourage/accelerate or discourage/slow-down certain real estate trends. Our business is generally subject to seasonal trends with activity generally decreasing during the winter months, especially home purchase loans and related services. Our lowest revenue and net income levels during the year have historically been in the first quarter, but this is not indicative of future results.

Human Capital Management

As of December 31, 2020, we employed approximately 5,900 full-time employees in the United States and the Philippines. None of our employees are covered by collective bargaining agreements, and we consider our employee relations to be good. Our culture and technology has allowed many of our employees (including executives and mortgage loan officers and staff) to work in divergent locations. This has allowed us to recruit and hire top managers and executives, regardless of geography, and without spending valuable corporate capital relocating newly-recruited employees. Our investment in technology and culture paid off handsomely when COVID-19 caused the financial services industry worldwide to start working from home in mid-March 2020. Our staff, production and efficiencies continued without significant disruption.

Properties

We operate our business through four corporate offices, 290 Mortgage locations, 11 Reverse Mortgage locations, four Commercial locations, seven Portfolio Management locations and 32 lender services locations leased throughout the United States and our lender services segment operates one branch leased in the Philippines. Our principal executive offices are located at 909 Lake Carolyn Parkway, Suite 1550, Irving, Texas 75039.

We do not consider any specific location to be material to our operations. We believe that equally suitable alternative locations are available in all areas where we currently do business. In the opinion of our management, our properties are adequately covered by insurance.

Regulation

Our consumer-facing lending and ancillary businesses market and provide services through a number of different channels across the United States. We are subject to extensive regulation by federal, state and local authorities and a variety of statutes, rules, regulations, policies and procedures in various jurisdictions in the United States. If any of our loans to consumers are found to have been originated in violation of such laws, we could incur losses, which could adversely impact our results of operations, financial condition and business. Our Philippines branch does not conduct any consumer-facing activities.

We are required to comply with numerous federal and state consumer protection and other laws, including, but not limited to:


restrictions on the manner in which consumer loans are marketed, originated and serviced, including, but not limited to, the making of required consumer disclosures, such as the TILA


157


Table of Contents
 

(which regulate mortgage loan origination activities, require certain disclosures be made to mortgagors regarding terms of mortgage financing and regulate certain mortgage servicing activities), the FCRA (which regulates the use and reporting of information related to the credit history of consumers), the ECOA (which prohibits discrimination on the basis of age, race and certain other characteristics in the extension of credit), the Fair Housing Act (which prohibits discrimination in housing on the basis of race, sex, national origin, and certain other characteristics), the RESPA (which govern certain mortgage loan origination activities and practices and the actions of servicers related to escrow accounts, transfers, lender-placed insurance, loss mitigation, error resolution, and other customer communications), the HPA and similar state laws;


federal laws that require and govern communications with consumers or reporting of public data such as the GLBA, which requires initial and periodic communication with consumers on privacy matters and the maintenance of privacy regarding certain consumer data in our possession, and the Home Mortgage Disclosure Act, together with its implementing regulations (Regulation C), which requires reporting of certain public loan data;


federal disclosure requirements including those in Regulation AB under the Securities Act, which requires registration, reporting and disclosure for mortgage-backed securities;


state and federal restrictions on the marketing activities conducted by telephone, mail, email, mobile device or the internet, including the Telemarketing Sales Rule, the TCPA, state telemarketing laws, federal and state privacy laws, the CAN-SPAM Act, and the Federal Trade Commission Act and their accompanying regulations and guidelines;


federal and state laws requiring company, branch and individual licensing for the solicitation of or brokering of consumer loans, including the SAFE Act;


the EFTA (which regulates electronic fund transfers to and from individual consumers);


federal and state laws relating to the retention of records;


federal and state laws relating to identity theft;


the FDCPA, which regulates the timing and content of communications on debt collections;


the California Consumer Privacy Act, which provides California consumers with new privacy rights and increases the privacy and security obligations of entities handling certain personal information of such consumers;


the SCRA;


the anti-money laundering and counter-terrorist financing provisions of the Bank Secrecy Act, including the USA Patriot Act, which require non-bank lenders to monitor for, detect and report suspicious activity to the U.S. Treasury’s Financial Crimes Enforcement Network;


restrictions imposed by the rules promulgated by the Office of Foreign Assets Control; and


restrictions imposed by the Dodd-Frank Act and current or future rules promulgated thereunder, including, but not limited to, limitations on fees charged by mortgage lenders, mortgage broker disclosures and rules promulgated by the CFPB, which was created under the Dodd-Frank Act.

Consumer Financial Protection Bureau

The CFPB directly impacts the regulation of residential mortgage loan originations and servicing in a number of ways. First, the CFPB has rulemaking authority with respect to many of the federal consumer protection laws applicable to mortgage servicers, including TILA and RESPA. Second, the CFPB has supervision, examination and enforcement authority over consumer financial products and services offered by


158


Table of Contents

certain non-depository institutions and large insured depository institutions. The CFPB also has authority, under the Dodd-Frank Act, to prevent unfair, deceptive, or abusive practices in connection with the offering of consumer financial products. The Dodd-Frank Act authorizes the CFPB to establish certain minimum standards for the origination of residential mortgages including a determination of the borrower’s ability to repay. The CFPB’s jurisdiction includes those persons originating, brokering or servicing residential mortgage loans and those persons performing loan modification or foreclosure relief services in connection with such loans.

Ongoing regulatory oversight

We expect to continue to incur ongoing operational and system costs in order to maintain compliance with these laws and regulations. Furthermore, there may be additional federal or state laws that place additional obligations on servicers of residential loans.

Because we are not a depository institution, we generally do not benefit from federal preemption of state mortgage lending, loan servicing or debt collection licensing and regulatory requirements. Accordingly, we must comply with state licensing requirements in all of the states in which we conduct business. We are licensed as a loan originator in all 50 states and the District of Columbia and also are licensed as a loan servicer and loan broker in a number of states and jurisdictions in which such licenses are required. We are also subject to an extensive framework of state laws in the jurisdictions in which we do business, and to periodic audits and examinations conducted by the state regulators to ensure compliance with those laws. From time to time, we receive requests from state and other agencies for records, documents and information regarding our policies, procedures and practices regarding our mortgage origination, commercial lending, lender servicing and long-term investing business activities. We incur significant ongoing costs to comply with these governmental regulations. State attorneys general, state licensing regulators, and state and local consumer protection offices have authority to investigate consumer complaints and to commence investigations and other formal and informal proceedings regarding our operations and activities. Failure to comply with state regulations can result in monetary penalties and license revocation. In the past we have been subject to inquiries from, and in certain instances have entered into settlement agreements with, state regulators that had the power to revoke our license or make our continued licensure subject to compliance with a consent order. Some states have special rules that govern mortgage loan servicing practices, such as California’s Homeowner’s Bill of Rights. Failure to comply with these rules can result in delays or rescission of foreclosure, and subject the servicer to penalties and damages.

Investment Company Act Considerations

We conduct our operations so that we are not required to register as an investment company under the Investment Company Act. Section 3(a)(1)(A) of the Investment Company Act defines an investment company as any issuer that is or holds itself out as being engaged primarily in the business of investing, reinvesting or trading in securities. Section 3(a)(1)(C) of the Investment Company Act defines an investment company as any issuer that is engaged or proposes to engage in the business of investing, reinvesting, owning, holding or trading in securities and owns or proposes to acquire investment securities having a value exceeding 40% of the value of the issuer’s total assets (exclusive of U.S. federal government securities and cash items on an unconsolidated basis, which we refer to as the “40% test”). Excluded from the term “investment securities,” among other things, are U.S. federal government securities and securities issued by majority owned subsidiaries that are not themselves investment companies and are not relying on the exceptions from the definition of investment company set forth in Section 3(c)(1) or Section 3(c)(7) of the Investment Company Act.

The securities issued by any wholly owned or majority owned subsidiaries that we may form in the future that are excepted from the definition of “investment company” based on Section 3(c)(1) or 3(c)(7) of the Investment Company Act, together with any other investment securities (exclusive of U.S. government securities and cash items) we may own, may not have a value in excess of 40% of the value of our total assets on an unconsolidated basis. We will monitor our holdings to ensure continuing and ongoing compliance with the 40% test. In addition, we believe that we will not be considered an investment company under Section 3(a)(1)(A) of


159


Table of Contents

the Investment Company Act because we will not engage primarily or hold ourselves out as being engaged primarily in the business of investing, reinvesting or trading in securities. Rather, we will be primarily engaged in the non-investment company businesses of our subsidiaries.

We are organized as a holding company and conduct our businesses primarily through our majority and wholly owned subsidiaries. We expect that our subsidiaries will conduct their operations so that they comply with the 40% test in that no more than 40% of their total assets (exclusive of U.S. federal government securities and cash items) on an unconsolidated basis, will consist of investment securities. We also expect that one or more of our subsidiaries will qualify for an exclusion from registration as an investment company under the Investment Company Act pursuant to Section 3(c)(5)(C) of the Investment Company Act, which is available for entities that do not issue redeemable securities, face-amount certificates of the installment type or periodic payment plan certificates and are primarily engaged in the business of “purchasing or otherwise acquiring mortgages and other liens on and interests in real estate.”

In order for any of our subsidiaries to rely on the exclusion provided under Section 3(c)(5)(C) of the Investment Company Act, generally it is necessary that at least 55% of each such subsidiary’s total assets be comprised of qualifying assets and at least another 25% of each of its total assets be comprised of qualifying assets and/or real estate-related assets under the Investment Company Act. The SEC staff has not issued guidance specifically with respect to reverse mortgages or agency or non-agency Ginnie Mae HMBS. Accordingly, based on our own judgment and analysis of the Investment Company Act and related SEC staff guidance, we take the position that qualifying assets for this purpose include, among other things: (i) mortgage loans, including reverse mortgage loans (A) which we may originate, where the loan is secured by real estate having a value upon origination of the loan that is not less than the principal amount of the loan and (B) loans, if acquired in the secondary market, where the fair market value of the loan is fully secured by real estate upon our acquisition of the loan. Reverse mortgage loans are first lien mortgages that, at the time of origination, are fully secured mortgages where the holder has a right of foreclosure upon certain events of default; (ii) whole pool Agency HMBS issued by third parties and backed by fully drawn reverse mortgage loans; (iii) whole pool Agency HMBS owned by us that are issued and serviced by our origination subsidiary or its subsidiaries; and (iv) whole pool, non-Agency HMBS.

Although the SEC and its staff have not published guidance specifically with respect to the treatment of whole pool non-Agency HMBS or whole pool non-agency mortgage backed securities for purposes of the Section 3(c)(5)(C) exclusion, based on our own judgment and analysis of related guidance from the SEC and its staff identifying agency whole pool certificates as qualifying real estate assets under Section 3(c)(5)(C), we intend to treat whole pool non-Agency HMBS and whole pool non-agency mortgage backed securities where we hold all of the certificates issued by the pool as qualifying assets. We intend to treat any of our interests in “partial pool” mortgage backed securities as real estate-related assets for purposes of Section 3(c)(5)(C), since these interests would represent something less than the entire ownership interest in a pool of reverse mortgage loans. Agency HMBS are standardized mortgage-backed securities that are guaranteed by Ginnie Mae and collateralized by FHA-insured reverse mortgage loans. Ginnie Mae-approved issuers, like our origination subsidiary and its subsidiaries, can pool reverse mortgage loans and through single-tranche securitizations issue Agency HMBS, which are pass through securities. We expect each of our subsidiaries relying on Section 3(c)(5)(C) to rely on guidance published by the SEC staff or on our analyses of guidance published with respect to other types of assets to determine which assets are qualifying real estate assets and real estate-related assets. To the extent that the SEC staff takes a different view of the treatment of our target assets for purposes of Section 3(c)(5)(C) or publishes new or different guidance with respect to these matters we may be required to adjust our strategy accordingly. Although we intend to monitor the assets of our subsidiaries relying on the Section 3(c)(5)(C) exclusion periodically and prior to each acquisition, there can be no assurance that we will be able to maintain this exclusion for these subsidiaries. In addition, we may be limited in our ability to make certain investments or we may be forced to expand the types of assets that we acquire or invest in which, in either case, could result in us or our subsidiaries holding assets we might wish to sell or selling assets we might wish to hold or modifying our strategy as described in this prospectus.


160


Table of Contents

There can be no assurance that the laws and regulations governing our Investment Company Act status will not change in a manner that adversely affects our operations. We cannot assure you that the SEC or its staff will not take action that results in our or one or more of our subsidiary’s failure to maintain an exclusion or exemption from the Investment Company Act. See “Risk Factors —Legal and Regulatory Risks—Conducting our business in a manner so that we are exempt from registration under, and in compliance with, the Investment Company Act, may reduce our flexibility and could limit our ability to pursue certain opportunities. At the same time, failure to continue to qualify for exemption from the Investment Company Act could adversely affect us.”

Legal Proceedings

From time to time, we are involved in various legal proceedings, lawsuits and claims incidental to the conduct of our business. Our businesses are also subject to extensive regulation, which may result in regulatory proceedings against us. We are not currently a party to any lawsuit or proceeding which, in the opinion of management, is likely to have a material adverse effect on our business, financial condition, or results of operations.


161


Table of Contents

MANAGEMENT

Directors and Executive Officers

The following table sets forth the names, ages and positions of the directors and executive officers of Finance of America Companies Inc. as of December 31, 2021.


Name

   Age   

Position

Brian L. Libman(2)(3)

   55    Chairman of the Board of Directors

Patricia L. Cook

   67    Chief Executive Officer and Director

Menes Chee(2)(3)

   43    Director

Norma C. Corio(1)

   60    Director

Robert W. Lord(1)(3)

   57    Director

Tyson A. Pratcher(1)

   46    Director

Lance N. West(2)

   60    Director

Graham Fleming

   51    President

Jeremy Prahm

   43    Chief Investment Officer

Anthony W. Villani

   64    Chief Legal Officer

Johan Gericke

   50    Executive Vice President, Chief Financial Officer

Tai A. Thornock

   49    Chief Accounting Officer


(1)

Member of the audit committee

(2)

Member of the compensation committee

(3)

Member of the nominating and corporate governance committee

Brian L. Libman oversees our Company’s business strategy. He is the architect of the Company’s unique business model, and it is his vision that guides the Company. Mr. Libman has spent his entire career in the specialty finance area and has been involved in structuring and consummating the acquisitions of more than twenty businesses. Prior to creating Finance of America in 2013, he was the managing partner and CEO of Green Tree Servicing and became the Chief Strategy Officer of its public market successor. He began his career at Lehman Brothers and spent more than a decade developing the loan acquisition, servicing and lending businesses there, including the creation of Aurora Loan Services, one of the nation’s leading alternative mortgage originators and servicers. Through his deep knowledge of the lending space, he invented and was awarded patent: US20070136186A1 for his Automated Loan Evaluation System, which is a system and method for providing a loan pricing model for various lending scenarios. Mr. Libman submatriculated with honors from The Wharton School at the University of Pennsylvania, having earned both his MBA and BSE.

Patricia Cook joined the Company in March 2016, has served as Chief Executive Officer since October 2020 and joined the board of directors of the Company in connection with the Business Combination. She served as President of the Company from March 2017 until October 2020. Prior to joining the Company, Ms. Cook served as the President of Ditech Financial LLC from February 2013 to February 2016 and Executive Vice President of Green Tree Servicing (now Ditech Financial LLC) from January 2009 to February 2013. Previous to Green Tree Servicing, Ms. Cook served as Executive Vice President and Chief Business Officer of Freddie Mac, Chief Investment Officer for JPMorgan and Chief Investment Officer for Prudential Investment Management, after beginning her career at Salomon Brothers in 1979. Ms. Cook holds a B.A. from Saint Mary’s College and an M.B.A. from New York University Stern School of Business.


162


Table of Contents

Menes O. Chee has served as a member of our board of managers since 2017 and is a member of the Company’s board of directors following the Business Combination. Mr. Chee is a Senior Managing Director of The Blackstone Group Inc.; he is a founding partner and member of the investment committee of Blackstone’s Tactical Opportunities Group. Before joining Blackstone, Mr. Chee was a Principal with TPG-Axon Capital and a private equity investment professional with Texas Pacific Group. Mr. Chee began his career at Donaldson Lufkin & Jenrette in the Leveraged Finance and Merchant Banking groups. Mr. Chee graduated magna cum laude from the University of Pennsylvania with a B.S. in Economics from the Wharton School and a B.A. from the College of Arts and Sciences, where he was elected to Phi Beta Kappa.

Norma C. Corio joined the Company’s board of directors upon the closing of the Business Combination. Ms. Corio currently serves as a Senior Managing Director at OEP. Prior to joining OEP in 2018, Ms. Corio served as the CFO of American Express Global Business Travel from June 2014 to June 2017. Prior to her role at American Express Global Business Travel, Ms. Corio served as Co-President of Miller Buckfire from April 2013 to May 2014. Ms. Corio previously worked for JPMorgan Chase from October 1982 to March 2013 where she held various positions, including Treasurer and, separately, Head of Restructuring within the Investment Banking division, where she led corporate financings from June 1995 to August 2008. Ms. Corio also held positions in credit and risk management and investor relations. Ms. Corio serves as a member of the board of directors of Intren, Omni Environmental Solutions, Bibliotheca, and Go Acquisition Corp (NYSE: GOAC. U), a SPAC. Ms. Corio is Chairman of the Audit Committee of Go Acquisition Corp. Ms. Corio received her MBA in Banking & Finance from Pace University, and her BA in Economics from LeMoyne College.

Robert W. Lord joined the Company’s board of directors upon the closing of the Business Combination. Mr. Lord has served as the Senior Vice President of Cognitive Applications, Blockchain, and Ecosystems at IBM since February 2019. He also served as the Chief Digital Officer for IBM from April 2016 to February 2019. From August 2013 until February 2016, Mr. Lord served as both President of AOL and CEO of AOL Platforms at Verizon Communications Inc. Mr. Lord also held a number of leadership roles at Razorfish, Inc. from November 2002 to July 2013, serving most recently as Global CEO. Mr. Lord has served as a member of the board of directors of Aqua Finance, Inc. since October 2020 and previously served as a member of the boards of directors of Williams-Sonoma, Inc. from October 2017 to December 2019 and ScreenVision Media, Inc. from February 2016 to April 2018. Mr. Lord holds a B.S. in Industrial Engineering and Operations Research from Syracuse University and an M.B.A. from Harvard University.

Tyson A. Pratcher joined the Company’s board of directors upon the closing of the Business Combination. Mr. Pratcher currently serves as a Managing Director at the RockCreek Group. Before joining the RockCreek Group in 2020. Mr. Pratcher served as the Head of Investments at TFO USA from 2017 to 2019. Prior to his role with TFO USA, Mr. Pratcher served as the Director of Opportunistic Investments and the Director of Absolute Return Strategies at the New York State Common Retirement Fund from 2007 to 2017. Mr. Pratcher served as a member of the board of directors of Organix Recycling, Inc. from 2018 to 2021 and also previously served on the boards of directors of Citizens Parking and GripInvest from 2017 to 2019. Mr. Pratcher holds a J.D. from Columbia Law School and a B.S. in Political Science from Hampton University.

Lance N. West joined the Company’s board of directors upon the closing of the Business Combination. Mr. West previously served as Partner and Senior Managing Director of Centerbridge Partners and former Chairman & CEO of Centerbridge Partners Europe from 2006 to 2018. Since his retirement from Centerbridge Partners in 2018, Mr. West has been an active private investor in and Senior Advisor to several businesses. Before joining Centerbridge, Mr. West was a Partner Managing Director at Goldman Sachs & Co. LLC, where he headed the firm’s Principal Finance Group. Prior to joining Goldman Sachs & Co, LLC in 1999, he was founder and CEO of Greenthal Realty Partners LP and GRP Financial LLC from 1992 to 1999. Prior to founding GRP, Mr. West was an executive vice president-principal with The Charles H. Greenthal Group, Inc. and began his career as a Member of the Technical Staff at AT&T Bell Laboratories from 1982 to 1984. Mr. West earned his M.S. in Electrical Engineering from the California Institute of Technology in 1983, and graduated magna cum laude with a B.S. in Electrical Engineering from Tufts University in 1982. Mr. West has served as a board


163


Table of Contents

member or chair of public and private companies globally including BankUnited (NYSE: BKU), Aktua Soluciones Financieras, Intrepid Aviation Holdings LLC, Green Tree Holdings, Resort Finance America LLC, Triad Financial SM LLC, Williams & Glyn’s Bank Limited (pre-IPO Transition Board), APCOA Parking Holdings GmbH, & Duo Bank (Walmart Bank) Canada.

Graham Fleming joined the Company in December 2013 and has served as our Chief Administrative Officer since 2014. Mr. Fleming was appointed to President of our Company in October 2020. Prior to joining the Company, Mr. Fleming founded and served as the President of Icon Residential Lenders. Prior to that, Mr. Fleming served as the Chief Financial Officer of AMRESCO Residential Mortgage and as the Co-Chief Executive Officer of Finance America LLC. Mr. Fleming brings over 25 years of experience in the mortgage lending business including extensive expertise in strategic planning, accounting and financial management, regulatory compliance, quality control and risk management, secondary operations and capital markets. Mr. Fleming attended the Dublin Business School, Ireland and is a Chartered Certified Accountant.

Anthony W. Villani oversees our Company’s Legal and Compliance teams. He was previously the general counsel of Beyond Finance, Inc. He also served for eight years as executive vice president and general counsel of Nationstar Mortgage Holdings, Inc., now known as Mr. Cooper Group Inc. (“Mr. Cooper”). Prior to joining Mr. Cooper, Mr. Villani was vice president and associate general counsel for three years at Goldman Sachs, where he served as the managing attorney for Litton Loan Servicing LP, a Goldman Sachs company. He also served as executive vice president and general counsel of EMC Mortgage Corporation, a Bear Stearns company. Mr. Villani holds a J.D. from Oklahoma City University School of Law and a B.S. in Political Science from Arizona State University. He was admitted to the Oklahoma Bar in 1983 and the Texas Bar in 1989.

Jeremy Prahm joined the Company in December 2015 as Senior Managing Director across numerous segments of our business, including our Portfolio Management, Mortgage Originations, Reverse Mortgage, and Commercial businesses. Mr. Prahm was recently appointed to Chief Investment Officer of the Company. Prior to joining the Company, Mr. Prahm served as a Portfolio Manager and Director of Quantitative Solutions at Green Tree Investment Management, a wholly owned subsidiary of Walter Investment Management, from December 2008 to December 2015. Mr. Prahm holds a B.S. in Economics from Saint Cloud University.

Tai Thornock joined the Company in June 2015 as Chief Accounting Officer. Mr. Thornock continues to serve as Chief Accounting Officer. Prior to joining the Company, Mr. Thornock served as Senior Vice President of Finance of Mr. Cooper from June 2013 to June 2015, serving as the CFO of direct to consumer lending and head of FP&A for total mortgage originations. Prior to that, Mr. Thornock served as Senior Vice President, Finance and Divisional Chief Financial Officer and Senior Vice President, Financial Reporting and Divisional Controller at Bank of America Home Loans from June 2012 to June 2013 and October 2004 to June 2012, respectively. Mr. Thornock holds a B.A. in Accounting from Brigham Young University, graduating cum laude, and is a Certified Public Accountant.

Johan Gericke joined the Company upon the closing of the Business Combination as Executive Vice President, Chief Financial Officer. Prior to joining the Company, Mr. Gericke served as Chief of Staff for the Commercial Bank division at Capital One from January 2019 to March 2021. Prior to that, Mr. Gericke served Chief Financial Officer to the division from January 2018 to January 2019. Mr. Gericke also served as Chief Financial Officer of the Retail and Direct Bank division at Capital One from January 2016 to January 2018, and as Managing Vice President, Corporate Development from April 2011 to January 2016. Prior to that, Mr. Gericke was a Senior Vice President, Corporate Development at Wells Fargo from July 2006 to April 2011. Mr. Gericke also served as a Business Development Manager from February 2004 to June 2006 in Wells Fargo’s Consumer Credit Group. Prior to his employment at Wells Fargo, Mr. Gericke spent several years working as a public accountant and investment banker. Mr. Gericke holds an M.B.A. from Santa Clara University, an Honors Bachelor of Accounting Science from the University of South Africa, and qualified as a South African Chartered Accountant in 1997.


164


Table of Contents

Composition of the Board of Directors

Following the Closing, our business and affairs is managed under the direction of the Board. We entered into the Stockholders Agreement with our Principal Stockholders in connection with the Closing. This agreement grants our Principal Stockholders the right to designate nominees to the Board subject to the maintenance of certain ownership requirements in the Company. See “Certain Relationships and Related Person Transactions— Stockholders Agreement.”

Director Independence

Our board of directors has affirmatively determined that each of Mr. Chee, Ms. Corio, Mr. Lord, Mr. Pratcher and Mr. West qualify as independent directors under the NYSE listing standards.

Background and Experience of Directors

When considering whether directors and nominees have the experience, qualifications, attributes or skills, taken as a whole, to enable the Board to satisfy its oversight responsibilities effectively in light of its business and structure, the board of directors focuses primarily on each person’s background and experience as reflected in the information discussed in each of the directors’ individual biographies set forth above. We believe that our directors provide an appropriate mix of experience and skills relevant to the size and nature of our business. In particular, the members of our board of directors considered the following important characteristics, among others:


Mr. Libman—our board of directors considered Mr. Libman’s perspective, experience and thorough knowledge of our industry as our founder and Chairman.


Ms. Cook—our board of directors considered Ms. Cook’s many years of experience as a financial services executive and her leadership role with the Company.


Mr. Chee—our board of directors considered Mr. Chee’s affiliation with Blackstone, his investment expertise and experience working with companies backed by private equity sponsors.


Ms. Corio—our board of directors considered Ms. Corio’s extensive financial and management experience and her insight from having served on the boards of directors of public and private companies.


Mr. Lord—our board of directors considered Mr. Lord’s leadership skills obtained through extensive executive management and board experience.


Mr. Pratcher—our board of directors considered Mr. Pratcher’s considerable financial and investment background, including as a Managing Director at the RockCreek Group.


Mr. West—our board of directors considered Mr. West’s financial and investment expertise and his experience serving on the boards of directors of public and private companies.

Controlled Company Exception

Our Principal Stockholders control a majority of the combined voting power of all classes of the Company’s stock entitled to vote generally in the election of directors. As a result, the Company is a “controlled company” within the meaning of NYSE corporate governance standards. Under these corporate governance standards, a company of which more than 50% of the voting power is held by an individual, group or another company is a “controlled company” and may elect not to comply with certain corporate governance standards, including the requirements (1) that a majority of the Board consist of independent directors, (2) that the Board have a compensation committee that is comprised entirely of independent directors with a written charter addressing the committee’s purpose and responsibilities and (3) that the Board have a nominating and corporate governance committee that is comprised entirely of independent directors with a written charter addressing the


165


Table of Contents

committee’s purpose and responsibilities. For at least some period following the Closing, the Company may utilize these exemptions. Accordingly, you will not have the same protections afforded to stockholders of companies that are subject to all of these corporate governance requirements. In the event that the Company ceases to be a “controlled company” and the Company’s shares continue to be listed on the NYSE, the Company will be required to comply with these provisions within the applicable transition periods.

Board Committees

The Board has established an audit committee, compensation committee and nominating and corporate governance committee. The responsibilities of each committee are described below. The composition of each committee has been made in accordance with NYSE listing standards and the independence standards of Rule 10A-3 of the Exchange Act, as applicable. The Board may also establish from time to time any other committees that it deems necessary or desirable. Members serve on these committees until their resignation or until otherwise determined by the Board.

Audit Committee

Our audit committee consists of Ms. Corio and Messrs. Lord and Pratcher, with Ms. Corio serving as chair. Ms. Corio and Messrs. Lord and Pratcher qualify as independent directors under the NYSE listing standards and the independence standards of Rule 10A-3 of the Exchange Act.

Our audit committee is responsible for, among other things:


selecting and hiring our independent auditors, and approving the audit and non-audit services to be performed by our independent auditors;


assisting the board of directors in evaluating the qualifications, performance and independence of our independent auditors;


assisting the board of directors in monitoring the quality and integrity of our financial statements and our accounting and financial reporting;


assisting the board of directors in monitoring our compliance with legal and regulatory requirements;


reviewing the adequacy and effectiveness of our internal control over financial reporting processes;


assisting the board of directors in monitoring the performance of our internal audit function;


monitoring the performance of our internal audit function;


reviewing with management and our independent auditors our annual and quarterly financial statements;


establishing procedures for the receipt, retention and treatment of complaints received by us regarding accounting, internal accounting controls or auditing matters and the confidential, anonymous submission by our employees of concerns regarding questionable accounting or auditing matters; and


preparing the audit committee report that the rules and regulations of the SEC require to be included in our annual proxy statement.

Compensation Committee

Our compensation committee consists of Messrs. Libman, Chee and West, with Mr. Libman serving as chair.


166


Table of Contents

The compensation committee is responsible for, among other things:


reviewing and approving corporate goals and objectives relevant to the compensation of our CEO, evaluating our CEO’s performance in light of those goals and objectives, and, either as a committee or together with the other independent directors (as directed by the board of directors), determining and approving our CEO’s compensation level based on such evaluation;


reviewing and approving, or making recommendations to the board of directors with respect to, the compensation of our other executive officers, including annual base salary, bonus and equity-based incentives and other benefits;


reviewing and recommending the compensation of our directors;


reviewing and discussing annually with management our “Compensation Discussion and Analysis” disclosure required by SEC rules;


preparing the compensation committee report required by the SEC to be included in our annual proxy statement; and


reviewing and making recommendations with respect to our equity compensation plans.

Nominating and Corporate Governance Committee

Our nominating and corporate governance committee consists of Messrs. Libman, Chee and Lord, with Mr. Chee serving as chair.

The nominating and corporate governance committee is responsible for, among other things:


assisting our board of directors in identifying prospective director nominees and recommending nominees to the board of directors;


overseeing the evaluation of the board of directors and management;


reviewing developments in corporate governance practices and developing and recommending a set of corporate governance guidelines; and


recommending members for each committee of our board of directors.

Compensation Committee Interlocks and Insider Participation

None of our executive officers currently serves, or has served during the last completed fiscal year as a member of the board of directors or compensation committee (or other committee performing equivalent functions) of any entity that has one or more executive officers serving on our board of directors or compensation committee. We are party to certain transactions with affiliates of our Principal Stockholders described in “Certain Relationships and Related Person Transactions.”

Code of Ethics

We have adopted a Code of Business Conduct and Ethics that applies to all of our officers, directors and employees, including our principal executive officer, principal financial officer, principal accounting officer and controller, or persons performing similar functions, which is posted on our website. Our Code of Business Conduct and Ethics is a “code of ethics,” as defined in Item 406(b) of Regulation S-K. We will make any legally required disclosures regarding amendments to, or waivers of, provisions of our code of ethics on our website. The information contained on, or accessible from, our website is not part of this prospectus by reference or otherwise.


167


Table of Contents

Compensation of Directors and Officers

Overview

The Company’s executive compensation program is designed to:


attract, retain and motivate leaders who love what they do and possess the attributes needed for successful execution of their duties;


reward senior management in a manner aligned with our financial performance, to encourage them to apply their attributes to the greatest advantage of our stakeholders; and


align senior management’s interests with our equity owners’ long-term interests through equity participation and ownership.

Decisions with respect to the compensation of our executive officers, including our named executive officers, are made by the compensation committee of our board of directors.

Compensation for our executive officers have the following components: base salary, cash bonus opportunities, long-term incentive compensation, broad based employee benefits, supplemental executive perquisites and severance benefits. Base salaries, broad-based employee benefits, supplemental executive perquisites and severance benefits are designed to attract and retain senior management talent. We also use annual cash bonuses and long-term equity awards to promote performance-based pay that aligns the interests of our named executive officers with the long-term interests of our equity-owners and to enhance executive retention.

Base Salary

Our named executive officers’ base salaries in effect prior to the Business Combination will continue as described under “Executive Compensation,” subject to immaterial increases made in connection with the Company’s annual review of its named executive officers’ base salaries, and be reviewed annually by the compensation committee.

Annual Bonuses

The Company uses annual cash incentive bonuses for the named executive officers to motivate their achievement of short-term performance goals and tie a portion of their cash compensation to performance. Near the beginning of each year, the compensation committee will select the performance targets, target amounts, target award opportunities and other terms and conditions of annual cash bonuses for the named executive officers. Following the end of each year, the compensation committee will determine the extent to which the performance targets were achieved and the amount of the award that is payable to the named executive officers.

Stock-Based Awards

The Company uses stock-based awards to promote our interest by providing these executives with the opportunity to acquire equity interests as an incentive for their remaining in our service and aligning the executives’ interests with those of the Company’s equity holders. Stock-based awards will be awarded in future years under the Incentive Plan, which has been assumed by the Company.

Other Compensation

The Company maintains various employee benefit plans, including health and dental insurance, group term life insurance, short- and long-term disability insurance, other health and welfare benefits, a 401(k) Savings Plan including matching contribution by the Company and other voluntary benefits. For additional details, please see “Executive Compensation—Executive Compensation in 2020—Compensation Discussion and Analysis—Retirement and Other Benefits.”


168


Table of Contents

Director Compensation

Non-employee directors of the Company that are not affiliated with Blackstone receive varying levels of compensation for their services as directors and members of committees of the Board. The Company anticipates determining director compensation in accordance with industry practice and standards.


169


Table of Contents

EXECUTIVE COMPENSATION

Compensation Discussion and Analysis

Overview

The following discussion and analysis analyzes our executive compensation program with respect to our named executive officers for the year ended December 31, 2020 and the material elements of the compensation packages awarded to such officers. The individuals whose compensation is discussed below are:


Name


Title

Patricia L. Cook

   Chief Executive Officer

Tai A. Thornock

   Chief Accounting Officer and Interim Chief Financial Officer

Jeremy E. Prahm

   Chief Investment Officer

Graham A. Fleming

   President

Anthony W. Villani

   Chief Legal Officer

We collectively refer to these individuals as our “named executive officers” or “NEOs.”

The Company is a newly-formed entity that recently became a public company as a result of the Business Combination pursuant to which Replay combined with FoA. As a result, the compensation awarded to, earned by, or paid to the named executive officers for 2020 was provided by and determined in accordance with policies and practices developed by UFG Holdings LLC (“UFG”). Accordingly, except where the context requires otherwise, references to “Company” in this “Executive Compensation” section refers to UFG and the terms “Board” or “Board of Managers” refer to the Board of Managers of UFG. This discussion will also disclose the public company compensation structure and strategy we adopted following the completion of the Business Combination.

Historically, the Company’s compensation practices were representative of the integrated cultures and philosophies of the various businesses that were acquired and integrated together to create the Company. The Compensation Committee of the Board of Directors of the Company, together with its selected compensation consultant, will work with management to ensure that plans, programs and practices associated with executive and employee compensation will reinforce and sustain the philosophy and principles disclosed in this prospectus.

Compensation Philosophy and Objectives

Our compensation philosophy is centered around a pay-for-performance philosophy and is designed to reward our named executive officers for their abilities, experience and efforts. We believe that our Company is our people and that our success is a cumulative outcome. The compensation programs we offer directly influence our ability to attract, retain and motivate the highly-qualified and experienced professionals who are vital to our success as a company. We believe people perform at their best when they are doing what they are good at, when they feel valued and when they are not distracted by outside concerns.

The top leadership roles in our Company carry tremendous responsibility and demand knowledge, personal qualities and experience that are highly valued in the talent market. Our principal executive compensation objectives are to:


Attract, retain and motivate leaders who love what they do and possess the attributes necessary to successfully execute their duties;


Reward senior management in a manner aligned with our financial performance, intended to encourage them to apply their attributes to the greatest advantage of our stakeholders; and


Align senior management’s interests with our equity owners’ long-term interests through equity participation and ownership.


170


Table of Contents
   

To accomplish these objectives, our compensation philosophy:


Acknowledges the talent market’s professional valuation of the executive’s background, experience, knowledge relationships and demonstrated ability to deliver expected financial results;


Provides a compelling market-competitive opportunity, contingent upon attainment of business results ratified by the Board, to participate annually in the financial success of the Company; and


Aligns the executive’s long-term career opportunities and financial outcomes with long-term shareholder value, growth of the Company and sustainable business strategies.

The tools we use to accomplish these objectives are continuously being evaluated, refined and balanced to provide an opportunity-to-risk ratio that is consistent with the Company’s needs. We invest competitively according to our assessment of the actual market value of individuals and reward additional performance-based value, allowing us to share a portion of that value as it occurs.

To accomplish these ends, we invest in our people using certain tools common in our industry:


Base wages and salaries;


Annual cash incentive compensation; and


Long-term incentive compensation.

We also invest significantly in our executives’ and other employees’ professional development, constructive and supportive work environments, effective technologies and in assistance for managing personal health and welfare.

Executive Compensation in 2020

Process for Determining 2020 Compensation

Prior to the Business Combination, the Company did not have a Compensation Committee and compensation decisions were instead primarily determined by members of the Company’s Board of Managers. The Board assessed the performance of Patricia L. Cook, our Chief Executive Officer, during 2020, and established a compensation structure intended to ensure that a substantial portion of Ms. Cook’s compensation would be directly linked to her individual performance and the performance of our business.

In determining the compensation of each of our named executive officers other than the Chief Executive Officer, the Board sought the input of the Chief Executive Officer. The Chief Executive Officer provided recommendations to the Board regarding the compensation of the other named executive officers. The performance of our named executive officers is reviewed at least annually by the Board, based in part on assessments provided by the Chief Executive Officer on all of our named executive officers (other than the Chief Executive Officer). The Board determines each named executive officer’s compensation at least annually. The Chief Executive Officer is not involved in decisions regarding her own compensation.

In determining compensation levels for our named executive officers, the Board considered each named executive officer’s particular position and responsibility and relied upon the judgment and experience of its members, including their knowledge of competitive compensation levels in our industry. We believe that compensation should be competitive with compensation for executive officers in similar positions and with similar responsibilities in our marketplace. Although the Board did not retain its own compensation consultant or review survey or other publicly available benchmark data specific to each named executive officer in 2020, the Board instead relied upon its general understanding of current compensation practices, along with consideration of several different factors, including the individual’s performance, scope of responsibilities, depth and breadth of overall leadership experience, and the importance of the position to achieving our strategies. Based upon the


171


Table of Contents

considerations described above, the Board determined the total amount of compensation and the allocation of total compensation among each of our main components of compensation described below, for our named executive officers.

In preparation for and in connection with the Business Combination, the Company has engaged Frederic W. Cook & Co., Inc. to provide executive compensation consulting services to advise on executive and director compensation and to help align executive pay with market practices for executive pay decisions following the Business Combination. We expect that these steps will result in structures, policies and processes in 2021 and beyond that ensure good governance of the investment we make in our people.

Key Elements of Executive Compensation Program

Compensation for our named executive officers consists of the following key components:


Element


Description


Objective(s)

Base Salary

   Fixed portion of annual cash pay, which is paid semi-monthly and reviewed annually    Provides a competitive level of fixed compensation and matches the assessed fair market value of the executive’s experience, expertise, past performance, networks, and similar considerations

Annual Cash Incentive Compensation

   An annual cash payment targeted as a percentage of base salary that is contingent upon performance    Provides financial incentive to achieve business objectives

Special Cash and/or Equity Awards

   A special discretionary cash and/or equity award    Attract or retain executive talent, to reward performance outside of the executive’s individual responsibilities or to reward performance of extraordinary responsibilities assumed by the executive

Long-Term Incentive Compensation

   Participation in future cash distributions based on Company value    Promotes retention by requiring continued employment through and following the date of distribution and aligns NEOs interests with Company growth

Employee Benefits

   Competitive financial assistance programs pertaining to personal health and income security    Allows executives to focus energies on business instead of personal concerns

NEO Salaries in 2020

We provide each named executive officer with a base salary for the services that the executive officer performs for us. This compensation component constitutes a stable element of compensation while other compensation elements are variable. Base salaries are reviewed annually and may be increased in light of the individual performance of the named executive officer, company performance, any change in the executive’s


172


Table of Contents

position within our business, the scope of his or her responsibilities and any changes thereto and his or her tenure with the Company. For 2020, the base salaries of our NEOs were as follows:


Named Executive Officer

   2020 Base Salary(1)  

Patricia L. Cook

   $ 300,000  

Tai A. Thornock

   $ 257,500  

Jeremy E. Prahm

   $ 300,000  

Graham A. Fleming

   $ 300,000  

Anthony Villani

   $ 350,000  


(1)

The Board increased Mr. Prahm’s base salary from $250,000 to $300,000 effective March 1, 2020, and increased Mr. Thornock’s base salary from $250,000 to $257,500 effective April 1, 2020. None of the other named executive officers received increases to their base salaries in fiscal 2020.

As members of the core leadership of a start-up company, executives’ base salaries were conservative. As a public company, we expect to perform a market analysis of our NEOs base salaries against other peer companies in our industry and align total compensation with a level of opportunity that is competitive with our peers. Notwithstanding this analysis, we may continue to weight variable opportunity more heavily than fixed compensation in comparison to our peers.

Annual Cash Incentive Compensation

Under the 2020 NEO compensation program, each of our NEOs was eligible to earn an annual cash incentive award targeted at an amount equal to a specified percentage of such NEO’s base salary. The Company accrued a portion of income to fund the discretionary bonus pool for 2020. The target value of the pool was based on the aggregate target bonus compensation of all eligible employees. The actual pool was dependent upon overall Company performance. Awards to NEOs were tied primarily to Company performance with some variability due to business unit performance. For 2020, target incentive payout amounts for each of the named executive officers were as follows:


Named Executive Officer

   2020 Base Salary      Annual Incentive Target
% of Base Salary
    Annual Incentive
Target Payout
 

Patricia L. Cook

   $ 300,000        300   $ 900,000  

Tai A. Thornock

   $ 257,500        100   $ 257,500  

Jeremy E. Prahm

   $ 300,000        100   $ 300,000  

Graham A. Fleming

   $ 300,000        200   $ 600,000  

Anthony Villani

   $ 350,000        200   $ 700,000  

The Board reserves final approval of each named executive officer’s annual cash incentive award, based on recommendations from Ms. Cook (other than with respect to her own compensation). For 2020, these decisions were based primarily on the Board’s assessment of such named executive officer’s individual performance, operational performance for the areas of the business for which he or she has responsibility, and the officer’s potential to enhance and contribute to our equity owners’ long-term interests. In evaluating these factors, members of the Board relied upon their judgment to determine the ultimate amount of a named executive officer’s annual cash incentive payment that the Board believed was necessary to properly incentivize the named executive officer to seek to achieve our objectives and reward a named executive officer for achieving those objectives over the course of the prior year. Key factors that the Board considered in making such determination with respect to Ms. Cook were her role in overseeing the growth and operations of the Company and her leadership on the strategic direction of the Company generally. Key factors that the Board considered in making such determinations with respect to Mr. Thornock were his leadership and oversight of the Company’s accounting functions. Key factors that the Board considered in making such determinations with respect to


173


Table of Contents

Mr. Prahm were his role in overseeing and managing the strategic direction of the Company’s Portfolio Management segment. Key factors that the Board considered in making such determinations with respect to Mr. Fleming were his leadership and oversight of our administrative functions and his role in strategic initiatives undertaken by the Company. Key factors that the Board considered in making such determinations with respect to Mr. Villani were his leadership and strategic oversight over the Company’s legal function. 2020 bonus awards were paid to our named executive officers on March 15, 2021. The actual cash bonus amounts awarded for 2020 based on these considerations are reflected below and reported in the “Bonus” column of the Summary Compensation Table.


Named Executive Officer

   2020 Annual
Cash Incentive
Award ($)
 

Patricia L. Cook

   $ 1,500,000  

Tai A. Thornock

   $ 500,000  

Jeremy E. Prahm

   $ 1,500,000  

Graham A. Fleming

   $ 1,500,000  

Anthony Villani

   $ 300,000  

Sign-On, Retention and Special Bonuses

From time to time, we may award sign-on, retention and discretionary bonuses in order to attract or retain executive talent, to reward performance outside of the executive’s individual responsibilities or to reward performance of extraordinary responsibilities assumed by the executive.

In recognition of their leadership and performance in managing the Company through the COVID-19 crisis, Ms. Cook and Messrs. Fleming and Prahm each received a special cash recognition award of $2 million in fiscal 2020 and Mr. Thornock received a special cash recognition award of $250,000 in the fiscal year of 2020.

Management Long-Term Incentive Plan

The Company’s Management Long-Term Incentive Plan (the “MLTIP”) was established on January 1, 2015 to provide an incentive to key employees to continue in the employment of the Company and to improve the growth and profitability of the Company. Under the MLTIP, phantom units may be granted as a vehicle to provide participants with the opportunity to receive payments in connection with certain distributions of the Company. Any potential payout with respect to the phantom units will occur only after a specified level of cumulative distributions has been received by all common unit holders of the Company, and is subject to continued employment of the holder through the applicable payment dates. To date, there have been no payments made with respect to the phantom units.

The phantom units are accounted for as a profit-sharing arrangement under ASC Topic 710, Compensation – General (“ASC 710”) as they do not represent a substantive form of equity and are not indexed to the price of UFG common units. For additional details on the terms of the phantom units, see “Narrative Disclosure to Summary Compensation Table and Grants of Plan-Based Awards Table—Management Long-Term Incentive Plan.” In connection with the Business Combination, participants in the MLTIP are expected to receive a combination of cash and RSUs in respect of their phantom units as described further in “—Actions Taken in Connection with the Transactions” below.

To further align the interests of our executives with the interests of our stakeholders, we have also provided our executives with the opportunity to indirectly co-invest in the Company through the purchase of common units in Management Holdings (“Co-Invest Units”), in some cases at a discount to their fair value. None of our named executive officers purchased Co-Invest Units at a discount in 2020.


174


Table of Contents

Retirement and Other Benefits

Our named executive officers are eligible to receive the same benefits and to participate in the same plans that we offer to other full-time employees, including health and dental insurance, group term life insurance, short- and long-term disability insurance, other health and welfare benefits, our 401(k) Savings Plan (including matching contributions by the Company) and other voluntary benefits.

These benefits are provided to the named executive officers to eliminate potential distractions from performing their regular job duties. We believe the cost of these programs is counterbalanced by an increase in productivity by the executives receiving access to them.

Tax Considerations

We operate our compensation programs with the good faith intention of complying with Section 409A of the Internal Revenue Code.

Actions Taken in Connection with the Transactions

Incentive Plan

In connection with the Business Combination, the Company assumed the Incentive Plan, which will allow us to implement a new market-based long-term incentive program to align our executive compensation package with similarly situated public companies.

Amended and Restated Management Long-Term Incentive Plan

In connection with the execution of the Transaction Agreement, UFG adopted the Amended and Restated UFG Holdings LLC Management Long-Term Incentive Plan (the “A&R MLTIP”), effective as of the date the Transaction Agreement was executed. Following the date the Transaction Agreement was executed, no additional phantom units may be granted under the A&R MLTIP.

Under the terms of the A&R MLTIP, participants (including each of our named executive officers) are entitled to receive, subject to the terms and conditions of the A&R LTIP, (i) a cash payment promptly following the Closing, (ii) a grant of restricted stock units under the Incentive Plan (referred to herein as “Replacement RSUs”) and (iii) the right to receive additional shares of Class A Common Stock upon the occurrence of the First Earnout Achievement Date or the Second Earnout Achievement Date, referred to herein as the “Earnout Dates.” The A&R MLTIP is administered by the Compensation Committee of the Company, such administrative body being referred to herein as the “Administrator.”

Pursuant to the terms of the A&R MLTIP, to the extent that the holders of FoA Units (following FoA’s merger with UFG) as of immediately following the Pre-Closing Reorganization (the “Original Unitholders”) receive (i) cash distributions (other than tax distributions) and (ii) cash amounts in respect of a transfer of such FoA Units, together with all prior distributions in connection with the Closing, in excess of a specified hurdle amount (such excess amount, an “Eligible Distribution”), each participant holding phantom units who is actively employed by one of FoA, its affiliates, subsidiaries or successors or, following the Closing, the Company (for purposes of the A&R MLTIP, referred to herein collectively as, the “Company Group”) on the Closing Date will be entitled to receive an amount equal to the product of (i) such Eligible Distribution, (ii) 10% and (iii) a fraction, the numerator of which is the number of phantom units held by such participant and the denominator of which is 1,250, payable promptly following the Closing (“Eligible Distribution Award”). Original Unitholders received an Eligible Distribution in connection with the Closing, and, accordingly, participants in the A&R MLTIP who were employed by a member of the Company Group on the Closing Date became entitled to receive their respective Eligible Distribution Award, subject to satisfaction of the Release Requirement (defined below). Under the A&R


175


Table of Contents

MLTIP, the Administrator has the discretion to pay Eligible Distribution Award in the form of cash, Class A Common Stock, other equity securities or property or any combination. The Administrator determined to pay the Eligible Distribution Awards in cash, and such amounts were paid to participants on or around April 23, 2021.

In addition, on or promptly following the date on which shares of Class A Common Stock reserved for issuance pursuant to the Incentive Plan are registered on an effective Form S-8 with the Securities and Exchange Commission, the Company will grant to each participant (including each of our named executive officers) that (i) held phantom units as of the Closing Date and (ii) remains employed with the Company Group as of the RSU Grant Date (as defined below), in consideration for the cancellation of the participant’s phantom units, a number of Replacement RSUs (rounded to the nearest whole number, with 0.5 rounding up) equal to the product of (x) the number of phantom units held by such participant as of the Closing Date and (y) the quotient of (A) the Retained Value per Phantom Unit divided by (B) the Closing Price (the date of grant of such Replacement RSUs, the “RSU Grant Date”). For purposes hereof:


“Closing Price” shall mean a good faith reasonable estimate by the Administrator of the closing sales price on the New York Stock Exchange of an Ordinary Share on the last preceding date on which sales were reported prior to the Closing Date.


“Retained Value” shall mean 10% of the sum of (i) the fair market value of all FoA Units held by the Continuing Unitholders immediately following the Closing plus (ii) the product of (x) the number of shares of Class A Common Stock held indirectly by the Continuing Stockholders immediately following the Closing and (y) the Closing Price plus (iii) the present value of the estimated payments to be made by the Company pursuant to the Tax Receivable Agreements plus (iv) the aggregate principal value of notes issued by FoA (or its subsidiaries) (if any) that are distributed to Original Unitholders prior to Closing. Any determinations as to the calculations of the Retained Value will be made by the Administrator in its sole discretion.


“Retained Value per Phantom Unit” shall mean the quotient of (i) the Retained Value, divided by (ii) 1,250.

The Replacement RSUs will have the following terms:


25% of the Replacement RSUs will be vested on the RSU Grant Date (the “Grant Date RSUs”);


The remaining 75% of the Replacement RSUs will vest in equal installments on each of the first three anniversaries of the Closing Date, subject to the participant’s continued employment with a member of the Company Group through the applicable vesting date;


The Grant Date RSUs will be settled on or promptly following the 181st date following the Closing Date;


All other Replacement RSUs will settle promptly following the applicable vesting date (and in any event within two and one-half months following the applicable vesting date);


To the extent such settlement is scheduled to occur at a time when trading by employees of the Company Group in shares of Class A Common Stock is restricted by the Company’s insider trading or similar policy (or a Company imposed “blackout period”) (a “Closed Window”), the Company will settle such Replacement RSUs promptly following the end of the Closed Window to the extent such delay in settlement will not cause adverse tax consequences under Section 409A of the Code; and


Notwithstanding the foregoing, if any fraction of a Replacement RSUs vests, then the actual number of Replacement RSUs to vest will be rounded down to the nearest whole number and any such fraction will be carried forward and be eligible to vest on the next vesting date.


176


Table of Contents

Notwithstanding the foregoing to the contrary, in the event that a participant experiences a termination of employment other than a termination (i) by the applicable member of the Company Group who employs such participant (the “Employer”) for Cause (as defined in the A&R MLTIP) or (ii) by the Participant when grounds for Cause exist, in each case prior, prior to the RSU Grant Date, the Company will issue, or shall cause to be issued, to such participant a number of shares of Class A Common Stock equal to (x) if such termination is a termination of such participant’s employment by the Employer without Cause, by the participant for Good Reason (as defined in the A&R MLTIP), or as a result of the Participant’s death or disability as defined in the A&R MLTIP) (each of the foregoing terminations referred to herein as a “Good Leaver Termination”), the number of shares of Class A Common Stock underlying the Replacement RSUs that such participant would have received had they remained employed with the Employer as of the RSU Grant Date or (y) if such termination is not a Good Leaver Termination, the number of shares of Class A Common Stock underlying the Grant Date RSUs that such Participant would have received had they remained employed with the Employer as of the RSU Grant Date; provided, that in the sole discretion of the Administrator, the obligations to issue shares of Class A Common Stock may be fully or partially satisfied by the Company causing the Employer to make such participant a cash payment equal to the fair market value of all or some portion of the common stock as of the date of the participant’s termination of employment; provided, that no such cash or shares of Class A Common Stock will be paid or issued, as applicable, to such participant prior to the date that is the 181st date following the Closing Date.

In the event that a participant experiences a Good Leaver Termination and such participant holds any unvested Replacement RSUs as of the date of such Good Leaver Termination, such Replacement RSUs will become vested as of such date. Such Replacement RSUs will be settled promptly following the date of such Good Leaver Termination, but in no event earlier than the 181st date following the Closing Date. Notwithstanding anything herein, the Administrator may, in its sole discretion, accelerate the vesting of any Replacement RSUs without the consent of a participant.

Upon the occurrence of an Earnout Date, as applicable, each participant shall receive the right to receive a number of additional shares of Class A Common Stock equal to the product of (i) 900,000 and (ii) a fraction, the numerator of which is the number of Replacement RSUs granted to such participant and the denominator of which is equal to the quotient of (x) the Retained Value divided by (y) the Closing Price (such right to receive shares of Common Stock, the “Earnout Rights”). The Earnout Rights are subject to the same vesting conditions as the Replacement RSUs to which they relate and will settle at the same time as such Replacement RSUs; provided, that to the extent that a Replacement RSU has settled prior to the occurrence of the applicable Earnout Date, any Earnout Rights in respect of such Replacement RSUs will be vested as of the occurrence of the applicable Earnout Date and will be settled promptly following such Earnout Date (or if such Earnout Date occurs during a Closed Window, promptly following the end of such Closed Window). Notwithstanding the foregoing, (x) to the extent that any Replacement RSUs are forfeited on or prior to the occurrence of an Earnout Date, for purposes of calculating such participant’s Earnout Rights with respect to such Earnout Date, the amount in the numerator of the fraction in clause (ii) of the first sentence of this paragraph will be reduced by the number of Replacement RSUs forfeited by such participant on or prior to the applicable Earnout Date and (y) to the extent that the applicable Earnout Date occurs prior to the RSU Grant Date, the participant’s Earnout Rights in respect of such Earnout Date will be issued on the RSU Grant Date and will be reduced to the extent that any Replacement RSUs to be issued to such Participant are not otherwise issued as described above.

The Replacement RSUs (and the associated Earnout Rights) will be issued pursuant to the Incentive Plan and each will be considered a “Substitute Award” for purposes thereof. Notwithstanding anything to the contrary, in the sole discretion of the Administrator, the obligations to issue shares of Class A Common Stock may be fully or partially satisfied by the Company or FoA causing the Employer to make to such participant a cash payment equal to the fair market value of all or some portion of the Class A Common Stock otherwise required to be issued.


177


Table of Contents

Except as described above with respect to a Good Leaver Termination, any outstanding phantom units and unvested Replacement RSUs (and the corresponding Earnout Rights) will be forfeited immediately upon a Participant’s termination of employment for any reason. The participant will be entitled to retain any amounts previously paid or shares of Class A Common Stock issued or transferred to such participant in respect of his or her phantom units or Replacement RSUs (including subsequent Earnout Rights which are due to such participant in respect of Replacement RSUs which are not otherwise forfeited as described above), as applicable, prior to any termination of employment, provided that, if the Company Group terminates the participant’s employment for Cause or such participant has violated any of the restrictive covenants set forth in any confidentiality, non-solicitation, non-competition or similar agreements entered into by the participant and any member of the Company Group, any unrealized Earnout Rights held by such participant shall be forfeited, and the participant (or his or her estate, as applicable) shall be required to repay to the Employer any amounts previously paid in respect of any phantom units or gain realized on Replacement RSUs or Class A Common Stock issued pursuant to the A&R MLTIP, as applicable, held by such participant (as reduced by any taxes paid in connection with the distributions that are not recovered by deduction, credit or otherwise), without further adjustment for earnings, losses or similar items.

As a condition to the receipt of any cash, shares of Class A Common Stock or restricted stock units, as applicable, pursuant to the A&R MLTIP, a participant will be required to agree in writing that such receipt is in full satisfaction of any rights or payments owned to such participant under the A&R MLTIP or the MLTIP and that the Company Group shall be released from any further liability other than its satisfaction of the obligations to make payments pursuant to the A&R MLTIP (the “Release Requirement”).

Notwithstanding any other provision of the A&R MLTIP, the Administrator has the full power and authority to make any adjustments it deems necessary to the extent that there is not an Eligible Distribution on the Closing Date; provided, that no such adjustment shall be effective without the written consent of the Original Unitholders who held a majority of the FoA Units as of immediately following the Pre-Closing Reorganization; provided, further, that any such majority of the Original Unitholders must include each of BTO Urban and Family Holdings.

The obligations of the members of the Company Group to make cash payments and/or deliver shares of Class A Common Stock, whether pursuant to the Replacement RSUs or in connection with the Earnout Right, in each case, under the A&R MLTIP, will be borne economically by the Original Unitholders and any rights to repayment or tax deductions associated therewith will be allocated to the Original Unitholders. In connection therewith, the Original Unitholders have agreed to reserve, and not to transfer, a portion of their FoA Units and shares of Class A Common Stock, as the case may be, for future delivery to FoA in connection with the settlement of awards under the A&R MLTIP.

Each of our named executive officers (other than Anthony W. Villani and Johan Gericke) are participants in the A&R MLTIP. The Eligible Distribution Award to be received by such executives, and the number of Replacement RSUs and Earnout Shares that such executives are eligible to receive (subject to the terms and conditions of the A&R MLTIP) are set forth below.


Named Executive Officer

   Eligible
Distribution
Award
     Replacement RSUs      Earnout Shares
(First Earnout
Achievement Date)
     Earnout Shares
(Second Earnout
Achievement Date)
 

Patricia L. Cook

   $ 2,112,646.54        1,307,195        68,400        68,400  

Graham Fleming

   $ 2,112,646.54        1,307,195        68,400        68,400  

Jeremy Prahm

   $ 1,334,303.08        825,597        43,200        43,200  

Tai A. Thornock

   $
222,383.85
 
    
137,600
 
    
7,200
 
    
7,200


178


Table of Contents

2020 Executive Compensation

The following tables contain compensation information with respect to the named executive officers for 2020. As described above in “Compensation Discussion and Analysis—Executive Summary,” the Company is a newly formed entity and therefore the 2020 compensation presented below in respect of the named executive officers was determined in accordance with policies and practices developed by UFG in respect of services the NEOs provided to UFG and/or its subsidiaries.

Summary Compensation Table

The following table provides summary information concerning compensation to or on behalf of our named executive officers in for the fiscal years indicated.


Name and Principal Position

   Year      Salary
($)(2)
     Bonus
($)(3)
     Non-Equity
Incentive Plan
Compensation
($)
     All Other
Compensation
($)(4)
     Total  

Patricia L. Cook


Chief Executive Officer

     2020        300,000        3,500,000               10,925        3,810,925  
     2019        300,000        850,000               8,400        1,158,400  

Tai A. Thornock


Chief Accounting Officer and Interim Chief Financial Officer

     2020        255,625        750,000               9,532        1,015,157  
     2019        250,000        250,000               8,400        508,400  

Jeremy E. Prahm


Chief Investment Officer

     2020        291,667        3,500,000               8,125        3,799,792  
     2019        250,000        1,000,000               809,302        2,059,302  

Graham A. Fleming


President

     2020        300,000        3,500,000               11,675        3,811,675  
     2019        300,000        850,000               809,302        1,959,302  

Anthony Villani(1)


Chief Legal Officer

     2020        84,918        300,000               83        385,001  


(1)

Mr. Villani was appointed Chief Legal Officer of the Company on October 5, 2020. Mr. Villani’s 2020 salary and annual cash incentive award were prorated for the portion of the fiscal year during which he was employed.

(2)

The amounts in the “Salary” column represent the base salary earned by each named executive officer.

(3)

Amounts reported for 2020 include amounts earned under the Company’s 2020 Annual Cash Incentive Program and, in the case of Ms. Cook and Messrs. Prahm and Fleming, a special cash recognition award of $2 million and Mr. Thornock received a special cash recognition award of $250,000 in the fiscal year of 2020. Bonus amounts earned by each of our named executive officers for 2020 under the Company’s 2020 Annual Cash Incentive Program will be paid on March 15, 2021, subject to continued employment. The terms of the Company’s annual cash incentive program are described more fully above under “—Compensation Discussion and Analysis —Executive Compensation in 2020—Annual Cash Incentive Compensation” above.

(4)

For each NEO other than Messrs. Villani and Thornock, the amounts in the “All Other Compensation” column for 2020 include Company 401(k) matching contributions. In the case of Messrs. Villani and Thornock, amounts include Company 401(k) matching contributions and Company matching contribution to their Health Savings Accounts. Amounts reported for 2019 for Messrs. Prahm and Fleming included an additional $800,902, representing the compensation cost associated with discounted securities purchased from the Company computed in accordance with ASC Topic 718.


179


Table of Contents

Grants of Plan-Based Awards in Fiscal 2020

The following table provides information with respect to grants of plan-based awards to our named executive officers during the 2020 fiscal year.


Name

   Estimated Future Payouts
Under Non-Equity Incentive
Plan Awards
 
   Threshold

($)
    Target

($)
    Maximum

($)
 

Ms. Cook

     (1)      (1)      (1) 

Mr. Prahm

     (1)      (1)      (1) 

Mr. Fleming

     (1)      (1)      (1) 


(1)

In 2020, Ms. Cook, Mr. Prahm and Mr. Fleming received an award of 45, 35 and 25 phantom units under the MLTIP, respectively. The phantom units are accounted for as a profit sharing arrangement under ASC 710 as they do not represent a substantive form of equity and are not indexed to the price of UFG common units. For further discussion of the phantom units, see “—Executive Compensation in 2020—Management Long-Term Incentive Plan” and “—Actions Taken in Connection with the Transaction—Amended and Restated Management Long-Term Incentive Plan” above and “Narrative Disclosure to Summary Compensation Table and Grants of Plan-Based Awards Table—Management Long-Term Incentive Plan” below.

Narrative Disclosure to Summary Compensation Table and Grants of Plan-Based Awards Table

Management Long-Term Incentive Plan

The Company’s MLTIP was established on January 1, 2015 to provide an incentive to key employees to continue in the employment of the Company and to improve the growth and profitability of the Company. UFG adopted the A&R MLTIP, effective as of the date the Transaction Agreement was executed. The remainder of this discussion summarizes certain terms of the MLTIP. For further discussion of the A&R MLTIP, see “—Actions Taken in Connection with the Transactions—Amended and Restated Management Long-Term Incentive Plan” above.

Under the MLTIP, our Board (or such other committee of our Board as may be appointed to administer the MTLIP) (the “Administrator”) has granted certain participants, including each of the NEOs, phantom units which entitle the holder to payment of amounts equal to a certain portion of (i) distributions (other than tax distributions unless otherwise determined by the Administrator) in respect of the membership interests of the Company’s common units and (ii) the receipt of cash by the holders of the Company’s common units in connection with a Sale of the Company (as defined in the MLTIP), in each case, to the extent that such distributions or cash receipts exceed, in the aggregate, a specified hurdle amount equal to the sum of (x) $250,000,000, (y) any capital contributions made to the Company after January 1, 2015, and (z) an amount equal to a fifteen percent (15%) return on capital contributions made to the Company after January 1, 2015, compounded annually (such distributions, “Eligible Distributions”).

To be eligible to receive payments under the MLTIP, the applicable holder must remain employed with the Company or its subsidiaries on the applicable payment dates, with one-third of such amounts being paid to the phantom unit holders promptly following the Eligible Distribution and on each of the first and second anniversaries of the Eligible Distribution. Other than the potential payments that may occur in connection with certain termination events, as described under “—Potential Payments Upon Termination or Change-in-Control—Management Long-Term Incentive Plan,” phantom units granted pursuant to the MLTIP will be forfeited upon a termination of the holder’s employment for any reason; provided, that a holder’s continued employment with a purchaser (or its affiliates) of a Company subsidiary which ceases to be a subsidiary a result of a sale, divestiture,


180


Table of Contents

spin off, or other similar transaction (other than a sale of all or substantially all of the assets of the Company) will constitute continued employment for purposes of the MLTIP if (x) the purchased Company subsidiary was a subsidiary of the Company on January 1, 2016, or (y) if the Administrator, in its sole discretion, determines such continued employment with the purchaser or its affiliates will constitute continued employment for purposes of the MLTIP. Notwithstanding the foregoing, any amounts to be paid in respect of the phantom units shall be forfeited if, at the time of such payment, the aggregate capital contributions to the Company by common unit holders exceeds the aggregate amount of distributions made by the Company to common unit holders. Payments to phantom unit holders under the MLTIP can be made in cash, common units, other equity securities or property or any combination thereof in the sole discretion of the Administrator.

In connection with an initial underwritten public offering of the Company or any of its subsidiary’s equity securities, the Administrator may terminate the MLTIP so long as the Company delivers to each holder of then-outstanding phantom units, a number of shares of common stock of the entity subject to such public offering with a fair market value (as determined based on the initial pricing of such public offering) equal to the amount that would have been distributed to such holder assuming a hypothetical liquidation of the Company using an equity valuation implied by the per-share public offering price. In connection with such termination of the MLTIP, any partial shares deliverable to a holder of phantom units may be settled in cash in the discretion of the Administrator and any shares received by the holders of phantom units would be subject to underwriter or similar lock-ups as may be determined by the Administrator in its sole discretion.

Clawback. Phantom unit holders will be entitled to retain any amounts previously paid in respect of his or her phantom units prior to any termination of employment; provided, that if the phantom unit holder’s employment is terminated for “Cause” (as defined in the MLTIP) or if the holder breaches any applicable restrictive covenants (including any confidentiality, non-solicitation, or non-competition covenants contained in any agreement between the holders and the Company), the holder (or his or her beneficiary, as applicable) will be required to repay to the Company any after-tax proceeds received in respect of the phantom units.

Restrictive Covenants. In connection with the grant of phantom units under the MLTIP, participants, including each of our NEOs, are required to agree to an indefinite confidentiality covenant and a covenant not to solicit the employees of the Company during the term of the holder’s employment and for the one-year period (two-year period for Ms. Cook and Mr. Fleming) following the termination of such employment.

Outstanding Equity Awards at 2020 Fiscal Year-End

There were no equity awards outstanding as of December 31, 2020.

Option Exercises and Stock Vested in Fiscal 2020

There were no shares that vested or stock options exercised by the named executive officers in fiscal year 2020.

Pension Benefits and Nonqualified Deferred Compensation

Our named executive officers do not participate in any pension or nonqualified deferred compensation plans and received no pension benefits or nonqualified deferred compensation during the year ended December 31, 2020.

Potential Payments and Benefits upon Termination or Change in Control

The Company entered into a salary continuation agreement with Patricia L. Cook on March 7, 2016, which provides the Company the option to pay Ms. Cook her regular salary and any benefits (excluding bonus or other incentive compensation) for a period of the Company’s choosing (not to exceed 12 months from the date of


181


Table of Contents

termination) in exchange for Ms. Cook’s agreement to abide by certain restrictive covenants, including non-competition, non-solicitation and confidentiality provisions. The agreement would be triggered by her voluntary separation from the Company and not by any other type of separation. Accordingly, had Ms. Cook resigned as of December 31, 2020 and the Company elected to exercise its rights under the salary continuation agreement for the maximum twelve month period, Ms. Cook would have been entitled to an aggregate payment of $305,824, representing her $300,000 base salary at the time of resignation and $5,824 in benefit continuation payments.

The Company entered into a salary continuation agreement with Jeremy E. Prahm on December 2, 2015, which provides the Company the option to pay Mr. Prahm his regular salary and any benefits (excluding bonus or other incentive compensation) for a period of the Company’s choosing (not to exceed 6 months from the date of termination) in exchange for Mr. Prahm’s agreement to abide by certain restrictive covenants, including noncompetition, non-solicitation and confidentiality provisions. The agreement would be triggered by his voluntary separation from the Company and not by any other type of separation. Accordingly, had Mr. Prahm resigned as of December 31, 2020 and the Company elected to exercise its rights under the salary continuation agreement, Mr. Prahm would have been entitled to an aggregate payment of $150,000, representing six months of his $300,000 base salary at the time of resignation.

None of our other named executive officers are party to any arrangement that provides for severance benefits.

Management Long-Term Incentive Plan

In the event a named executive officer’s employment is terminated by the Company without “Cause,” by the holder for “Good Reason” or by reason of the named executive officer’s death or disability (in each case, as defined in the MLTIP) (each such termination of employment, a “Good Leaver Termination”), the named executive officer will be entitled to receive any unpaid amounts in respect of Eligible Distributions that occurred prior to the date of the Good Leaver Termination, with any unpaid amounts to be paid promptly following the date of termination (and in no event later than March 15 of the calendar year following the calendar year of the termination). As of December 31, 2020, there were no Eligible Distributions with respect to the phantom units, and accordingly, no accelerated payments would have been made on the phantom units had a Good Leaver Termination occurred on December 31, 2020. Had a Sale of the Company (as defined in the MLTIP) occurred on December 31, 2020, we have assumed that the named executive officers would have been entitled to the following payments since the value of our business had appreciated to a level that would have resulted in an Eligible Distribution as of the date of the Company’s most recent valuation prior to December 31, 2020: Ms. Cook, $5,019,561; Mr. Thornock, $528,375; Mr. Prahm, $3,170,249 and Mr. Fleming $5,019,561. Had a Good Leaver Termination occurred on December 31, 2020 in connection with a Sale of the Company, we have assumed that the named executive officer’s would have been entitled to the following additional payments, reflecting the acceleration of the remaining two-thirds of the payments to be made in respect of such Eligible Distribution that would have otherwise been paid on each of the first and second anniversaries of the Eligible Distribution: Ms. Cook, $10,039,122; Mr. Thornock, $1,056,750; Mr. Prahm, $6,340,498 and Mr. Fleming $10,039,122. Mr. Villani would not have been entitled to any payments under the scenarios described above, as he did not own any phantom units as of December 31, 2020.

Director Compensation

Other than Mr. Libman, none of our directors received any cash or equity compensation in 2020. None of our directors receive separate compensation for attending meetings of our Board of Directors or any committees thereof. All directors are reimbursed for travel and other expenses directly related to director activities and responsibilities. We also provide Mr. Libman with office space and administrative support in connection with his duties as Chairman.

The following table summarizes the compensation paid to or earned by Mr. Libman in 2020.


182


Table of Contents

2020 DIRECTOR COMPENSATION


Name

   Fees Earned
or Paid
in Cash
($)
     Non-Equity
Incentive Plan
Compensation
($)
     All Other
Compensation
($)(1)
     Total
($)
 

Brian L. Libman

     500,000        0        1,510,300        2,010,300  


(1)

Amount includes (1) $10,300 in Company 401(k) matching contributions and (2) a $1,500,000 discretionary bonus Mr. Libman received in recognition of his role in overseeing the strategic direction of the Company. For further discussion of the Company’s Annual Incentive Compensation Programs, see “Executive Compensation in 2020—Annual Incentive Compensation” above.


183


Table of Contents

CERTAIN RELATIONSHIPS AND RELATED PERSON TRANSACTIONS

Unless the context otherwise requires, all references in this section to “we,” “us,” “our” or the “Company” refer to the Company and its consolidated subsidiaries.

Stockholders Agreement

In connection with the Business Combination, concurrently with the Closing, the Company and certain pre-Closing equityholders of FoA entered into a Stockholders Agreement (the “Stockholders Agreement”). Pursuant to the Stockholders Agreement, each of certain funds affiliated with The Blackstone Group Inc. (“Blackstone,” and such funds, the “Blackstone Investors”) and an entity controlled by Brian L. Libman (Brian L. Libman and certain entities controlled by him, the “BL Investors” and, together with the Blackstone Investors, the “Principal Stockholders”) are entitled to nominate a certain number of directors to the Board, based on each such holder’s ownership of the voting securities of the Company. The nomination rights of each Principal Stockholder are substantially identical and subject to the same terms, conditions and requirements. The number of directors that each of the Blackstone Investors and the BL Investors will separately be entitled to designate to the Board increases and/or decreases on a sliding scale such that, for example, if the Blackstone Investors or the BL Investors, as the case may be, hold more than 40% of the outstanding shares of Class A Common Stock, assuming a full exchange of all FoA Units for the publicly traded Class A Common Stock, such applicable investors will be entitled to designate the lowest whole number of directors that is greater than 40% of the members of the Board; if the Blackstone Investors or the BL Investors, as the case may be, hold between 30% and 40% of such outstanding shares, such applicable investors will be entitled to designate the lowest whole number of directors that is greater than 30% of the members of the Board; if the Blackstone Investors or the BL Investors, as the case may be, hold between 20% and 30% of such outstanding shares, such applicable investors will be entitled to designate the lowest whole number of directors that is greater than 20% of the members of the Board; and if the Blackstone Investors or the BL Investors, as the case may be, hold between 5% and 20% of such outstanding shares, such applicable investors will be entitled to designate the lowest whole number of directors that is greater than 10% of the members of the Board).

Furthermore, pursuant to the Stockholders Agreement and subject to certain exceptions as set forth therein, for a period of 180 days following the Closing, each Principal Stockholder will not, and will cause any other holder of record of any of such Principal Stockholder’s Company securities not to, transfer any of such Principal Stockholder’s Company securities, other than any such securities purchased pursuant to the PIPE Agreements or on the open market.

The Stockholders Agreement also provide each Principal Stockholder with basic information and management rights, as well as detailed venture capital operating company covenants. In addition, the Stockholders Agreement permits the Company’s Principal Stockholders to assign their rights and obligations under the agreement, in whole or in part, without the Company’s prior written consent. Furthermore, the Stockholders Agreement also requires the Company to cooperate with the Principal Stockholders in connection with certain future pledges, hypothecations, grants of security interest in or transfers (including to third party investors) of any or all of the FoA Units held by the Principal Stockholders, including to banks or financial institutions as collateral or security for loans, advances or extensions of credit.

Unless earlier terminated by agreement of the Principal Stockholders and the Board, the Stockholders Agreement will terminate as to each Principal Stockholder at such time as such Principal Stockholder and its affiliates collectively hold less than 5% of the outstanding shares of Class A Common Stock, assuming a full exchange of all FoA Units for the publicly traded Class A Common Stock. In addition, prior to the closing of the Business Combination, the Blackstone Investors and the BL Investors entered into a letter agreement pursuant to which the Blackstone Investors and the BL Investors agreed, among other things, to permit the Blackstone Investors to have priority over the BL Investors with respect to certain sales notwithstanding the terms of the Stockholders Agreement or the Registration Rights Agreement, which is included as Exhibit 2.4 to this prospectus and is incorporated herein by reference.


184


Table of Contents

Exchange Agreement

In connection with the Business Combination, concurrently with the Closing, the Company, FoA and the Continuing Unitholders entered into an Exchange Agreement (the “Exchange Agreement”). The Exchange Agreement sets forth the terms and conditions upon which holders of FoA Units may exchange their FoA Units for shares of Class A Common Stock on a one-for-one basis, subject to customary conversion rate adjustments for stock splits, stock dividends and reclassifications. Each holder of FoA Units (other than the Company and its subsidiaries), and certain permitted transferees thereof, may on a quarterly basis (subject to the terms of the Exchange Agreement) exchange their FoA Units for shares of Class A Common Stock. In addition, subject to certain requirements, the Blackstone Investors and the BL Investors are generally be permitted to exchange FoA Units for shares of Class A Common Stock provided that the number of FoA Units surrendered in such exchanges during any 30-calendar day period represent, in the aggregate, greater than 2% of total interests in partnership capital or profits. Any Class A Common Stock received by the Blackstone Investors or the BL Investors in any such exchange during the applicable restricted periods would be subject to the lock-up agreements entered into in connection with the Business Combination. The Company may impose restrictions on exchange that it determines to be necessary or advisable so that the Company is not treated as a “publicly traded partnership” for U.S. federal income tax purposes. As a holder exchanges FoA Units for shares of Class A Common Stock, the voting power afforded to such holder of FoA Units by their shares of Class B Common Stock is automatically and correspondingly reduced and the number of FoA Units held by the Company is correspondingly increased as it acquires the exchanged FoA Units. For example, if a holder of Class B Common Stock holds 1,000 FoA Units as of the record date for determining stockholders of the Company that are entitled to vote on a particular matter, such holder will be entitled by virtue of such holder’s Class B Common Stock to 1,000 votes on such matter. If, however, such holder were to hold 500 FoA Units as of the relevant record date, such holder would be entitled by virtue of such holder’s Class B Common Stock to 500 votes on such matter.

Registration Rights Agreement

In connection with the Business Combination, concurrently with the Closing, the Company and the Principal Stockholders entered into a Registration Rights Agreement (the “Registration Rights Agreement”). Pursuant to the Registration Rights Agreement, upon the demand of any Principal Stockholder, the Company will be required to facilitate a non-shelf registered offering of the Company’s shares requested by such Principal Stockholder to be included in such offering. Any demanded non-shelf registered offering may, at the Company’s option, include Company shares to be sold by the Company for its own account and will also include registrable shares to be sold by holders that exercise their related piggyback rights in accordance with the Registration Rights Agreement. Within 90 days after receipt of a demand for such registration, the Company will be required to use its reasonable best efforts to file a registration statement relating to such demand. In certain circumstances, Principal Stockholders will be entitled to piggyback registration rights in connection with the demand of a non-shelf registered offering.

In addition, the Registration Rights Agreement entitles the Principal Stockholders to demand and be included in a shelf registration when the Company is eligible to sell its Company shares in a secondary offering on a delayed or continuous basis in accordance with Rule 415 of the Securities Act. Within 45 days (in the case of a shelf registration on Form S-1) or 30 days (in the case of a shelf registration on Form S-3) after receipt of a demand for such registration, the Company will be required to use its reasonable best efforts to file a registration statement relating to such demand. Moreover, upon the demand of a Principal Stockholder, the Company will be required to facilitate in the manner described in the Registration Rights Agreement a “takedown” off of an effective shelf registration statement of registrable shares requested by such Principal Stockholder.

The Registration Rights Agreement also provides that the Company will pay certain expenses relating to such registrations and indemnify the registration rights holders against (or make contributions in respect of) certain liabilities which may arise under the Securities Act.


185


Table of Contents

Tax Receivable Agreements

In connection with the Business Combination, concurrently with the Closing, the Company entered into a Tax Receivable Agreement with certain funds affiliated with Blackstone (the “Blackstone Tax Receivable Agreement”) and a Tax Receivable Agreement with certain other members of FoA (the “FoA Tax Receivable Agreement,” and collectively with the Blackstone Tax Receivable Agreement, the “Tax Receivable Agreements”). The Tax Receivable Agreements generally provide for the payment by the Company to certain owners of FoA prior to the Business Combination (the “TRA Parties”) of 85% of the cash tax benefits, if any, that the Company is deemed to realize (calculated using certain simplifying assumptions) as a result of (i) tax basis adjustments as a result of sales and exchanges of units in connection with or following the Business Combination and certain distributions with respect to units, (ii) the Company’s utilization of certain tax attributes attributable to Blocker or the Blocker Shareholders, and (iii) certain other tax benefits related to entering into the Tax Receivable Agreements, including tax benefits attributable to making payments under the Tax Receivable Agreements. These tax basis adjustments generated over time may increase (for tax purposes) the depreciation and amortization deductions available to the Company and, therefore, may reduce the amount of U.S. federal, state and local tax that the Company would otherwise be required to pay in the future, although the IRS may challenge all or part of the validity of that tax basis, and a court could sustain such challenge. The tax basis adjustments upon sales or exchanges of units for shares of Class A Common Stock and certain distributions with respect to units may also decrease gains (or increase losses) on future dispositions of certain assets to the extent tax basis is allocated to those assets. Actual tax benefits realized by the Company may differ from tax benefits calculated under the Tax Receivable Agreements as a result of the use of certain assumptions in the Tax Receivable Agreements, including the use of an assumed weighted-average state and local income tax rate to calculate tax benefits. The payment obligation under the Tax Receivable Agreements is an obligation of the Company and not of FoA. The Company will generally retain the benefit of the remaining 15% of these cash tax benefits.

For purposes of the Tax Receivable Agreements, the cash tax benefits will be computed by comparing the actual income tax liability of the Company to the amount of such taxes that the Company would have been required to pay had there been no tax basis adjustments of the assets of FoA as a result of sales or exchanges or certain distributions with respect to the units, no utilization of certain tax attributes attributable to the Blocker or the Blocker Shareholders, and had the Company not entered into the Tax Receivable Agreements. The actual and hypothetical tax liabilities determined in the Tax Receivable Agreements will be calculated using the actual U.S. federal income tax rate in effect for the applicable period and an assumed, weighted-average state and local income tax rate based on apportionment factors for the applicable period (along with the use of certain other assumptions). The term of the Tax Receivable Agreements will continue until all such tax benefits have been utilized or expired, unless the Company exercises its right to terminate the Tax Receivable Agreements early, certain changes of control occur, or the Company breaches any of its material obligations under either the Blackstone Tax Receivable Agreement or the FoA Tax Receivable Agreement, in which case all obligations generally will be accelerated and due as if the Company had exercised its right to terminate the Tax Receivable Agreements (as described below).

Estimating the amount of payments that may be made under the Tax Receivable Agreements is by its nature imprecise, insofar as the calculation of amounts payable depends on a variety of factors, including:


the timing of sales or exchanges—for instance, the increase in any tax deductions will vary depending on the fair market value, which may fluctuate over time, of the depreciable or amortizable assets of FoA at the time of each sale or exchange;


the price of shares of the Company’s Class A Common Stock at the time of the sale or exchange—the increase in any tax deductions, as well as the tax basis increase in other assets of FoA, is directly proportional to the price of shares of Class A Common Stock at the time of each sale or exchange;


186


Table of Contents
   

the extent to which such sales or exchanges do not result in a basis adjustment—if a sale or an exchange does not result in an increase to the existing basis, increased deductions will not be available;


the amount of tax attributes—the amount of applicable tax attributes attributable to the Blocker or the Blocker Shareholders will impact the amount and timing of payments under the Tax Receivable Agreements;


changes in tax rates—payments under the Tax Receivable Agreements will be calculated using the actual U.S. federal income tax rate in effect for the applicable period and an assumed, weighted-average state and local income tax rate based on apportionment factors for the applicable period, so changes in tax rates will impact the magnitude of cash tax benefits covered by the Tax Receivable Agreements and the amount of payments under the Tax Receivable Agreements; and


the amount and timing of our income—the Company is obligated to pay 85% of the cash tax benefits under the Tax Receivable Agreements as and when realized. If the Company does not have taxable income, the Company is not required (absent a change of control or other circumstances requiring an early termination payment) to make payments under the Tax Receivable Agreements for a taxable year in which it does not have taxable income because no cash tax benefits will have been realized. However, any tax attributes that do not result in realized benefits in a given tax year will likely generate tax attributes that may be utilized to generate benefits in previous or future tax years. The utilization of such tax attributes will result in cash tax benefits that will result in payments under the Tax Receivable Agreements.

As a result of the size of the anticipated tax basis adjustment of the tangible and intangible assets of FoA and the Company’s possible utilization of certain tax attributes, the payments that the Company may make under the Tax Receivable Agreements are expected to be substantial. There may be a material negative effect on our liquidity if, as a result of timing discrepancies or otherwise, the payments under the Tax Receivable Agreements exceed the actual cash tax savings that the Company realizes in respect of the tax attributes subject to the Tax Receivable Agreements and/or distributions to the Company by FoA are not sufficient to permit the Company to make payments under the Tax Receivable Agreements after it has paid taxes. Late payments under the Tax Receivable Agreements generally will accrue interest at an uncapped rate equal to LIBOR plus 500 basis points. The payments under the Tax Receivable Agreements are not conditioned upon continued ownership of the Company or FoA by the Continuing Unitholders.

If the Company exercises its right to terminate the Tax Receivable Agreements or in the case of a change in control of the Company or a material breach of the Company’s obligations under either the Blackstone Tax Receivable Agreement or the FoA Tax Receivable Agreement, all obligations under the Tax Receivable Agreements will be accelerated and the Company will be required to make a payment to the TRA Parties in an amount equal to the present value of future payments under the Tax Receivable Agreements, which payment would be based on certain assumptions, including an assumption that any FoA Units that have not been exchanged are deemed exchange for the market value of Class A Common Stock at the time of the termination or the change of control and an assumption the Company would have sufficient taxable income to fully utilize all potential future tax benefits that are subject to the Tax Receivable Agreements. As a result of the foregoing, (i) the Company could be required to make cash payments to the TRA Parties that are greater than the specified percentage of the actual benefits the Company ultimately realizes in respect of the tax benefits that are subject to the Tax Receivable Agreements, and (ii) the Company would be required to make a cash payment equal to the present value of the anticipated future tax benefits that are the subject of the Tax Receivable Agreements, which payment may be made significantly in advance of the actual realization, if any, of such future tax benefits. In these situations, the Company’s obligations under the Tax Receivable Agreements could have a substantial negative impact on its liquidity and could have the effect of delaying, deferring or preventing certain mergers, asset sales, other forms of business combination, or other changes of control due to the additional transaction costs a potential acquirer may attribute to satisfying such obligations. If the Company were to elect to terminate


187


Table of Contents

the Tax Receivable Agreements immediately after the Business Combination, (i) assuming the market value of a share of Class A Common Stock is equal to the FoA Units Cash Consideration paid per FoA Unit in connection with the Business Combination, (ii) assuming that 19,753,406 Public Shareholders exercised their right to have their Ordinary Shares redeemed on completion of the Business Combination, (iii) taking into account the effects of any cash payments paid under the A&R MLTIP in connection with the Business Combination (but disregarding the effects of any issuance of Replacement RSUs or Class A Common Stock pursuant to the A&R MLTIP or any payments that may be made pursuant to the A&R MLTIP that are not paid in connection with the Closing), and (iv) disregarding the effects of the issuance of any Earnout Securities, the Company currently estimates that it would be required to pay approximately $426.7 million to satisfy its total liability.

Decisions made by certain of the TRA Parties in the course of running our business may influence the timing and amount of payments that are received by an exchanging or selling existing owner under the Tax Receivable Agreements. For example, the earlier disposition of assets following an exchange or acquisition transaction generally will accelerate payments under the Tax Receivable Agreements and increase the present value of such payments, and the disposition of assets before an exchange or acquisition transaction will increase a TRA Party’s tax liability without giving rise to any rights of a TRA Party to receive payments under the Tax Receivable Agreements.

Payments under the Tax Receivable Agreements will be based on the tax reporting positions that we will determine. The Company will not be reimbursed for any cash payments previously made to the TRA Parties pursuant to the Tax Receivable Agreements if any tax benefits initially claimed by the Company are subsequently challenged by a taxing authority and are ultimately disallowed. Instead, any excess cash payments made by the Company to a TRA Parties will be netted against any future cash payments that the Company might otherwise be required to make under the terms of the Tax Receivable Agreements. As a result, it is possible that the Company could make cash payments under the Tax Receivable Agreements that are substantially greater than its actual cash tax savings.

FoA Amended and Restated Limited Liability Company Agreement

In connection with the Business Combination, immediately prior to the Closing, FoA adopted an Amended and Restated Limited Liability Company Agreement (the “A&R LLC Agreement”). In connection with the adoption of the A&R LLC Agreement, all equity interests of FoA as of immediately prior to the Closing were reclassified into a single class of unitized equity interests designated as FoA Units.

Pursuant to the A&R LLC Agreement, the Company has the sole right to appoint all of the managers of FoA. The board of managers has the right to determine when distributions will be made to the members of FoA and the amount of any such distributions. If the board of managers authorizes a distribution, such distribution will be made to the holders of FoA Units pro rata in accordance with the percentages of their respective FoA Units held. The A&R LLC Agreement provides for tax distributions to the holders of FoA Units if the board of managers determines that a holder, by reason of holding FoA Units, incurs an income tax liability. These tax distributions are computed based on the board of managers’ estimate of the net taxable income of FoA multiplied by an assumed tax rate equal to the highest effective marginal combined United States federal, state and local income tax rate prescribed for an individual (or, if greater, a corporation) resident in California or New York, New York (whichever is higher), taking into account the deductibility of certain expenses and any limitations thereof and the character of FoA’s income.

The A&R LLC Agreement also provides that substantially all expenses incurred by or attributable to the Company, but not including obligations incurred under the Tax Receivable Agreements by the Company, income tax expenses of the Company and payments on indebtedness incurred by the Company, will be borne by FoA.


188


Table of Contents

Finance of America Commercial Holdings LLC

Prior to the Closing, B2R, an affiliate of the Blackstone Investors, owned the CRNCI in Finance of America Commercial Holdings LLC, consisting of Class B Units representing a 25% economic interest in the entity, with our wholly owned subsidiary holding the remaining 75% interest. The Class B Units were entitled to certain priority distributions of income until certain return hurdles had been achieved. Pursuant to the operating agreement of Finance of America Commercial Holdings LLC (the “FACo Holdings Agreement”), Finance of America Holdings LLC (“FAH”) had an option to redeem the Class B Units upon the occurrence of certain events. In connection with the closing of the Business Combination, FoA caused FAH to exercise its right under the FACo Holdings Agreement to purchase all of the Class B Units held by B2R for a purchase price of $203.2 million taking into account, among other things, the hurdle amount, prior advances made on behalf of the related unitholders and other terms of the FACo Holdings Agreement. As of December 31, 2020, the hypothetical liquidation at book value of the Class B Units was $166.2 million. See Note 2, Summary of Significant Accounting Policies, and Note 25, Changes in Contingently Redeemable Noncontrolling Interest, to the interim unaudited consolidated financial statements of FoA, which is included in “Index to Financial Statements” in this prospectus for additional information.

Other Transactions

In June 2019, the Company executed two Revolving Working Capital Promissory Notes (the “BX-BL Promissory Notes”) with the Blackstone Investors (the “BX Note”) and a BL Investor (the “BL Note”). The BX-BL Promissory Notes were structured with simultaneous draw and paydown terms and secured by certain tangible assets of UFG. The BX-BL Promissory Notes accrued interest monthly at a rate of 10.0% per annum with maturity dates in June 2020. The BX Note was paid in full in June 2020. The Company extended the maturity of the BL Note to July 2020. The BL Note was paid in full in July 2020 in connection with its maturity.

We have entered into various commercial agreements with TORO Holdings Trust, Blackstone Residential Operating Partnership and related entities (collectively, “TORO”) that are portfolio companies of investment funds affiliated with Blackstone in the ordinary course of our business, including the following transactions:


We sold mortgage and commercial loans to TORO with aggregate unpaid principal balances of $168.7 million, $85.8 million and $245.7 million with realized gains of $7.9 million, $2.9 million and $6.3 million for the years ended December 31, 2020, 2019 and 2018, respectively.


Toro has acted as a mezzanine and warehouse lender for us since 2017. Our borrowings totaled $21.5 million, $49.9 million and $25.2 million for the years ended December 31, 2020, 2019 and 2018, respectively. We incurred related interest expense totaling $4.1 million, $4.4 million and $3.8 million for the years ended December 31, 2020, 2019 and 2018, respectively.


Incenter acted as REIT Advisor to manage certain assets of TORO, receiving revenues of $1.3 million in 2018.


In September 2020, we purchased securitized notes of $15.9 million and residual interest of $5.7 million from TORO in an optional redemption of a securitization of loans we had previously originated and sold to TORO in 2016 and 2017. As part of the optional redemption, we paid off notes with an outstanding principal balance of $122.7 million.

We leased office space in Westport, Connecticut in a building that is owned by an entity affiliated with the BL Investors. The lease terminated on December 31, 2020. We paid $0.1 million and $0.1 million in aggregate rent and common areas maintenance charges under this lease agreement during each of year ended December 31, 2020 and the year ended December 31, 2019, respectively.


189


Table of Contents

On November 5, 2020, Finance of America Funding LLC issued $350.0 million aggregate principal amount of 7.875% senior unsecured notes due 2025. The 7.875% senior unsecured notes are fully and unconditionally guaranteed, jointly and severally, on a senior unsecured basis by FoA and each of FoA’s material existing and future wholly-owned domestic subsidiaries (other than Finance of America Funding LLC and subsidiaries that cannot guarantee the notes for tax, contractual or regulatory reasons). Approximately $300 million of the net proceeds of the senior unsecured notes offering is being used to fund a distribution to FoA’s owners, with which certain of FoA’s existing owners or their affiliated entities, including Blackstone and Brian L. Libman, FoA’s founder and chairman, purchased notes in the offering in an aggregate principal amount of $85 million, and the remaining net proceeds, after offering expenses, are being retained for growth and general corporate purposes. Mr. Libman also purchased an additional $50 million of senior unsecured notes. Blackstone Securities Partners L.P., an affiliate of the Blackstone Investors served as an initial purchaser to the 7.875% senior unsecured notes due 2025 and received a customary fee.

The Company entered into the Company PIPE Agreements with the BL Investors and the Blackstone Investors, pursuant to which the BL Investors purchased 1,380,247 shares of Class A Common Stock for a purchase price of $10.00 per share, totaling $13.8 million, and the Blackstone Investors purchased 2,919,753 shares of Class A Common Stock for a purchase price of $10.00 per share, totaling $29.2 million.

We entered into an agreement with Blackstone Securities Partners L.P., an affiliate of the Blackstone Investors, pursuant to which Blackstone Securities Partners L.P. provided us with capital markets and financial advisory services in connection with the Business Combination for a fee of $750,000, paid upon the Closing.

On December 3, 2020, the Company entered into a $200.0 million nonrevolving facility commitment with the Blackstone Investors and the BL Investors. Repayment of amounts drawn from the facility are repaid from operating cash flows, which are determined based on net cash flows from certain identified MSRs. As of December 31, 2020, the Company had an outstanding advance of $14.9 million against this commitment for the purchase of MSRs with a fair value of $14.1 million.

We sold 49, 49 and 123 commercial mortgages for aggregate purchase prices of $73.2 million, $89.0 million and $186.3 million to Fidelity & Guaranty Life Insurance Company, an affiliate of the Blackstone Investors, in the ordinary course of business during the years ended December 31, 2020, 2019 and 2018, respectively.

Blackstone and its affiliates have ownership interests in a broad range of companies. We have entered and may in the future enter into commercial transactions in the ordinary course of our business with some of these companies, including the sale of goods and services and the purchase of goods and services. None of these transactions or arrangements has been or is expected to be material to us.

Statement of Policy Regarding Transactions with Related Persons

The Company has adopted a formal written policy that providing that persons meeting the definition of “Related Person” under Item 404(a) of Regulation S-K such as the Company’s executive officers, directors, nominees for election as directors, beneficial owners of more than 5% of any class of the Company’s capital stock and any member of the immediate family of any of the foregoing persons are not permitted to enter into a related party transaction with the Company without the approval of the Company’s audit committee, subject to the exceptions described below.

A related person transaction is a transaction, arrangement or relationship, or any series of similar transactions, arrangements or relationships that would be required to be disclosed pursuant to Item 404(a) of Regulation S-K, in which the Company and any related person are, were or will be participants in which the amount involves exceeds $120,000, and in which a related person had or will have a direct or indirect material interest. Transactions involving compensation for services provided to the Company as an employee or director and certain other transactions not required to be disclosed under Item 404(a) of Regulation S-K are not covered by this policy.


190


Table of Contents

Under the policy, the Company will review information that the Company deems reasonably necessary to enable the Company to identify any existing or potential related person transactions and to effectuate the terms of the policy. In addition, under the Code of Conduct, employees and directors have an affirmative responsibility to disclose any transaction or relationship that reasonably could be expected to give rise to a conflict of interest.

Indemnification of Directors and Officers

The A&R Bylaws provide that the Company will indemnify its directors and officers to the fullest extent permitted by the DGCL. In addition, the A&R Charter provides that the Company’s directors will not be liable for monetary damages for breach of fiduciary duty to the fullest extent permitted by the DGCL.

There is no pending litigation or proceeding naming any of the Company’s directors or officers to which indemnification is being sought, and the Company is not aware of any pending or threatened litigation that may result in claims for indemnification by any director or officer.


191


Table of Contents

PRINCIPAL SECURITYHOLDERS

The following table sets forth information regarding the beneficial ownership of shares of the Company’s Class A Common Stock by:


each person known to the Company to be the beneficial owner of more than 5% of the shares of any class of the Company’s common stock;


each named executive officer or director of the Company; and


all officers and directors of the Company as a group.

Beneficial ownership is determined according to the rules of the SEC, which generally provide that a person has beneficial ownership of a security if he, she or it possesses sole or shared voting or investment power over that security, including options and warrants that are currently exercisable or exercisable within 60 days.

The beneficial ownership of the shares of Class A Common Stock of the Company is based on 64,140,214 shares outstanding following the Closing, consisting of 59,881,714 vested shares and 4,258,500 unvested shares that are subject to vesting and forfeiture.

The beneficial ownership information below includes 4,258,500 shares of Class A Common Stock held by the Sponsor that are subject to vesting and forfeiture will not be entitled to receive any dividends or other distributions, or to have any other economic rights until such shares are vested, and such shares will not be entitled to receive back dividends or other distributions or any other form of economic “catch-up” once they become vested. Additionally, for so long as they remain unvested, such shares must be voted proportionately with all other shares of Class A Common Stock and Class B Common Stock on all matters put to a vote of holders of the Company’s voting stock (i.e., holders of unvested shares will have no discretion in how such shares are voted).

The beneficial ownership information below excludes the shares underlying the Warrants, the Earnout Securities and the shares expected to be issued or reserved under the Incentive Plan.

Unless otherwise indicated, we believe that all persons named in the table have sole voting and investment power with respect to all shares beneficially owned by them. Unless otherwise noted, the business address of each of the following entities or individuals is 909 Lake Carolyn Parkway, Suite 1550, Irving, Texas 75039.


     Beneficial Ownership  

Name of
Beneficial Owner

   Shares of
Class A
Common
Stock(1)
     Post-Merger
FoA Units(1)
     % of Total
Voting
Power(2)
 

Five Percent Holders:


Blackstone(3)( 4)

     25,100,873        50,966,826        38.9

Edmond Safra(5)(6)

     11,222,500        —          5.7

Named Executive Officers and Directors:


Brian L. Libman(3)(7)

     1,380,247        74,975,251        39.1

Patricia L. Cook(8)

     745,392        —          *  

Menes Chee(9)

     —          —          —    

Norma C. Corio

     —          —          —    

Robert W. Lord

     —          —          —    

Tyson A. Pratcher

     —          —          —    

Lance N. West(10)

     700,000        —          *  

Graham Fleming(11)

     1,668,538        —          *  


192


Table of Contents
     Beneficial Ownership  

Name of
Beneficial Owner

   Shares of
Class A
Common
Stock(1)
     Post-Merger
FoA Units(1)
     % of Total
Voting
Power(2)
 

Jeremy Prahm(12)

     710,932        —          *  

Johan Gericke

     —          —          —    

Tai A. Thornock(13)

     34,400        —          *  

Anthony W. Villani

     —          —          —    

All Directors and Executive Officers as a Group (12 persons)

     5,239,509        74,975,251        41.0


*

Represents less than 1%.

(1)

Subject to the terms of the Exchange Agreement, the FoA Units are exchangeable for shares of the Company’s Class A Common Stock on a one-for-one basis. Beneficial ownership of FoA Units reflected in this table has not been also reflected as beneficial ownership of shares of the Company’s Class A Common Stock for which such FoA Units may be exchanged.

(2)

Represents percentage of voting power of the the Company’s Class A Common Stock and Class B Common Stock voting together as a single class.

(3)

Pursuant to the Stockholders Agreement, each of our Principal Stockholders have certain board nomination and other rights as described in “Certain Relationships and Related Party Transactions—Exchange Agreement.” Each of the Blackstone Investors and the BL Investors will agree to vote the respective shares of the Company’s common stock beneficially owned by them in favor of the individuals nominated as the Company’s directors in accordance with the terms of the Stockholders Agreement.

(4)

Reflects 50,675,920 FoA Units and 2,022,766 shares of Class A Common Stock held directly by BTO Urban Holdings L.L.C., 290,906 FoA Units and 11,612 shares of Class A Common Stock held directly by Blackstone Family Tactical Opportunities Investment Partnership NQ – ESC L.P. and 23,066,495 shares of Class A Common Stock directly held by BTO Urban Holdings II L.P.

BTO Urban Holdings L.L.C. is owned by Blackstone Tactical Opportunities Fund – NQ L.P., Blackstone Tactical Opportunities Fund II – NQ L.P., Blackstone Tactical Opportunities Fund – A (RA) – NQ L.P., Blackstone Tactical Opportunities Fund – I – NQ L.P., Blackstone Tactical Opportunities Fund – S – NQ L.P., Blackstone Tactical Opportunities Fund – C – NQ L.P., Blackstone Tactical Opportunities Fund – L – NQ L.P., Blackstone Tactical Opportunities Fund – O – NQ L.P., Blackstone Tactical Opportunities Fund – N – NQ L.P., Blackstone Tactical Opportunities Fund – U – NQ L.L.C., Blackstone Tactical Opportunities Fund II – C – NQ L.P., Blackstone Tactical Opportunities Fund – T – NQ L.P., Blackstone Tactical Opportunities Fund II – F – NQ L.P., Blackstone Tactical Opportunities Fund – G – NQ L.P., Blackstone Tactical Opportunities Fund – AD – NQ L.P. (collectively, each of the Blackstone Tactical Opportunities Funds described above in this paragraph shall be referred to as the “Blackstone Tactical Opportunities Funds”), BTAS NQ Holdings L.L.C. and Blackstone Family Tactical Opportunities Investment Partnership SMD L.P.

The general partner of each of the Blackstone Tactical Opportunities Funds is Blackstone Tactical Opportunities Associates – NQ L.L.C. The sole member of Blackstone Tactical Opportunities Associates – NQ L.L.C. is BTOA – NQ L.L.C. The managing member of BTOA – NQ LLC is Blackstone Holdings II L.P. The managing member of BTAS NQ Holdings L.L.C. is BTAS Associates – NQ L.L.C. The managing member of BTAS Associates – NQ L.L.C. is Blackstone Holdings II L.P.

The general partner of Blackstone Family Tactical Opportunities Investment Partnership SMD L.P. is Blackstone Family GP L.L.C. Blackstone Family GP L.L.C. is wholly owned by Blackstone’s senior managing directors and controlled by its founder, Mr. Schwarzman.

The general partner of Blackstone Family Tactical Opportunities Investment Partnership NQ – ESC L.P. is BTO-NQ Side-by-Side GP L.L.C. The sole member of BTO-NQ Side-by-Side GP L.L.C. is Blackstone Holdings II L.P.

The general partner of BTO Urban Holdings II L.P. is Blackstone Tactical Opportunities Associates L.L.C. The managing member of Blackstone Tactical Opportunities Associates L.L.C. is BTOA L.L.C. The managing member of BTOA L.L.C. is Blackstone Holdings III L.P. Blackstone Holdings III L.P. is the managing member of BTOA L.L.C. The general partner of Blackstone Holdings III L.P. is Blackstone Holdings III GP L.P. The general partner of Blackstone Holdings III GP L.P. is Blackstone Holdings III GP Management L.L.C.


193


Table of Contents

Blackstone Holdings I/II GP L.L.C. is the general partner of Blackstone Holdings II L.P. The Blackstone Group Inc. is the sole member of each of Blackstone Holdings I/II GP L.L.C. and Blackstone Holdings III GP Management L.L.C. The sole holder of the Class C common stock of The Blackstone Group Inc. is Blackstone Group Management L.L.C. Blackstone Group Management L.L.C. is wholly owned by Blackstone’s senior managing directors and controlled by its founder, Stephen A. Schwarzman.

Each of the Blackstone entities described in this footnote and Stephen A. Schwarzman (other than to the extent it or he directly holds securities as described herein) may be deemed to beneficially own the securities directly or indirectly controlled by such Blackstone entities or him, but each disclaims beneficial ownership of such securities. The address of each of such Blackstone entities and Mr. Schwarzman is c/o The Blackstone Group Inc., 345 Park Avenue, New York, New York 10154.


(5)

Includes 7,097,500 shares of Class A Common Stock held by the Sponsor. The amounts also include 775,000 shares of Class A Common Stock that were received by the Sponsor in the Warrant Exchange. Messrs. Edmond Safra and Gregorio Werthein are managers of the Sponsor. Accordingly, all of the shares held by the Sponsor may be deemed to be beneficially held by Messrs. Edmond Safra and Gregorio Werthein. Each of Messrs. Edmond Safra and Gregorio Werthein disclaims beneficial ownership of such securities except to the extent of his pecuniary interest therein.


(6)

Includes 2,350,000 shares of Class A Common Stock held directly by EMS Opportunity Ltd. and indirectly by Mr. Safra as the sole shareholder of EMS Capital Holding Inc., which is the general partner of EMS Capital LP, the investment manager of EMS Opportunity Ltd. Also includes 1,000,000 PIPE Shares purchased by EMS Opportunity Ltd. Mr. Safra disclaims beneficial ownership of such securities except to the extent of his pecuniary interest therein.


(7)

Pursuant to the limited liability company agreement of Libman Family Holdings, LLC (“LFH”), LFH is managed by a board of managers consisting of Brian Libman, as the sole manager. LFH is owned, in equal parts, by Libman-Alpha Holdings, LLC (“Alpha”), Libman-Eta Holdings, LLC (“Eta”) and Libman-Kappa Holdings, LLC (“Kappa”). Each of Alpha, Eta and Kappa are owned by Brian Libman, Sharon Libman, Libman 2004 Trust (the “04 Trust”) and Libman Family Generational Trust (the “Generational Trust”). The Trustee of each of the 04 Trust and the Generational Trust is Kenneth Libman.

Pursuant to the limited liability company agreement of The Mortgage Opportunity Group, LLC (“TMOG”), TMOG is managed by a board of managers consisting of Brian Libman, as the sole manager. TMOG is owned, in equal parts, by Brian Libman and Sharon Libman.


(8)

Represents 326,799 shares of Class A Common Stock underlying vested RSUs anticipated to be granted within 60 days of Closing and 418,593 shares of Class A Common Stock underlying limited liability company units of UFG Management Holdings LLC (“Management Holdings Units”), which are redeemable at Ms. Cook’s option for FoA Units, which will then be immediately exchanged for shares of Class A Common Stock on a one-for-one basis.

(9)

Mr. Chee is an employee of Blackstone or one of its affiliates but disclaims beneficial ownership of shares beneficially owned by Blackstone and its affiliates. The address for Mr. Chee is c/o The Blackstone Group Inc., 345 Park Avenue, New York, New York 10154.

(10)

Reflects securities held directly by CDZ Capital Partners, LP. The general partner of CDZ Capital Partners, LP is CDZ Capital Corp. Mr. West controls CDZ Capital Corp.’s investment decisions.

(11)

Represents 326,799 shares of Class A Common Stock underlying vested RSUs anticipated to be granted within 60 days of Closing and 1,341,739 shares of Class A Common Stock underlying Management Holdings Units, which are redeemable at Mr. Fleming’s option for FoA Units, which will then be immediately exchanged for shares of Class A Common Stock on a one-for-one basis.

(12)

Represents 206,399 shares of Class A Common Stock underlying vested RSUs anticipated to be granted within 60 days of Closing and 504,533 shares of Class A Common Stock underlying Management Holdings Units, which are redeemable at Mr. Prahm’s option for FoA Units, which will then be immediately exchanged for shares of Class A Common Stock on a one-for-one basis.

(13)

Represents shares of Class A Common Stock underlying vested RSUs anticipated to be granted within 60 days of Closing.


194


Table of Contents

SELLING SECURITYHOLDERS

The Selling Securityholders listed in the table below may from time to time offer and sell any or all of the shares of Class A Common Stock set forth below pursuant to this prospectus. When we refer to the “Selling Securityholders” in this prospectus, we refer to the persons listed in the table below, and the pledgees, donees, transferees, assignees, successors and other permitted transferees that hold any of the Selling Securityholders’ interest in the shares of Class A Common Stock after the date of this prospectus.

The following table sets forth information concerning the shares of Class A Common Stock that may be offered from time to time by each Selling Securityholder. The 14,374,971 shares of Class A Common Stock issuable upon exercise of the Warrants are not included in the table below.

We cannot advise you as to whether the Selling Securityholders will in fact sell any or all of such shares of Class A Common Stock. In particular, the Selling Securityholders identified below may have sold, transferred or otherwise disposed of all or a portion of their securities after the date on which they provided us with information regarding their securities. Any changed or new information given to us by the Selling Securityholders, including regarding the identity of, and the securities held by, each Selling Securityholder, will be set forth in a prospectus supplement or amendments to the registration statement of which this prospectus is a part, if and when necessary.

Our registration of the shares of Class A Common Stock does not necessarily mean that the Selling Securityholders will sell all or any of such Class A Sommon Stock. The following table sets forth certain information provided by or on behalf of the Selling Securityholders as of May 24, 2021 concerning the Class A Common Stock that may be offered from time to time by each Selling Securityholder with this prospectus. A Selling Securityholder may sell all, some or none of such securities in this offering. See “Plan of Distribution.”


    Before Offering     After Offering  

Name and Address of Selling
Securityholder

  Shares of
Class A
Common
Stock
Beneficially
Owned
    Shares of
Class A
Common Stock
Beneficially
Owned and
that May be
Offered for
Resale
    % of Total
Voting Power
Represented
by Such
Class A Common
Stock that May
be Offered for
Resale (1)
    Shares of
Class A
Common
Stock
Beneficially
Owned
    Shares of
Class A
Common Stock
Beneficially
Owned and
that May be
Offered for
Resale
    % of Total
Voting Power
Represented
by Such
Class A Common
Stock that May
be Offered for
Resale (1)
 

SCF Realty Group LLC (9)

    200,000       200,000       *       —         —         —    

Alyeska Master Fund, L.P. (10)

    650,000       650,000       *       —         —         —    

Arrow Offshore, LTD (11)

    150,000       150,000       *       —         —         —    

Arrow Partners LP (12)

    350,000       350,000       *       —         —         —    

CaaS Capital Master Fund LP (13)

    700,000       700,000       *       —         —         —    

Cobalt Partners, LP (14)

    1,500,000       1,500,000       *       —         —         —    

D1 Capital Partners Master LP (15)

    5,000,000       5,000,000       2.6     —         —         —    

Ghisallo Master Fund LP (16)

    500,000       500,000       *       —         —         —    

Hawkeye Capital Master (17)

    1,000,000       1,000,000       *       —         —         —    

Jane Street Global Trading, LLC (18)

    650,000       650,000       *       —         —         —    


195


Table of Contents
    Before Offering     After Offering  

Name and Address of Selling
Securityholder

  Shares of
Class A
Common
Stock
Beneficially
Owned
    Shares of
Class A
Common Stock
Beneficially
Owned and
that May be
Offered for
Resale
    % of Total
Voting Power
Represented
by Such
Class A Common
Stock that May
be Offered for
Resale (1)
    Shares of
Class A
Common
Stock
Beneficially
Owned
    Shares of
Class A
Common Stock
Beneficially
Owned and
that May be
Offered for
Resale
    % of Total
Voting Power
Represented
by Such
Class A Common
Stock that May
be Offered for
Resale (1)
 

Lugard Road Capital Master Fund, LP (19)

    381,112       381,112       *       —         —         —    

Luxor Capital Partners Offshore Master Fund, LP (20)

    255,511       255,511       *       —         —         —    

Luxor Capital Partners, LP (21)

    370,069       370,069       *       —         —         —    

Luxor Wavefront, LP (22)

    193,308       193,308       *       —         —         —    

NR1 SP, A Segregated Portfolio of Northrock SPC (23)

    500,000       500,000       *       —         —         —    

Omega Capital Partners, LP (24)

    3,500,000       3,500,000       1.8     —         —         —    

Point72 Associates, LLC (25)

    300,000       300,000       *       —         —         —    

Samlyn Long Alpha Master Fund, Ltd. (26)

    11,161       11,161       *       —         —         —    

Samlyn Net Neutral Master Fund, Ltd. (27)

    173,439       173,439       *       —         —         —    

Samlyn Onshore Fund, LP (28)

    82,635       82,635       *       —         —         —    

Samlyn Offshore Master Fund, Ltd. (29)

    232,765       232,765       *       —         —         —    

BTO Urban Holdings L.L.C. (2) (30)

    52,698,686       52,698,686       27.0     —         —         —    

Replay Sponsor, LLC (31)

    7,872,500       7,872,500       4.0     —         —         —    

BTO Urban Holdings II L.P. (30)

    23,066,495       23,066,495       11.8     —         —         —    

Libman Family Holdings LLC (3) (32)

    74,413,622       74,413,622       38.1     —         —         —    

The Mortgage Opportunity Group LLC (4) (33)

    1,941,876       1,941,876       1.0      

L and TF, LLC (5) (34)

    264,918       264,918       *       —         —         —    

UFG Management Holdings LLC (6) (35)

    3,610,088       3,610,088       1.8     —         —         —    

Joe Cayre (7) (36)

    1,501,203       1,501,203       *       —         —         —    

CC FOA Holdings, LLC (37)

    300,000       300,000       *       —         —         —    

EMS Opportunity Ltd. (38)

    1,000,000       1,000,000       *       —         —         —    

CDZ Capital Partners, LP (39)

    700,000       700,000       *       —         —         —    


196


Table of Contents
    Before Offering     After Offering  

Name and Address of Selling
Securityholder

  Shares of
Class A
Common
Stock
Beneficially
Owned
    Shares of
Class A
Common Stock
Beneficially
Owned and
that May be
Offered for
Resale
    % of Total
Voting Power
Represented
by Such
Class A Common
Stock that May
be Offered for
Resale (1)
    Shares of
Class A
Common
Stock
Beneficially
Owned
    Shares of
Class A
Common Stock
Beneficially
Owned and
that May be
Offered for
Resale
    % of Total
Voting Power
Represented
by Such
Class A Common
Stock that May
be Offered for
Resale (1)
 

Blackstone Family Tactical Opportunities Investment Partnership – NQ – ESC L.P. (8) (30)

    302,518       302,518       *       —         —         —    

TradeInvest Asset Management Company (BVI) LTD (40)

    1,000,000       1,000,000       *       —         —         —    

Waterbeck Group Limited (41)

    500,000       500,000       *       —         —         —    

Beckensfield Limited (42)

    500,000       500,000       *       —         —         —    

Daniel Marx (43)

    25,000       25,000       *       —         —         —    

Mariano Bosch (44)

    40,000       40,000       *       —         —         —    

Russell Colaco (45)

    25,000       25,000       *       —         —         —    


*

Less than one percent

(1)

Holders of Class A Common Stock are entitled to one vote for each share of Class A Common Stock held by them.

(2)

Includes 50,675,920 shares of our Class A Common Stock that may be offered by BTO Urban Holdings L.L.C. issuable upon the exchange of 50,675,920 outstanding FoA Units held by BTO Urban Holdings L.L.C., which if BTO Urban Holdings L.L.C. elects to redeem such FoA Units, the Company has the option, at the Company’s sole discretion, to exchange any such FoA Units for shares of Class A Common Stock, on a one-for-one basis, subject to adjustment.

(3)

Includes 73,033,375 shares of our Class A Common Stock that may be offered by Libman Family Holdings LLC issuable upon the exchange of 73,033,375 outstanding FoA Units held by Libman Family Holdings LLC, which if Libman Family Holdings LLC elects to redeem such FoA Units, the Company has the option, at the Company’s sole discretion, to exchange any such FoA Units for shares of Class A Common Stock, on a one-for-one basis, subject to adjustment.

(4)

Includes 1,941,876 shares of our Class A Common Stock that may be offered by The Mortgage Opportunity Group LLC issuable upon the exchange of 1,941,876 outstanding FoA Units held by The Mortgage Opportunity Group LLC, which if The Mortgage Opportunity Group LLC elects to redeem such FoA Units, the Company has the option, at the Company’s sole discretion, to exchange any such FoA Units for shares of Class A Common Stock, on a one-for-one basis, subject to adjustment.

(5)

Includes 264,918 shares of our Class A Common Stock that may be offered by L and TF, LLC issuable upon the exchange of 264,918 outstanding FoA Units held by L and TF, LLC, which if L and TF, LLC elects to redeem such FoA Units, the Company has the option, at the Company’s sole discretion, to exchange any such FoA Units for shares of Class A Common Stock, on a one-for-one basis, subject to adjustment.

(6)

Includes 3,610,088 shares of our Class A Common Stock that may be offered by UFG Management Holdings LLC issuable upon the exchange of 3,610,088 outstanding FoA Units held by UFG Management Holdings LLC, which if UFG Management Holdings LLC elects to redeem such FoA Units, the Company has the option, at the Company’s sole discretion, to exchange any such FoA Units for shares of Class A Common Stock, on a one-for-one basis, subject to adjustment.

(7)

Includes 1,501,203 shares of our Class A Common Stock that may be offered by Mr. Cayre issuable upon the exchange of 1,501,203 outstanding FoA Units held by Mr. Cayre, which if Mr. Cayre elects to redeem such FoA Units, the Company has the option, at the Company’s sole discretion, to exchange any such FoA Units for shares of Class A Common Stock, on a one-for-one basis, subject to adjustment.


197


Table of Contents
(8)

Includes 290,906 shares of our Class A Common Stock that may be offered by Blackstone Family Tactical Opportunities Investment Partnership – NQ – ESC L.P. issuable upon the exchange of 290,906 outstanding FoA Units held by Blackstone Family Tactical Opportunities Investment Partnership – NQ – ESC L.P., which if Blackstone Family Tactical Opportunities Investment Partnership – NQ – ESC L.P. elects to redeem such FoA Units, the Company has the option, at the Company’s sole discretion, to exchange any such FoA Units for shares of Class A Common Stock, on a one-for-one basis, subject to adjustment.

(9)

Robert Cayre is the managing member of SCF Realty Group LLC. The address for SCF Realty Group LLC is 1407 Broadway, 41st Floor, Attn: Bobby Cayre, New York, NY 10018.

(10)

Alyeska Investment Group, L.P. is the investment manager of Alyeska Master Fund, L.P. Alyeska Investment Holdings Corporation is the general partner of Alyeska Investment Group, L.P., and Anand Parekh is the sole owner of Alyeska Investment Holdings Corporation and may be deemed to be the beneficial owner of such shares. Mr. Parekh, however, disclaims any beneficial ownership of the shares held by Alyeska Master Fund, L.P. The address for Alyeska Master Fund, L.P. is 77 W. Wacker, Suite 700, Attn: Jason Bragg, Chicago, IL 60602.

(11)

Arrow Offshore Advisors, LLC is the investment advisor of Arrow Offshore, LTD. Mal Serure is the managing member of Arrow Offshore Advisors, LLC. The address for Arrow Offshore, LTD is 499 Park Avenue, 10th Floor, New York, NY 10022.

(12)

Arrow Advisors, LLC is the general partner of Arrow Partners LP. Mal Serure is the managing member of Arrow Advisors, LLC. The address for Arrow Partners LP is 499 Park Avenue, 10th Floor, New York, NY 10022.

(13)

CaaS Capital Fund GP LLC is the general partner of CaaS Capital Master Fund LP. Frank Fu is the managing member of CaaS Capital Fund GP LLC. The address for CaaS Capital Master Fund LP is 800 Third Avenue, 26th Floor, Attn: Semi Gogliormella, New York, NY 10022.

(14)

Wayne Cooperman is the sole managing member of Cobalt Management, LLC, which is the general partner of Cobalt Partners, LP. The address for Cobalt Partners, LP is 636 Morris Turnpike, Suite 3B, Attn: Wayne Cooperman, Short Hills, NJ 07078.

(15)

D1 Capital Partners GP Sub LLC is the general partner of D1 Capital Partners Master LP. D1 Capital Partners GP LLC is the managing member of D1 Capital Partners GP Sub LLC. Daniel Sundheim, directly and through D1 Employees, LLC and the Daniel Sundheim 2018 Family Trust, controls D1 Capital Partners GP LLC. Mr. Sundheim, however, disclaims any beneficial ownership of the shares held by D1 Capital Partners Master LP. The address for D1 Capital Partners Master LP is c/o D1 Capital Partners L.P., 9 West 57th Street, 36th Floor, Attn: Amanda Hector, New York, NY 10019.

(16)

Ghisallo Master Fund General Partner LP is the general partner of Ghisallo Master Fund LP. Michael Germino is the managing partner of Ghisallo Master Fund General Partner LP. The address for Ghisallo Master Fund LP is 27 Hospital Road, Attn: Legal & Compliance, Georgetown, Grand Cayman, KY1-9008.

(17)

Hawkeye Capital Management LLC (“HCMLLC”) is the investment advisor of Hawkeye Capital Master. Richard Rubin is the managing member of HCMLLC. The address for Hawkeye Capital Master is 1828 Bay Road, 2nd Floor, Miami Beach, FL 33139.

(18)

Jane Street Global Trading, LLC is a wholly owned subsidiary of Jane Street Group, LLC. Michael A. Jenkins and Robert A. Granieri are the members of the operating committee of Jane Street Group, LLC. The address for Jane Street Global Trading, LLC is 250 Vesey Street, 3rd Floor, Attn: Compliance Department, New York, NY 10281.

(19)

Luxor Capital Group, LP is the investment manager and Lugard Road Capital GP, LLC is the general partner of Lugard Road Capital Master Fund, LP. Jonathan Green is the managing member Lugard Road Capital GP, LLC. The address for Lugard Road Capital Master Fund, LP is 1114 Avenue of the Americas, 28th Floor, Attn: Legal, New York, NY 10036.

(20)

Luxor Capital Group, LP is the investment manager and LCG Holdings, LLC is the general partner of Luxor Capital Partners Offshore Master Fund, LP. Christian Leone is the managing member of LCG Holdings, LLC. The address for Luxor Capital Partners Offshore Master Fund, LP is 1114 Avenue of the Americas, 28th Floor, Attn: Legal, New York, NY 10036.

(21)

Luxor Capital Group, LP is the investment manager and LCG Holdings, LLC is the general partner of Luxor Capital Partners, LP. Christian Leone is the managing member of LCG Holdings, LLC. The address for Luxor Capital Partners, LP is 1114 Avenue of the Americas, 28th Floor, Attn: Legal, New York, NY 10036.


198


Table of Contents
(22)

Luxor Capital Group, LP is the investment manager and LCG Holdings, LLC is the general partner of Luxor Wavefront, LP. Christian Leone is the managing member of LCG Holdings, LLC. The address for Luxor Wavefront, LP is 1114 Avenue of the Americas, 28th Floor, Attn: Legal, New York, NY 10036.

(23)

LH Capital Markets, LLC is the investment adviser of NR1 SP, a Segregated Portfolio of Northrock SPC. LH Capital Markets, LLC has voting and dispositive power over such securities. Aaron Nieman, as the managing member and chief investment officer of LH Capital Markets, LLC, has sole voting and dispositive power over the shares held and may be deemed to beneficially own such securities. Mr. Nieman disclaims beneficial ownership of the shares, except to the extent of his pecuniary interest therein. The address for NR1 SP, a Segregated Portfolio of Northrock SPC is 437 Madison Avenue, 21st Floor, Attn: Aaron M. Nieman, New York, NY 10022.

(24)

Omega Associates LLC is the general partner of Omega Capital Partners, LP. Leon Cooperman is the sole member of Omega Associates LLC. The address for Omega Capital Partners, LP is 810 Seventh Avenue, 33rd Floor, Attn: Edward Levy, New York, NY 10019.

(25)

Point72 Asset Management, L.P. maintains investment and voting power with respect to the securities held by certain investment funds it manages, including Point72 Associates, LLC. Point72 Capital Advisors, Inc. is the general partner of Point72 Asset Management, L.P. Mr. Steven A. Cohen controls each of Point72 Asset Management, L.P. and Point72 Capital Advisors, Inc. The address for Point72 Associates, LLC is c/o Point72 Asset Management, L.P., 72 Cummings Point Road, Stamford, CT 06902.

(26)

Samlyn Capital, LLC is the investment manager of Samlyn Long Alpha Master Fund, Ltd. Robert Pohly is the principal of Samlyn Capital, LLC and director of Samlyn Long Alpha Master Fund, Ltd. Samlyn Capital, LLC and Robert Pohly disclaim beneficial ownership of the reported securities except to the extent of their respective pecuniary interests therein, and this shall not be deemed an admission that either of them are the beneficial owners of the securities for purposes of Section 16 of the Securities Exchange Act of 1934 or for any other purpose. The address for Samlyn Long Alpha Master Fund, Ltd. is c/o Samlyn Capital, LLC, 500 Park Avenue, Attn: Michael Barry, New York, NY 10022.

(27)

Samlyn Capital, LLC is the investment manager of Samlyn Net Neutral Master Fund, Ltd. Robert Pohly is the principal of Samlyn Capital, LLC and director of Samlyn Net Neutral Master Fund, Ltd. Samlyn Capital, LLC and Robert Pohly disclaim beneficial ownership of the reported securities except to the extent of their respective pecuniary interests therein, and this shall not be deemed an admission that either of them are the beneficial owners of the securities for purposes of Section 16 of the Securities Exchange Act of 1934 or for any other purpose. The address for Samlyn Net Neutral Master Fund, Ltd. is c/o Samlyn Capital, LLC, 500 Park Avenue, Attn: Michael Barry, New York, NY 10022.

(28)

Samlyn Capital, LLC is the investment manager of Samlyn Onshore Fund, LP, and Samlyn Partners, LLC is the general partner of Samlyn Onshore Fund, LP. Robert Pohly is the principal of Samlyn Capital, LLC and the managing member of Samlyn Partners, LLC. Samlyn Capital, LLC, Samlyn Partners, LLC and Robert Pohly disclaim beneficial ownership of the reported securities except to the extent of their respective pecuniary interests therein, and this shall not be deemed an admission that either of them are the beneficial owners of the securities for purposes of Section 16 of the Securities Exchange Act of 1934 or for any other purpose. The address for Samlyn Onshore Fund, LP is c/o Samlyn Capital, LLC, 500 Park Avenue, Attn: Michael Barry, New York, NY 10022.

(29)

Samlyn Capital, LLC is the investment manager of Samlyn Offshore Master Fund, Ltd. Robert Pohly is the principal of Samlyn Capital, LLC and director of Samlyn Offshore Master Fund, Ltd. Samlyn Capital, LLC and Robert Pohly disclaim beneficial ownership of the reported securities except to the extent of their respective pecuniary interests therein, and this shall not be deemed an admission that either of them are the beneficial owners of the securities for purposes of Section 16 of the Securities Exchange Act of 1934 or for any other purpose. The address for Samlyn Offshore Master Fund, Ltd. is c/o Samlyn Capital, LLC, 500 Park Avenue, Attn: Michael Barry, New York, NY 10022.

(30)

BTO Urban Holdings L.L.C. is owned by Blackstone Tactical Opportunities Fund – NQ L.P., Blackstone Tactical Opportunities Fund II – NQ L.P., Blackstone Tactical Opportunities Fund – A (RA) – NQ L.P., Blackstone Tactical Opportunities Fund – I – NQ L.P., Blackstone Tactical Opportunities Fund – S – NQ L.P., Blackstone Tactical Opportunities Fund – C – NQ L.P., Blackstone Tactical Opportunities Fund – L – NQ L.P., Blackstone Tactical Opportunities Fund – O – NQ L.P., Blackstone Tactical Opportunities Fund –


199


Table of Contents
  N – NQ L.P., Blackstone Tactical Opportunities Fund – U – NQ L.L.C., Blackstone Tactical Opportunities Fund II – C – NQ L.P., Blackstone Tactical Opportunities Fund – T – NQ L.P., Blackstone Tactical Opportunities Fund II – F – NQ L.P., Blackstone Tactical Opportunities Fund – G – NQ L.P., Blackstone Tactical Opportunities Fund – AD – NQ L.P. (collectively, each of the Blackstone Tactical Opportunities Funds described above in this paragraph shall be referred to as the “Blackstone Tactical Opportunities Funds”), BTAS NQ Holdings L.L.C. and Blackstone Family Tactical Opportunities Investment Partnership SMD L.P.

The general partner of each of the Blackstone Tactical Opportunities Funds is Blackstone Tactical Opportunities Associates – NQ L.L.C. The sole member of Blackstone Tactical Opportunities Associates – NQ L.L.C. is BTOA – NQ L.L.C. The managing member of BTOA – NQ LLC is Blackstone Holdings II L.P. The managing member of BTAS NQ Holdings L.L.C. is BTAS Associates – NQ L.L.C. The managing member of BTAS Associates – NQ L.L.C. is Blackstone Holdings II L.P.

The general partner of Blackstone Family Tactical Opportunities Investment Partnership SMD L.P. is Blackstone Family GP L.L.C. Blackstone Family GP L.L.C. is wholly owned by Blackstone’s senior managing directors and controlled by its founder, Mr. Schwarzman.

The general partner of Blackstone Family Tactical Opportunities Investment Partnership NQ – ESC L.P. is BTO-NQ Side-by-Side GP L.L.C. The sole member of BTO-NQ Side-by-Side GP L.L.C. is Blackstone Holdings II L.P.

The general partner of BTO Urban Holdings II L.P. is Blackstone Tactical Opportunities Associates L.L.C. The managing member of Blackstone Tactical Opportunities Associates L.L.C. is BTOA L.L.C. The managing member of BTOA L.L.C. is Blackstone Holdings III L.P. Blackstone Holdings III L.P. is the managing member of BTOA L.L.C. The general partner of Blackstone Holdings III L.P. is Blackstone Holdings III GP L.P. The general partner of Blackstone Holdings III GP L.P. is Blackstone Holdings III GP Management L.L.C.

Blackstone Holdings I/II GP L.L.C. is the general partner of Blackstone Holdings II L.P. The Blackstone Group Inc. is the sole member of each of Blackstone Holdings I/II GP L.L.C. and Blackstone Holdings III GP Management L.L.C. The sole holder of the Class C common stock of The Blackstone Group Inc. is Blackstone Group Management L.L.C. Blackstone Group Management L.L.C. is wholly owned by Blackstone’s senior managing directors and controlled by its founder, Stephen A. Schwarzman.

Each of the Blackstone entities described in this footnote and Stephen A. Schwarzman (other than to the extent it or he directly holds securities as described herein) may be deemed to beneficially own the securities directly or indirectly controlled by such Blackstone entities or him, but each disclaims beneficial ownership of such securities. The address of each of such Blackstone entities and Mr. Schwarzman is c/o The Blackstone Group Inc., 345 Park Avenue, New York, New York 10154.


(31)

Edmond M. Safra and Gregorio Werthein indirectly control Replay Sponsor, LLC. The address for Replay Sponsor, LLC is c/o EMS Capital LP, 767 Fifth Avenue, 46th Floor, Attn: Legal & Compliance, New York, NY 10153.

(32)

Pursuant to the limited liability company agreement of Libman Family Holdings, LLC (“LFH”), LFH is managed by a board of managers consisting of Brian Libman, as the sole manager. LFH is owned, in equal parts, by Libman-Alpha Holdings, LLC (“Alpha”), Libman-Eta Holdings, LLC (“Eta”) and Libman-Kappa Holdings, LLC (“Kappa”). Each of Alpha, Eta and Kappa are owned by Brian Libman, Sharon Libman, Libman 2004 Trust (the “04 Trust”) and Libman Family Generational Trust (the “Generational Trust”). The Trustee of each of the 04 Trust and the Generational Trust is Kenneth Libman. Brian Libman is the chairman of the Company. The address for LFH is 12 Wilton Road, Westport, CT 06880, Attn: Brian Libman, New Canaan, CT 06880.

(33)

Pursuant to the limited liability company agreement of The Mortgage Opportunity Group, LLC (“TMOG”), TMOG is managed by a board of managers consisting of Brian Libman, as the sole manager. TMOG is owned, in equal parts, by Brian Libman and Sharon Libman. The address for TMOG is 1065 Weed Street, Attn: Brian Libman, New Canaan, CT 06840.


200


Table of Contents
(34)

John Keratsis is the managing member of L and TF LLC. L and TF LLC is owned 66.67% by John Keratsis and 33.33% by Michael Witt. The address for L and TF, LLC is 3816 Foxcroft Road, Charlotte, NC 28211.

(35)

The managing member of UFG Management Holdings LLC is Finance of America Equity Capital LLC. The address for UFG Management Holdings LLC is 909 Lake Carolyn Parkway, Suite 1550, Irving, Texas 75039.

(36)

Joe Cayre directly owns these shares. The address for Joe Cayre is c/o Midtown Equities, 141, 5th Avenue, New York, NY 10010.

(37)

The ultimate beneficiary and controlling person of CC FOA Holdings, LLC is Chinh Chu. The address for CC FOA Holdings, LLC is 200 Park Avenue, 58th Floor, New York, NY 10166.

(38)

EMS Capital LP is the investment manager of EMS Opportunity Ltd. EMS Capital Holding Inc. is the general partner of EMS Capital LP. Edmond Safra is the sole shareholder of EMS Capital Holding Inc. The address for EMS Opportunity Ltd. is c/o EMS Capital LP, 767 Fifth Avenue, 46th Floor, Attn: Legal & Compliance, New York, NY 10153.

(39)

Lance N. West has significant control over CDZ Capital Partners, L.P. Mr. West is a director of the Company. The address for CDZ Capital Partners, LP is 139 Old Mill Rd., Watermill, NY 11976.

(40)

TradeInvest Asset Management Company (BVI) LTD is controlled by Sarkis D. Izmirlian. The address for TradeInvest Asset Management Company (BVI) LTD is 6th Floor, Lyford Cay House, Western Road, P.O. Box N-7776 (Slot (193)), Nassau, New Providence, The Bahamas.

(41)

Panagiotis Laskaridis is the sole member of Waterbeck Group Limited. The address for Waterbeck Group Limited is c/o Montanios & Montanios LLC, 16 Pantelis Catelaris Str, Diagora House, Attn: Adam Montanios, Nicosia, Cyprus 1097.

(42)

Athanasios Laskaridis is the sole member of Beckensfield Limited. The address for Beckensfield Limited is c/o Montanios & Montanios LLC, 16 Pantelis Catelaris Str, Diagora House, Attn: Adam Montanios, Nicosia, Cyprus 1097.

(43)

Daniel Marx directly owns these shares. The address for Daniel Marx is Av. Corrientes 222, p. 12, C1043AAP, Buenos Aires, Argentina.

(44)

The registered holder of Mariano Bosch’s shares is INTL FC Stone Financial Inc. The address for Mariano Bosch is Av Fondo de Legua 936 Martinez, Buenos Aires, Argentina.

(45)

Russell Colaco directly owns these shares. The address for Russell Colaco is 16 Linden Lane, Chatham, NJ 07928.

Certain Relationships with the Selling Securityholders

Letter Agreements

Prior to the closing of the Business Combination, the Seller Representative and Replay entered into a letter agreement to adjust the amount of FoA Units sold by certain Sellers and Blocker GP (but not the aggregate amount of FoA Units sold by all Sellers and Blocker GP), which is included as Exhibit 2.2 to this prospectus and is incorporated herein by reference, and following the closing of the Business Combination, the Seller Representative and Replay entered into a letter agreement to adjust the amount of Earnout Securities that would be issuable to certain Sellers and Blocker GP (but not the aggregate amount of Earnout Securities issuable to all Sellers and Blocker GP), which is included as Exhibit 2.3 to this prospectus and is incorporated herein by reference. In addition, prior to the closing of the Business Combination, the Blackstone Investors and the BL Investors entered into a letter agreement pursuant to which the Blackstone Investors and the BL Investors agreed, among other things, to permit the Blackstone Investors to have priority over the BL Investors with respect to certain sales notwithstanding the terms of the Stockholders Agreement or the Registration Rights Agreement, which is included as Exhibit 2.4 to this prospectus and is incorporated herein by reference.

Lockup Agreements

Certain Replay shareholders have agreed to (i) a one-year post-Closing lock-up period applicable to the transfer of a Sponsor Person’s (as defined in the Sponsor Agreement) Company securities, other than any securities of Replay issued in Replay’s initial public offering or purchased on the open market, pursuant to the PIPE or acquired through the Warrant Exchange (collectively, the “Excluded Securities”) and (ii) a 180-day post-


201


Table of Contents

Closing lock-up period applicable to the transfer of a Sponsor Person’s Excluded Securities, other than any Excluded Securities purchased in connection with the PIPE or on the open market after the date of the Sponsor Agreement, in each case, subject to limited exceptions.

The Principal Stockholders have agreed to a 180-day post-Closing lock-up period applicable to the transfer of such Principal Stockholder’s Closing securities, subject to limited exceptions, other than any Company securities purchased in connection with the PIPE or on the open market.

Founder Shares

Replay issued an aggregate of 7,187,500 Ordinary Shares to the Sponsor and certain of Replay’s directors in a private placement prior to Replay’s initial public offering. In connection with the Domestication, each of the issued and outstanding Founder Shares automatically converted, on a one-for-one basis, into Replay LLC Units, and upon the effectiveness of the Replay Merger, each such Replay LLC Unit automatically converted into the right to receive one share of Class A Common Stock.

In connection with the initial public offering of Replay, the Sponsor purchased, in a private placement, an aggregate of 7,750,000 Private Placement Warrants. In connection with the Closing, the Private Placement Warrants were cancelled in exchange for 775,000 Ordinary Shares, which ultimately convered into 775,000 shares of Class A Common Stock.

PIPE Agreements

Concurrently with the execution of the Transaction Agreement, (i) Replay entered into to subscription agreements with various investors, including an affiliate of the Sponsor, pursuant to which such investors agreed to purchase Ordinary Shares (which Ordinary Shares were converted into Replay LLC Units pursuant to the Domestication and then were converted into the right to receive shares of Class A Common Stock pursuant to the Replay Merger) (each such subscription agreement, a “Replay PIPE Agreement”), and (ii) the Company entered into subscription agreements (the “Company PIPE Agreements”) with the Principal Stockholders (together with the investors party to the Replay PIPE Agreements, the “PIPE Investors”), pursuant to which the Principal Stockholders agreed to purchase shares of Class A Common Stock (together with the Ordinary Shares being purchased pursuant to the Replay PIPE Agreements, the “PIPE Shares”). In the aggregate, the PIPE Investors purchased $250.0 million of PIPE Shares, at a purchase price of $10.00 per PIPE Share, including $10.0 million of PIPE Shares purchased by an affiliate of the Sponsor. Certain offering related expenses were payable by the Company, including customary fees payable to the placement agents, Morgan Stanley & Co. LLC, Goldman Sachs & Co., LLC and Credit Suisse Securities (USA) LLC and capital markets advisors, including Blackstone Securities Partners L.P. All of the PIPE Agreements are in the same form as each other, except that Replay is not a party to the Company PIPE Agreements (and certain conforming changes were made to the Company PIPE Agreements to reflect that Replay is not a party thereto). The purpose of the sale of the PIPE Shares was to raise additional capital for use in connection with the Business Combination and to meet the minimum cash requirements provided in the Transaction Agreement.

Pursuant to the PIPE Agreements, the Company agreed that, within 45 calendar days after the Closing, the Company will file with the SEC (at the Company’s sole cost and expense) a registration statement registering the resale of the PIPE Shares (the “Resale Registration Statement”), and the Company will use its commercially reasonable efforts to have the Resale Registration Statement declared effective as soon as practicable after the filing thereof, subject to certain conditions. Each PIPE Agreement will terminate upon the earlier to occur of (i) such date and time as the Transaction Agreement is terminated in accordance with its terms, and (ii) upon the mutual written agreement of each of the parties to the PIPE Agreement.

Other Transactions

For further information regarding transactions between us and the Selling Securityholders see “Certain Relationships and Related PersonTransactions.”


202


Table of Contents

DESCRIPTION OF SECURITIES

The following summary of the material terms of our securities is not intended to be a complete summary of the rights and preferences of such securities, and is qualified by reference to our Amended and Restated Certificate of Incorporation (as amended, the “A&R Charter”), our Amended and Restated Bylaws (the “A&R Bylaws”) and the warrant-related documents described herein, which are exhibits to the registration statement of which this prospectus is a part. We urge to you reach each of the A&R Charter, A&R Bylaws and the warrant-related documents described herein in their entirety for a complete description of the rights and preferences of our securities.

Authorized and Outstanding Stock

The A&R Charter authorizes the issuance of an aggregate of 6,601,000,000 shares of capital stock, consisting of 6,000,000,000 shares of Class A Common Stock, $0.0001 par value per share, 1,000,000 shares of Class B Common Stock, $0.0001 par value per share, and 600,000,000 shares of undesignated preferred stock, $0.0001 par value per share. The shares of Common Stock issued in the Business Combination are duly authorized, validly issued, fully paid and non-assessable.

Our purpose is to engage in any lawful act or activity for which corporations may be organized under the DGCL. As of May 24, 2021, there were 64,140,214 shares of Class A Common Stock outstanding, and in addition, there were 195,458,500 FoA Units outstanding, consisting of 191,200,000 participating FoA Units and 4,258,500 non-participating FoA Units. Assuming the exchange of all outstanding FoA Units into shares of Class A Common Stock, there would have been 259,598,714 shares of Class A Common Stock outstanding. These numbers exclude (a) 14,374,971 shares of Class A Common Stock issuable upon the exercise of the outstanding Warrants and (b) the shares of Class A Common Stock reserved for future issuance under the Incentive Plan. There were no shares of preferred stock outstanding. Unless our board of directors determines otherwise, we will issue all shares of our capital stock in uncertificated form.

Common Stock

The A&R Charter provides for two classes of Common Stock: Class A Common Stock and Class B Common Stock. Pursuant to the Business Combination, each Ordinary Share outstanding immediately prior to the Domestication was converted into a Replay LLC Unit, with each Replay LLC Unit outstanding immediately prior to the effectiveness of the Replay Merger being converted into the right to receive one share of Class A Common Stock. Pursuant to the Business Combination, the Company issued to the Sellers shares of Class B Common Stock.

Class A Common Stock

Except as otherwise required by applicable law or as provided in the A&R Charter, the holders of Class A Common Stock will be entitled to one vote per share on matters to be voted on by stockholders generally or by holders of Class A Common Stock as a separate class.

Subject to applicable law and the rights, if any, of the holders of any outstanding series of preferred stock or any other outstanding class or series of stock of the Company, holders of Class A Common Stock will be entitled to receive such dividends and distributions, if any, as may be declared from time to time by our board of directors in its discretion out of funds legally available therefor.

In the event of our voluntary or involuntary liquidation, dissolution, distribution of assets or winding-up, after payment in full of all amounts required to be paid to creditors and subject to the rights of holders of preferred stock having liquidation preferences, if any, the holders of Class A Common Stock will be entitled to receive pro rata the Company’s remaining assets available for distribution.


203


Table of Contents

Class B Common Stock

The shares of Class B Common Stock will have no economic rights but will entitle each holder, without regard to the number of shares of Class B Common Stock held by such holder, to a number of votes equal to the product of the total number of FoA Units held by such person multiplied by the number of shares of Class A Common Stock for which a FoA Unit is entitled to be exchanged at such time (the “Exchange Rate”), on all matters to be voted on by stockholders generally or by holders of Class B Common Stock as a separate class. On the date of Closing, the Exchange Rate was 1 for 1, and will be subject to adjustment. The voting power afforded to holders of FoA Units by their shares of Class B Common Stock will be automatically and correspondingly reduced or increased as the number of FoA Units held by such holder of Class B Common Stock decreases or increases. For example, if a holder of Class B Common Stock holds 1,000 FoA Units as of the record date for determining stockholders of the Company that are entitled to vote on a particular matter, such holder will be entitled by virtue of such holder’s Class B Common Stock to 1,000 votes on such matter. If, however, such holder were to hold 500 FoA Units as of the relevant record date, such holder would be entitled by virtue of such holder’s Class B Common Stock to 500 votes on such matter.

Holders of Class B Common Stock will vote together as a single class with holders of Class A Common Stock on all matters submitted to a vote of the stockholders generally. Notwithstanding the foregoing, to the fullest extent permitted by law, holders of Common Stock will have no voting power with respect to, and will not be entitled to vote on, any amendment to the A&R Charter that relates solely to the terms of one or more outstanding series of Preferred Stock if the holders of such affected series are entitled, either separately or together with the holders of one or more other such series, to vote thereon pursuant to the A&R Charter or pursuant to the DGCL.

Holders of Class B Common Stock will not be entitled to receive any dividends or distributions on account of such shares.

Holders of Class B Common Stock will not be entitled to receive any of our assets on account of such shares in the event of our voluntary or involuntary liquidation, dissolution, distribution of assets or winding-up. Shares of Class B common stock are not convertible into or exchangeable for shares of Class A common stock or any other security.

Preferred Stock

The A&R Charter authorizes the Board to establish one or more series of preferred stock (including convertible preferred stock). Unless required by law or by any stock exchange, and subject to the terms of the A&R Charter, the authorized shares of preferred stock will be available for issuance without further action by holders of Class A Common Stock or Class B Common Stock. The Board is able to determine, with respect to any series of preferred stock, the powers (including voting powers), preferences and relative, participating, optional or other special rights, and the qualifications, limitations or restrictions thereof, including, without limitation:


the designation of the series;


the number of shares of the series, which the Board may, except where otherwise provided in any preferred stock designation, increase (but not above the total number of authorized shares of the class) or decrease (but not below the number of shares then outstanding);


whether dividends, if any, will be cumulative or non-cumulative and the dividend rate of the series;


the dates at which dividends, if any, will be payable on shares of such series;


the redemption rights and price or prices, if any, for shares of the series;


204


Table of Contents
   

the terms and amounts of any sinking fund provided for the purchase or redemption of shares of the series;


the amounts payable on shares of the series in the event of any voluntary or involuntary liquidation, dissolution or winding-up of our affairs or other event;


whether the shares of the series will be convertible into shares of any other class or series, or any other security, of us or any other entity, and, if so, the specification of the other class or series or other security, the conversion price or prices or rate or rates, any rate adjustments, the date or dates as of which the shares will be convertible and all other terms and conditions upon which the conversion may be made;


restrictions on the issuance of shares of the same series or of any other class or series of our capital stock; and


the voting rights, if any, of the holders of the series.

The Company could issue a series of preferred stock that could, depending on the terms of the series, impede or discourage an acquisition attempt or other transaction that some, or a majority, of the holders of Class A Common Stock might believe to be in their best interests or in which the holders of Class A Common Stock might receive a premium over the market price of the shares of Class A Common Stock. Additionally, the issuance of preferred stock may adversely affect the rights of holders of our Class A Common Stock by restricting dividends on the Class A Common Stock, diluting the voting power of the Class A Common Stock or subordinating the rights of the Class A Common Stock to distributions upon a liquidation, dissolution or winding up or other event. As a result of these or other factors, the issuance of preferred stock could have an adverse impact on the market price of Class A Common Stock.

Preemptive or Other Rights

Our stockholders will have no preemptive or other subscription rights. There will be no sinking fund provisions applicable to the Common Stock.

Election of Directors

All elections of directors will be determined by a plurality of the votes cast in respect of the shares present in person or represented by proxy at the meeting and entitled to vote on the election of directors.

No Cumulative Voting

Under Delaware law, the right to vote cumulatively does not exist unless the charter specifically authorizes cumulative voting. The A&R Charter does not authorize cumulative voting.

Annual Meeting

The A&R Bylaws provide that annual stockholder meetings will be held at a date, time and place, if any, as exclusively selected by the Board. To the extent permitted under applicable law, the Company may conduct meetings solely by means of remote communications, including by webcast.

Warrants

The Warrants are issued under a Warrant Agreement between Continental Stock Transfer & Trust Company, as warrant agent and the Company, as the successor to Replay.


205


Table of Contents

Each whole Warrant entitles the registered holder to purchase one share of Class A Common Stock at a price of $11.50 per share, subject to adjustment as discussed below, at any time commencing 30 days after the Closing. Pursuant to the Warrant Agreement, a warrant holder may exercise its Warrants only for a whole number of shares of Class A Common Stock. This means only a whole Warrant may be exercised at a given time by a warrant holder. The Warrants will expire five years after the Closing, at 5:00 p.m., New York City time, or earlier upon redemption or liquidation.

We will not be obligated to deliver any shares of Class A Common Stock pursuant to the exercise of a Warrant and will have no obligation to settle such Warrant exercise unless a registration statement under the Securities Act, covering the issuance of the shares of Class A Common Stock issuable upon exercise of the Warrants is then effective and a current prospectus relating thereto is current, subject to our satisfying our obligations described below with respect to registration. No Warrant will be exercisable for cash or on a cashless basis, and we will not be obligated to issue any shares to holders seeking to exercise their Warrants, unless the issuance of the shares upon such exercise is registered or qualified under the securities laws of the state of the exercising holder, or an exemption is available. In the event that the conditions in the two immediately preceding sentences are not satisfied with respect to a Warrant, the holder of such Warrant will not be entitled to exercise such Warrant and such Warrant may have no value and expire worthless.

We have agreed that as soon as practicable, but in no event later than 15 business days, after the Closing, we will use our best efforts to file with the SEC a registration statement for the registration, under the Securities Act, of the shares of Class A Common Stock issuable upon exercise of the Warrants. We will use our best efforts to cause the same to become effective and to maintain the effectiveness of such registration statement, and a current prospectus relating thereto, until the expiration of the Warrants in accordance with the provisions of the Warrant Agreement. Notwithstanding the above, if our shares of Class A Common Stock are at the time of any exercise of a Warrant not listed on a national securities exchange such that it satisfies the definition of a “covered security” under Section 18(b)(1) of the Securities Act, we may, at our option, require holders of Warrants who exercise their Warrants to do so a “cashless basis” in accordance with Section 3(a)(9) of the Securities Act and, in the event we so elect, we will not be required to file or maintain in effect a registration statement, but will use our best efforts to register or qualify the shares under applicable blue sky laws to the extent an exemption is not available.

Once the Warrants become exercisable, we may call the Warrants for redemption:


in whole and not in part;


at a price of $0.01 per Warrant;


upon not less than 30 days’ prior written notice of redemption (the “30-day redemption period”) to each warrant holder; and


if, and only if, the last reported sale price of the Class A Common Stock equals or exceeds $18.00 per share (as adjusted for share splits, share dividends, rights issuances, subdivisions, reorganizations, recapitalizations and the like) for any 20 trading days within a 30-trading day period ending on the third trading day prior to the date we send the notice of redemption to the warrant holders.

If and when the Warrants become redeemable by us, we may exercise our redemption right even if we are unable to register or qualify the underlying securities for sale under all applicable state securities laws.

We have established the last of the redemption criterion discussed above to prevent a redemption call unless there is at the time of the call a significant premium to the Warrant exercise price. If the foregoing conditions are satisfied and we issue a notice of redemption of the Warrants, each warrant holder will be entitled to exercise his, her or its Warrant prior to the scheduled redemption date. However, the price of the shares of Class A Common Stock may fall below the $18.00 redemption trigger price as well as the $11.50 Warrant exercise price after the redemption notice is issued.


206


Table of Contents

If we call the Warrants for redemption as described above, our management will have the option to require any holder that wishes to exercise his, her or its Warrant to do so on a “cashless basis.” In determining whether to require all holders to exercise their Warrants on a “cashless basis,” our management will consider, among other factors, our cash position, the number of Warrants that are outstanding and the dilutive effect on our shareholders of issuing the maximum number of shares of Class A Common Stock issuable upon the exercise of our Warrants. If our management takes advantage of this option, all holders of Warrants would pay the exercise price by surrendering their Warrants for that number of shares of Class A Common Stock equal to the quotient obtained by dividing (x) the product of the number of shares of Class A Common Stock underlying the Warrants, multiplied by the excess of the “fair market value” (defined below) over the exercise price of the Warrants by (y) the fair market value. The “fair market value” shall mean the average last reported sale price of the Class A Common Stock for the 10 trading days ending on the third trading day prior to the date on which the notice of redemption is sent to the holders of Warrants. If our management takes advantage of this option, the notice of redemption will contain the information necessary to calculate the number of shares of Class A Common Stock to be received upon exercise of the Warrants, including the “fair market value” in such case. Requiring a cashless exercise in this manner will reduce the number of shares to be issued and thereby lessen the dilutive effect of a Warrant redemption. We believe this feature is an attractive option to us if we do not need the cash from the exercise of the Warrants.

A holder of a Warrant may notify us in writing in the event it elects to be subject to a requirement that such holder will not have the right to exercise such Warrant, to the extent that after giving effect to such exercise, such person (together with such person’s affiliates), to the warrant agent’s actual knowledge, would beneficially own in excess of 9.8% (or such other amount as a holder may specify) of the shares of Class A Common Stock issued and outstanding immediately after giving effect to such exercise.

If the number of issued and outstanding shares of Class A Common Stock is increased by a capitalization or share dividend payable in shares of Class A Common Stock, or by a split-up of shares of Class A Common Stock or other similar event, then, on the effective date of such share dividend, split-up or similar event, the number of shares of Class A Common Stock issuable on exercise of each Warrant will be increased in proportion to such increase in the issued and outstanding shares of Class A Common Stock. A rights offering to holders of shares of Class A Common Stock entitling holders to purchase shares of Class A Common Stock at a price less than the fair market value will be deemed a share dividend of a number of shares of Class A Common Stock equal to the product of (1) the number of shares of Class A Common Stock actually sold in such rights offering (or issuable under any other equity securities sold in such rights offering that are convertible into or exercisable for shares of Class A Common Stock) multiplied by (2) one minus the quotient of (x) the price per share of Class A Common Stock paid in such rights offering divided by (y) the fair market value. For these purposes (1) if the rights offering is for securities convertible into or exercisable for shares of Class A Common Stock, in determining the price payable for Class A Common Stock, there will be taken into account any consideration received for such rights, as well as any additional amount payable upon exercise or conversion and (2) fair market value means the volume weighted average price of Class A Common Stock as reported during the 10 trading day period ending on the trading day prior to the first date on which the shares of Class A Common Stock trade on the applicable exchange or in the applicable market, regular way, without the right to receive such rights.

In addition, if we, at any time while the Warrants are outstanding and unexpired, pay a dividend or make a distribution in cash, securities or other assets to the holders of shares of Class A Common Stock on account of such shares of Class A Common Stock (or other shares of Class A Common Stock into which the Warrants are convertible), other than (a) as described above, (b) certain ordinary cash dividends, (c) to satisfy the redemption rights of the holders of Ordinary Shares in connection with the Business Combination or (d) to satisfy the redemption rights of the holders of Class A Common Stock in connection with the shareholder vote to amend the Company’s certificate of incorporation with respect to any provision relating to shareholders’ rights, or (e) in connection with any distribution of the Company’s assets upon its liquidation, then the Warrant exercise price will be decreased, effective immediately after the effective date of such event, by the amount of cash and/or the fair market value of any securities or other assets paid on each ordinary share in respect of such event.


207


Table of Contents

If the number of issued and outstanding shares of Class A Common Stock is decreased by a consolidation, combination, reverse share split or reclassification of shares of Class A Common Stock or other similar event, then, on the effective date of such consolidation, combination, reverse share split, reclassification or similar event, the number of shares of Class A Common Stock issuable on exercise of each Warrant will be decreased in proportion to such decrease in issued and outstanding shares of Class A Common Stock.

Whenever the number of shares of Class A Common Stock purchasable upon the exercise of the Warrants is adjusted, as described above, the Warrant exercise price will be adjusted by multiplying the Warrant exercise price immediately prior to such adjustment by a fraction (x) the numerator of which will be the number of shares of Class A Common Stock purchasable upon the exercise of the Warrants immediately prior to such adjustment, and (y) the denominator of which will be the number of shares of Class A Common Stock so purchasable immediately thereafter.

In case of any reclassification or reorganization of the issued and outstanding shares of Class A Common Stock (other than those described above or that solely affects the par value of such Class A Common Stock), or in the case of any merger or consolidation of us with or into another corporation (other than a consolidation or merger in which we are the continuing corporation and that does not result in any reclassification or reorganization of our issued and outstanding shares of Class A Common Stock), or in the case of any sale or conveyance to another corporation or entity of the assets or other property of us as an entirety or substantially as an entirety in connection with which we are dissolved, the holders of the Warrants will thereafter have the right to purchase and receive, upon the basis and upon the terms and conditions specified in the Warrants and in lieu of our shares of Class A Common Stock immediately theretofore purchasable and receivable upon the exercise of the rights represented thereby, the kind and amount of shares of stock or other securities or property (including cash) receivable upon such reclassification, reorganization, merger or consolidation, or upon a dissolution following any such sale or transfer, that the holder of the Warrants would have received if such holder had exercised their Warrants immediately prior to such event. However, if such holders were entitled to exercise a right of election as to the kind or amount of securities, cash or other assets receivable upon such consolidation or merger, then the kind and amount of securities, cash or other assets for which each Warrant will become exercisable will be deemed to be the weighted average of the kind and amount received per share by such holders in such consolidation or merger that affirmatively make such election, and if a tender, exchange or redemption offer has been made to and accepted by such holders under circumstances in which, upon completion of such tender or exchange offer, the maker thereof, together with members of any group (within the meaning of Rule 13d-5(b)(1) under the Exchange Act) of which such maker is a part, and together with any affiliate or associate of such maker (within the meaning of Rule 12b-2 under the Exchange Act) and any members of any such group of which any such affiliate or associate is a part, own beneficially (within the meaning of Rule 13d-3 under the Exchange Act) more than 50% of the issued and outstanding shares of Class A Common Stock, the holder of a Warrant will be entitled to receive the highest amount of cash, securities or other property to which such holder would actually have been entitled as a shareholder if such Warrant holder had exercised the Warrant prior to the expiration of such tender or exchange offer, accepted such offer and all of the shares of Class A Common Stock held by such holder had been purchased pursuant to such tender or exchange offer, subject to adjustment (from and after the consummation of such tender or exchange offer) as nearly equivalent as possible to the adjustments provided for in the Warrant Agreement. Additionally, if less than 70% of the consideration receivable by the holders of shares of Class A Common Stock in such a transaction is payable in the form of shares of Class A Common Stock in the successor entity that is listed for trading on a national securities exchange or is quoted in an established over-the-counter market, or is to be so listed for trading or quoted immediately following such event, and if the registered holder of the Warrant properly exercises the Warrant within 30 days following public disclosure of such transaction, the Warrant exercise price will be reduced as specified in the Warrant Agreement based on the per share consideration minus Black-Scholes Warrant Value (as defined in the Warrant Agreement) of the Warrant.

The Warrants were issued in registered form under the Warrant Agreement between Continental Stock Transfer & Trust Company, as warrant agent, and us. The Warrant Agreement provides that the terms of the


208


Table of Contents

Warrants may be amended without the consent of any holder to cure any ambiguity or correct any defective provision, but requires the approval by the holders of at least 65% of the then issued and outstanding Warrants to make any change that adversely affects the interests of the registered holders of Warrants.

The Warrants may be exercised upon surrender of the warrant certificate on or prior to the expiration date at the offices of the warrant agent, with the exercise form on the reverse side of the warrant certificate completed and executed as indicated, accompanied by full payment of the exercise price (or on a cashless basis, if applicable), by certified or official bank check payable to us, for the number of Warrants being exercised. The warrant holders do not have the rights or privileges of holders of shares of Class A Common Stock and any voting rights until they exercise their Warrants and receive shares of Class A Common Stock. After the issuance of shares of Class A Common Stock upon exercise of the Warrants, each holder will be entitled to one vote for each share held of record on all matters to be voted on by shareholders.

Dividends

The DGCL permits a corporation to declare and pay dividends out of “surplus” or, if there is no “surplus”, out of its net profits for the fiscal year in which the dividend is declared and/or the preceding fiscal year. “Surplus” is defined as the excess of the net assets of the corporation over the amount determined to be the capital of the corporation by the board of directors. The capital of the corporation is typically calculated to be (and cannot be less than) the aggregate par value of all issued shares of capital stock. Net assets equals the fair value of the total assets minus total liabilities. The DGCL also provides that dividends may not be paid out of net profits if, after the payment of the dividend, capital is less than the capital represented by the outstanding stock of all classes having a preference upon the distribution of assets.

We have not paid any cash dividends on our Class A Common Stock to date. The payment of cash dividends in the future will be within the discretion of our board of directors at such time.

The Company is a holding company with no material assets other than its interest in FoA. FoA intends to make distributions to holders of FoA Units in amounts sufficient to cover applicable taxes and other obligations under the Tax Receivable Agreements as well as any cash dividends declared by us.

The A&R LLC Agreement provides that pro rata cash distributions be made to holders of FoA Units at certain assumed tax rates, which we refer to as “tax distributions.” For more information, see the section entitled “Certain Relationships and Related Person Transactions—FoA Amended and Restated Limited Liability Company Agreement.” The A&R LLC Agreement provides for tax distributions to the holders of FoA Units if the board of managers determines that a holder, by reason of holding FoA Units, incurs an income tax liability.

Our Transfer Agent and Warrant Agent

The transfer agent for our Class A Common Stock and warrant agent for our Warrants is Continental Stock Transfer & Trust Company. We have agreed to indemnify Continental Stock Transfer & Trust Company in its roles as transfer agent and warrant agent, its agents and each of its shareholders, directors, officers and employees against all liabilities, including judgments, costs and reasonable counsel fees that may arise out of acts performed or omitted for its activities in that capacity, except for any liability due to any gross negligence, willful misconduct or bad faith of the indemnified person or entity.

Anti-Takeover Effects of the Amended and Restated Certificate of Incorporation and Amended and Restated Bylaws and Certain Provisions of Delaware Law

The A&R Charter, A&R Bylaws and the DGCL contain provisions that are summarized in the following paragraphs and that are intended to enhance the likelihood of continuity and stability in the composition of our board of directors. These provisions are intended to avoid costly takeover battles, reduce our


209


Table of Contents

vulnerability to a hostile or abusive change of control and enhance the ability of our board of directors to maximize stockholder value in connection with any unsolicited offer to acquire us. However, these provisions may have an anti-takeover effect and may delay, deter or prevent a merger or acquisition of the Company by means of a tender offer, a proxy contest or other takeover attempt that a stockholder might consider in its best interest, including those attempts that might result in a premium over the prevailing market price for the shares of common stock held by stockholders.

Authorized but Unissued Capital Stock

Delaware law does not require stockholder approval for any issuance of shares that are authorized and available for issuance. However, the listing requirements of the NYSE, which would apply so long as the shares of Class A common stock remain listed on the NYSE, require stockholder approval of certain issuances equal to or exceeding 20% of the then outstanding voting power or the then outstanding number of shares of Class A Common Stock (we believe the position of the NYSE is that the calculation in this latter case treats as outstanding shares issuable upon exchange of outstanding FoA Units not held by the Company). These additional shares may be used for a variety of corporate purposes, including future public offerings, to raise additional capital or to facilitate acquisitions.

Our board of directors may generally issue shares of one or more series of preferred stock on terms designed to discourage, delay or prevent a change of control of the Company or the removal of our management. Moreover, our authorized but unissued shares of preferred stock will be available for future issuances in one or more series without stockholder approval and could be utilized for a variety of corporate purposes, including future offerings to raise additional capital, to facilitate acquisitions and employee benefit plans.

One of the effects of the existence of authorized and unissued and unreserved Class A Common Stock or preferred stock may be to enable our board of directors to issue shares to persons friendly to current management, which issuance could render more difficult or discourage an attempt to obtain control of the Company by means of a merger, tender offer, proxy contest or otherwise, and thereby protect the continuity of our management and possibly deprive our stockholders of opportunities to sell their shares of Class A Common Stock at prices higher than prevailing market prices.

Business Combinations

We have opted out of Section 203 of the DGCL; however, the A&R Charter contains similar provisions providing that we may not engage in certain “business combinations” with any “interested stockholder” for a three-year period following the time that the stockholder became an interested stockholder, unless:


prior to such time, our board of directors approved either the business combination or the transaction that resulted in the stockholder becoming an interested stockholder;


upon consummation of the transaction that resulted in the stockholder becoming an interested stockholder, the interested stockholder owned at least 85% of our voting stock outstanding at the time the transaction commenced, excluding certain shares; or


at or subsequent to that time, the business combination is approved by our board of directors and by the affirmative vote of holders of at least 662/3% of our outstanding voting stock that is not owned by the interested stockholder.

Generally, a “business combination” includes a merger, asset or stock sale, or other transaction resulting in a financial benefit to the interested stockholder. Subject to certain exceptions, an “interested stockholder” is a person who, together with that person’s affiliates and associates, owns, or within the previous three years owned, 15% or more of our outstanding voting stock. For purposes of this section only, “voting stock” has the meaning given to it in Section 203 of the DGCL.


210


Table of Contents

Under certain circumstances, this provision will make it more difficult for a person who would be an “interested stockholder” to effect various business combinations with us for a three-year period. This provision may encourage companies interested in acquiring us to negotiate in advance with our board of directors because the stockholder approval requirement would be avoided if our board of directors approves either the business combination or the transaction that results in the stockholder becoming an interested stockholder. These provisions also may have the effect of preventing changes in our board of directors and may make it more difficult to accomplish transactions that stockholders may otherwise deem to be in their best interests.

The A&R Charter provides that the Principal Stockholders and their affiliates, and any of their respective direct or indirect transferees, and any group as to which such persons are a party, do not constitute “interested stockholders” for purposes of this provision.

Removal of Directors; Vacancies and Newly Created Directorships

The A&R Charter provides that, subject to the rights granted to one or more series of preferred stock then outstanding or the rights granted under the Stockholders Agreement, any newly-created directorship on the board of directors that results from an increase in the number of directors and any vacancies on our board of directors will be filled only by the affirmative vote of a majority of the remaining directors, even if less than a quorum, by a sole remaining director or by the stockholders; provided, however, at any time when our Principal Stockholders collectively beneficially own, in the aggregate, less than 30% of voting power of the stock of the Company entitled to vote generally in the election of directors, any newly-created directorship on the board of directors that results from an increase in the number of directors and any vacancy occurring in the board of directors may only be filled by a majority of the directors then in office, although less than a quorum, or by a sole remaining director (and not by the stockholders).

No Cumulative Voting

Under Delaware law, the right to vote cumulatively does not exist unless the certificate of incorporation specifically authorizes cumulative voting. The A&R Charter does not authorize cumulative voting. Therefore, stockholders holding a majority in voting power of the shares of our stock entitled to vote generally in the election of directors will be able to elect all of our directors.

Special Stockholder Meetings

The A&R Charter provides that special meetings of our stockholders may be called at any time only by or at the direction of the board of directors, the chairman of our board or the chief executive officer; provided, however, that at any time when our Principal Stockholders collectively beneficially own, in the aggregate, at least 30% in voting power of the stock entitled to vote generally in the election of directors, special meetings of our stockholders shall also be called by the board of directors or the chairman of the board of directors at the request of the Principal Stockholders. The A&R Bylaws prohibit the conduct of any business at a special meeting other than as specified in the notice for such meeting. These provisions may have the effect of deterring, delaying or discouraging hostile takeovers, or changes in control or management of the Company.

Director Nominations and Stockholder Proposals

The A&R Bylaws establish advance notice procedures with respect to stockholder proposals and the nomination of candidates for election as directors, other than nominations made by or at the direction of the board of directors or a committee of the board of directors. In order for any matter to be “properly brought” before a meeting, a stockholder will have to comply with advance notice requirements and provide us with certain information. Generally, to be timely, a stockholder’s notice must be received at our principal executive offices not less than 90 days nor more than 120 days prior to the first anniversary date of the immediately preceding annual meeting of stockholders. Our amended and restated bylaws also specify requirements as to the


211


Table of Contents

form and content of a stockholder’s notice. These provisions will not apply to the Principal Stockholders to the extent the Principal Stockholders are then subject to the Stockholders Agreement. The A&R Bylaws allow the chairman of the meeting at a meeting of the stockholders to adopt rules and regulations for the conduct of meetings which may have the effect of precluding the conduct of certain business at a meeting if the rules and regulations are not followed. These provisions may also defer, delay or discourage a potential acquirer from conducting a solicitation of proxies to elect the acquirer’s own slate of directors or otherwise attempting to influence or obtain control of the Company.

Stockholder Action by Written Consent

Pursuant to Section 228 of the DGCL, any action required to be taken at any annual or special meeting of the stockholders may be taken without a meeting, without prior notice, and without a vote if a consent or consents in writing, setting forth the action so taken, is or are signed by the holders of outstanding stock having not less than the minimum number of votes that would be necessary to authorize or take such action at a meeting at which all shares of our stock entitled to vote thereon were present and voted, unless our amended and restated certificate of incorporation provides otherwise. The A&R Charter does not permit our holders of Class A Common Stock to act by consent in writing, unless such action is recommended by all directors then in office, at any time when our Principal Stockholders collectively beneficially own, in the aggregate, less than 30% in voting power of our stock entitled to vote generally in the election of directors, but does permit our holders of Class B Common Stock to act by consent in writing without requiring any such recommendation by the directors then in office.

Dissenters’ Rights of Appraisal and Payment

Under the DGCL, with certain exceptions, our stockholders will have appraisal rights in connection with a merger or consolidation in which we are a constituent entity. Pursuant to the DGCL, stockholders who properly demand and perfect appraisal rights in connection with such merger or consolidation will have the right to receive payment of the fair value of their shares as determined by the Court of Chancery of the State of Delaware, plus interest, if any, on the amount determined to be the fair value, from the effective time of the merger or consolidation through the date of payment of the judgment.

Stockholders’ Derivative Actions

Under the DGCL, any of our stockholders may bring an action in our name to procure a judgment in our favor, also known as a derivative action, provided that the stockholder bringing the action is a holder of our shares at the time of the transaction to which the action relates or such stockholder’s stock thereafter devolved by operation of law. To bring such an action, the stockholder must otherwise comply with Delaware law regarding derivative actions.

Exclusive Forum

The A&R Charter provides that, unless we consent in writing to the selection of an alternative forum, the Court of Chancery of the State of Delaware will, to the fullest extent permitted by law, be the sole and exclusive forum for: (i) any derivative action or proceeding brought on our behalf; (ii) any action asserting a breach of fiduciary duty owed by any current or former director, officer, stockholder or employee of the company to the company or our stockholders; (iii) any action asserting a claim against us arising under the DGCL, our certificate of incorporation or our bylaws or as to which the DGCL confers jurisdiction on the Court of Chancery of the State of Delaware; or (iv) any action asserting a claim against us that is governed by the internal affairs doctrine.

Section 22 of the Securities Act creates concurrent jurisdiction for federal and state courts over all suits brought to enforce any duty or liability created by the Securities Act or the rules and regulations thereunder. The


212


Table of Contents

A&R Charter further provides that, unless we consent in writing to the selection of an alternative forum, to the fullest extent permitted by law, the federal district courts of the United States of America will be the exclusive forum for the resolution of any complaint asserting a cause of action arising under the federal securities laws of the United States, including the Securities Act and the Exchange Act and, in each case, the applicable rules and regulations promulgated thereunder. It is possible that a court could find these forum selection provisions to be inapplicable or unenforceable and, accordingly, the Company could be required to litigate claims in multiple jurisdictions, incur additional costs or otherwise not receive the benefits that the board of directors expects the Company’s forum selection provisions to provide.

To the fullest extent permitted by law, any person or entity purchasing or otherwise acquiring or holding any interest in shares of capital stock of our company shall be deemed to have notice of and consented to the forum provisions in the A&R Charter. However, investors will not be deemed to have waived compliance with the federal securities laws and the rules and regulations thereunder as a result of the forum selection provisions in the A&R Charter.

Conflicts of Interest

Delaware law permits corporations to adopt provisions renouncing any interest or expectancy in certain opportunities that are presented to the corporation or its officers, directors or stockholders. The A&R Charter, to the maximum extent permitted from time to time by Delaware law, renounces any interest or expectancy that we have in, or right to be offered an opportunity to participate in, specified business opportunities that are from time to time presented to our officers, directors or stockholders or their respective affiliates, other than those officers, directors, stockholders or affiliates who are our or our subsidiaries’ employees. The A&R Charter provides that, to the fullest extent permitted by law, none of the Principal Stockholders or any of their respective affiliates or any of our directors who are not employed by us (including any non-employee director who serves as one of our officers in both his or her director and officer capacities) or his or her affiliates will have any duty to refrain from (i) engaging in a corporate opportunity in the same or similar lines of business in which we or our affiliates now engage or propose to engage or (ii) otherwise competing with us or our affiliates. In addition, to the fullest extent permitted by law, in the event that the Principal Stockholders or any non-employee director acquires knowledge of a potential transaction or other business opportunity which may be a corporate opportunity for itself, himself or herself or its, his or her affiliates or for us or our affiliates, such person will have no duty to communicate or offer such transaction or business opportunity to us or any of our affiliates and they may take any such opportunity for themselves or offer it to another person or entity. The A&R Charter does not renounce our interest in any business opportunity that is expressly offered to a non-employee director solely in his or her capacity as a director or officer of the Company. To the fullest extent permitted by law, no business opportunity will be deemed to be a potential corporate opportunity for us unless we would be permitted to undertake the opportunity under the A&R Charter, we have sufficient financial resources to undertake the opportunity and the opportunity would be in line with our business.

Limitations on Liability and Indemnification of Officers and Directors

The DGCL authorizes corporations to limit or eliminate the personal liability of directors to corporations and their stockholders for monetary damages for breaches of directors’ fiduciary duties, subject to certain exceptions. The A&R Charter includes a provision that eliminates the personal liability of directors for monetary damages to the corporation or its stockholders for any breach of fiduciary duty as a director, except to the extent such exemption from liability or limitation thereof is not permitted under the DGCL. The effect of these provisions is to eliminate the rights of us and our stockholders, through stockholders’ derivative suits on our behalf, to recover monetary damages from a director for breach of fiduciary duty as a director, including breaches resulting from grossly negligent behavior. However, exculpation does not apply to any director if the director has breached such director’s duty of loyalty, acted in bad faith, knowingly or intentionally violated the law, authorized illegal dividends, redemptions or repurchases or derived an improper benefit from his or her actions as a director.


213


Table of Contents

The A&R Bylaws generally provide that we must indemnify and advance expenses to our directors and officers to the fullest extent authorized by the DGCL. We also are expressly authorized to carry directors’ and officers’ liability insurance providing indemnification for our directors, officers and certain employees for some liabilities. We believe that these indemnification and advancement provisions and insurance are useful to attract and retain qualified directors and executive officers.

The limitation of liability, indemnification and advancement provisions in our amended and restated certificate of incorporation and amended and restated bylaws may discourage stockholders from bringing a lawsuit against directors for breach of their fiduciary duty. These provisions also may have the effect of reducing the likelihood of derivative litigation against directors and officers, even though such an action, if successful, might otherwise benefit us and our stockholders. In addition, your investment may be adversely affected to the extent we pay the costs of settlement and damage awards against directors and officers pursuant to these indemnification provisions.

There is currently no pending material litigation or proceeding involving any of our directors, officers or employees for which indemnification is sought.

Rule 144

Rule 144 is not available for the resale of securities initially issued by shell companies (other than business combination related shell companies) or issuers that have been at any time previously a shell company, such as the Company. However, Rule 144 also includes an important exception to this prohibition if the following conditions are met:     


the issuer of the securities that was formerly a shell company has ceased to be a shell company;


the issuer of the securities is subject to the reporting requirements of Section 13 or 15(d) of the Exchange Act;


the issuer of the securities has filed all Exchange Act reports and material required to be filed, as applicable, during the preceding 12 months (or such shorter period that the issuer was required to file such reports and materials), other than Form 8-K reports; and


at least one year has elapsed from the time that the issuer filed current Form 10 type information with the SEC reflecting its status as an entity that is not a shell company.

Upon the Closing, the Company ceased to be a shell company.

When and if Rule 144 becomes available for the resale of our securities, a person who has beneficially owned restricted shares of our Class A Common Stock or Warrants for at least six months would be entitled to sell their securities, provided that (i) such person is not deemed to have been one of our affiliates at the time of, or at any time during the three months preceding, a sale and (ii) we are subject to the Exchange Act periodic reporting requirements for at least three months before the sale and have filed all required reports under Section 13 or 15(d) of the Exchange Act during the 12 months (or such shorter period as we were required to file reports) preceding the sale.

Persons who have beneficially owned restricted shares of our Class A Common Stock or Warrants for at least six months but who are our affiliates at the time of, or at any time during the three months preceding, a sale, would be subject to additional restrictions, by which such person would be entitled to sell within any three-month period only a number of securities that does not exceed the greater of:    


one percent (1%) of the total number of shares of common stock then outstanding; or


the average weekly reported trading volume of the Class A Common Stock during the four calendar weeks preceding the filing of a notice on Form 144 with respect to the sale.


214


Table of Contents

Sales by our affiliates under Rule 144 will also be limited by manner of sale provisions and notice requirements and to the availability of current public information about us.

Exchange Agreement

See “Certain Relationships and Related Person Transactions—Exchange Agreement.”

PIPE Agreements

See “Selling Securityholders—PIPE Agreements.”

Registration Rights

See “Certain Relationships and Related Person Transactions—Registration Rights Agreement.”

Listing of Securities

Our Class A Common Stock and our Warrants are listed on the NYSE under the symbols “FOA” and “FOA.WS”, respectively.


215


Table of Contents

PLAN OF DISTRIBUTION

We are registering 186,461,906 shares of Class A Common Stock, including up to 131,318,286 shares of Class A Common Stock issuable upon the exchange of an equal number of FoA Units, for possible sale by the Selling Securityholders from time to time and the up to 14,374,971 shares of Class A Common Stock that are issuable upon the exercise of the Warrants by the holders thereof.

We will not receive any proceeds from the sale of shares of Class A Common Stock by the Selling Securityholders. We will receive proceeds from the exercise of the Warrants, assuming the exercise in full of all of the Warrants for cash. The aggregate proceeds to the Selling Securityholders will be the purchase price of the securities less any discounts and commissions borne by the Selling Securityholders.

The Selling Securityholders will pay any underwriting discounts and commissions and expenses incurred by the Selling Securityholders for brokerage, accounting, tax or legal services or any other expenses incurred by the Selling Securityholders in disposing of the securities. We are required to pay all other fees and expenses incident to the registration of the shares of our Class A Common Stock to be offered and sold pursuant to this prospectus.

The shares of Class A Common Stock beneficially owned by the Selling Securityholders covered by this prospectus may be offered and sold from time to time by the Selling Securityholders. The term “Selling Securityholders” includes donees, pledgees, transferees or other successors in interest selling securities received after the date of this prospectus from a Selling Securityholder as a gift, pledge, partnership distribution or other transfer.

The Selling Securityholders will act independently of us in making decisions with respect to the timing, manner and size of each sale. Such sales may be made on one or more exchanges or in the over-the-counter market or otherwise, at prices and under terms then prevailing or at prices related to the then current market price or in negotiated transactions. Each Selling Securityholder reserves the right to accept and, together with its respective agents, to reject, any proposed purchase of securities to be made directly or through agents. The Selling Securityholders and any of their permitted transferees may sell their securities offered by this prospectus on any stock exchange, market or trading facility on which the securities are traded or in private transactions. If underwriters are used in the sale, such underwriters will acquire the shares for their own account. These sales may be at a fixed price or varying prices, which may be changed, or at market prices prevailing at the time of sale, at prices relating to prevailing market prices or at negotiated prices. The securities may be offered to the public through underwriting syndicates represented by managing underwriters or by underwriters without a syndicate. Except as otherwise set forth in a prospectus supplement, any underwritten offering pursuant to this prospectus will be underwritten by one, several or all of the following financial institutions: Barclays Capital Inc., Blackstone Securities Partners L.P., BofA Securities, Inc., Citigroup Global Markets Inc., Credit Suisse Securities (USA) LLC, Deutsche Bank Securities Inc., Goldman Sachs & Co. LLC, Jefferies LLC, J.P. Morgan Securities LLC, Morgan Stanley & Co. LLC, Piper Sandler & Co., Raymond James & Associates, Inc., RBC Capital Markets, LLC, UBS Securities LLC and Wells Fargo Securities, LLC. The obligations of the underwriters to purchase the securities will be subject to certain conditions.

The Selling Securityholders may sell their shares by one or more of, or a combination of, the following methods:


purchases by a broker-dealer as principal and resale by such broker-dealer for its own account pursuant to this prospectus;


ordinary brokerage transactions and transactions in which the broker solicits purchasers;


block trades in which the broker-dealer so engaged will attempt to sell the shares as agent but may position and resell a portion of the block as principal to facilitate the transaction;


an over-the-counter distribution in accordance with the rules of the NYSE;


216


Table of Contents
   

through trading plans entered into by a Selling Securityholder pursuant to Rule 10b5-1 under the Exchange Act, that are in place at the time of an offering pursuant to this prospectus and any applicable prospectus supplement hereto that provide for periodic sales of their securities on the basis of parameters described in such trading plans;


through one or more underwritten offerings on a firm commitment or best efforts basis;


settlement of short sales entered into after the date of this prospectus;


agreements with broker-dealers to sell a specified number of the securities at a stipulated price per share or warrant;


in “at the market” offerings, as defined in Rule 415 under the Securities Act, at negotiated prices, at prices prevailing at the time of sale or at prices related to such prevailing market prices, including sales made directly on a national securities exchange or sales made through a market maker other than on an exchange or other similar offerings through sales agents;


in privately negotiated transactions;


in options transactions;


through a combination of any of the above methods of sale; or


any other method permitted pursuant to applicable law.

There can be no assurance that the Selling Securityholders will sell all or any of the securities offered by this prospectus. In addition, any shares that qualify for sale pursuant to Rule 144 may be sold under Rule 144 rather than pursuant to this prospectus. The Selling Securityholders have the sole and absolute discretion not to accept any purchase offer or make any sale of securities if they deem the purchase price to be unsatisfactory at any particular time.

Subject to the terms of the agreement(s) governing the registration rights applicable to a Selling Securityholder’s shares of Class A Common Stock, such Selling Securityholder may transfer shares of Class A Common Stock to one or more “permitted transferees” in accordance with such agreements and, if so transferred, such permitted transferee(s) will be the selling beneficial owner(s) for purposes of this prospectus. Upon being notified by a Selling Securityholder interest intends to sell our securities, we will, to the extent required, promptly file a supplement to this prospectus to name specifically such person as a Selling Securityholder.

With respect to a particular offering of the securities held by the Selling Securityholders, to the extent required, an accompanying prospectus supplement or, if appropriate, a post-effective amendment to the registration statement of which this prospectus is part, will be prepared and will set forth the following information:


the specific securities to be offered and sold;


the names of the selling securityholders;


the respective purchase prices and public offering prices, the proceeds to be received from the sale, if any, and other material terms of the offering;


settlement of short sales entered into after the date of this prospectus;


the names of any participating agents, broker-dealers or underwriters, if not already named herein; and


any applicable commissions, discounts, concessions and other items constituting compensation from the selling securityholders.


217


Table of Contents

In connection with distributions of the shares or otherwise, the Selling Securityholders may enter into hedging transactions with broker-dealers or other financial institutions. In connection with such transactions, broker-dealers or other financial institutions may engage in short sales of shares of Class A Common Stock in the course of hedging transactions, broker-dealers or other financial institutions may engage in short sales of shares of Class A Common Stock in the course of hedging the positions they assume with Selling Securityholders. The Selling Securityholders may also sell shares of Class A Common Stock short and redeliver the shares to close out such short positions. The Selling Securityholders may also enter into option or other transactions with broker-dealers or other financial institutions which require the delivery to such broker-dealer or other financial institution of shares offered by this prospectus, which shares such broker-dealer or other financial institution may resell pursuant to this prospectus (as supplemented or amended to reflect such transaction). The Selling Securityholders may also pledge shares to a broker-dealer or other financial institution, and, upon a default, such broker-dealer or other financial institution, may effect sales of the pledged shares pursuant to this prospectus (as supplemented or amended to reflect such transaction).

In order to facilitate the offering of the securities, any underwriters or agents, as the case may be, involved in the offering of such securities may engage in transactions that stabilize, maintain or otherwise affect the price of our securities. Specifically, the underwriters or agents, as the case may be, may overallot in connection with the offering, creating a short position in our securities for their own account. In addition, to cover overallotments or to stabilize the price of our securities, the underwriters or agents, as the case may be, may bid for, and purchase, such securities in the open market. Finally, in any offering of securities through a syndicate of underwriters, the underwriting syndicate may reclaim selling concessions allotted to an underwriter or a broker-dealer for distributing such securities in the offering if the syndicate repurchases previously distributed securities in transactions to cover syndicate short positions, in stabilization transactions or otherwise. Any of these activities may stabilize or maintain the market price of the securities above independent market levels. The underwriters or agents, as the case may be, are not required to engage in these activities, and may end any of these activities at any time.

The Selling Securityholders may solicit offers to purchase the securities directly from, and may sell such securities directly to, institutional investors or others. In this case, no underwriters or agents would be involved. The terms of any of those sales, including the terms of any bidding or auction process, if utilized, will be described in the applicable prospectus supplement.

It is possible that one or more underwriters may make a market in our securities, but such underwriters will not be obligated to do so and may discontinue any market making at any time without notice. We cannot give any assurance as to the liquidity of the trading market for our securities. Our shares of Class A Common Stock and Warrants are currently listed on NYSE under the symbols “FOA” and “FOA.WS,” respectively.

The Selling Securityholders may authorize underwriters, broker-dealers or agents to solicit offers by certain purchasers to purchase the securities at the public offering price set forth in the prospectus supplement pursuant to delayed delivery contracts providing for payment and delivery on a specified date in the future. The contracts will be subject only to those conditions set forth in the prospectus supplement, and the prospectus supplement will set forth any commissions we or the Selling Securityholders pay for solicitation of these contracts.

A Selling Securityholder may enter into derivative transactions with third parties, or sell securities not covered by this prospectus to third parties in privately negotiated transactions. If the applicable prospectus supplement indicates, in connection with those derivatives, the third parties may sell securities covered by this prospectus and the applicable prospectus supplement, including in short sale transactions. If so, the third party may use securities pledged by any Selling Securityholder or borrowed from any Selling Securityholder or others to settle those sales or to close out any related open borrowings of stock, and may use securities received from any Selling Securityholder in settlement of those derivatives to close out any related open borrowings of stock. The third party in such sale transactions will be an underwriter and will be identified in the applicable prospectus


218


Table of Contents

supplement (or a post-effective amendment). In addition, any Selling Securityholder may otherwise loan or pledge securities to a financial institution or other third party that in turn may sell the securities short using this prospectus. Such financial institution or other third party may transfer its economic short position to investors in our securities or in connection with a concurrent offering of other securities.

In effecting sales, broker-dealers or agents engaged by the Selling Securityholders may arrange for other broker-dealers to participate. Broker-dealers or agents may receive commissions, discounts or concessions from the Selling Securityholders in amounts to be negotiated immediately prior to the sale.

In compliance with the guidelines of the Financial Industry Regulatory Authority (“FINRA”), the aggregate maximum discount, commission, fees or other items constituting underwriting compensation to be received by any FINRA member or independent broker-dealer will not exceed 8% of the gross proceeds of any offering pursuant to this prospectus and any applicable prospectus supplement.

If at the time of any offering made under this prospectus a member of FINRA participating in the offering has a “conflict of interest” as defined in FINRA Rule 5121 (“Rule 5121”), that offering will be conducted in accordance with the relevant provisions of Rule 5121.

To our knowledge, there are currently no plans, arrangements or understandings between the Selling Securityholders and any broker-dealer or agent regarding the sale of the securities by the Selling Securityholders. Upon our notification by a Selling Securityholder that any material arrangement has been entered into with an underwriter or broker-dealer for the sale of securities through a block trade, special offering, exchange distribution, secondary distribution or a purchase by an underwriter or broker-dealer, we will file, if required by applicable law or regulation, a supplement to this prospectus pursuant to Rule 424(b) under the Securities Act disclosing certain material information relating to such underwriter or broker-dealer and such offering.

Underwriters, broker-dealers or agents may facilitate the marketing of an offering online directly or through one of their affiliates. In those cases, prospective investors may view offering terms and a prospectus online and, depending upon the particular underwriter, broker-dealer or agent, place orders online or through their financial advisors.

In offering the shares covered by this prospectus, the Selling Securityholders and any broker-dealers who execute sales for the Selling Securityholders may be deemed to be “underwriters” within the meaning of the Securities Act in connection with such sales. Any discounts, commissions, concessions or profit they earn on any resale of those securities may be underwriting discounts and commissions under the Securities Act..

The underwriters, broker-dealers and agents may engage in transactions with us or the Selling Securityholders, may have banking, lending or other relationships with us or perform services for us or the Selling Securityholders, in the ordinary course of business.

In order to comply with the securities laws of certain states, if applicable, the shares must be sold in such jurisdictions only through registered or licensed brokers or dealers. In addition, in certain states the shares may not be sold unless they have been registered or qualified for sale in the applicable state or an exemption from the registration or qualification requirement is available and is complied with.

We have advised the Selling Securityholders that the anti-manipulation rules of Regulation M under the Exchange Act may apply to sales of shares in the market and to the activities of the Selling Securityholders and their affiliates. In addition, we will make copies of this prospectus available to the Selling Securityholders for the purpose of satisfying the prospectus delivery requirements of the Securities Act. The Selling Securityholders may indemnify any broker-dealer that participates in transactions involving the sale of the shares against certain liabilities, including liabilities arising under the Securities Act.


219


Table of Contents

At the time a particular offer of shares is made, if required, a prospectus supplement will be distributed that will set forth the number of shares being offered and the terms of the offering, including the name of any underwriter, dealer or agent, the purchase price paid by any underwriter, any discount, commission and other item constituting compensation, any discount, commission or concession allowed or reallowed or paid to any dealer, and the proposed selling price to the public.

A holder of Warrants may exercise its Warrants in accordance with the Warrant Agreement on or before the expiration date set forth therein by surrendering, at the office of the warrant agent, Continental Stock Transfer & Trust Company, the certificate evidencing such Warrant, with the form of election to purchase set forth thereon, properly completed and duly executed, accompanied by full payment of the exercise price and any and all applicable taxes due in connection with the exercise of the Warrant, subject to any applicable provisions relating to cashless exercises in accordance with the Warrant Agreement.


220


Table of Contents

MATERIAL U.S. FEDERAL INCOME TAX CONSIDERATIONS

The following is a summary of certain United States federal income tax consequences of the ownership and disposition of our Class A common stock. This summary deals only with Class A common stock that is held as a capital asset by a non-U.S. holder (as defined below).

A “non-U.S. holder” means a beneficial owner of our Class A common stock (other than an entity or arrangement treated as a partnership for United States federal income tax purposes) that is not, for United States federal income tax purposes, any of the following:


an individual citizen or resident of the United States;


a corporation (or any other entity treated as a corporation for United States federal income tax purposes) created or organized in or under the laws of the United States, any state thereof or the District of Columbia;


an estate the income of which is subject to United States federal income taxation regardless of its source; or


a trust if it (1) is subject to the primary supervision of a court within the United States and one or more United States persons have the authority to control all substantial decisions of the trust or (2) has a valid election in effect under applicable United States Treasury regulations to be treated as a United States person.

This summary is based upon provisions of the Internal Revenue Code of 1986, as amended (the “Code”), and regulations, rulings and judicial decisions as of the date hereof. Those authorities may be changed, perhaps retroactively, so as to result in United States federal income tax consequences different from those summarized below. This summary does not address all of the United States federal income tax consequences that may be relevant to you in light of your particular circumstances, nor does it address the Medicare tax on net investment income, United States federal estate and gift taxes or the effects of any state, local or non-United States tax laws. In addition, it does not represent a detailed description of the United States federal income tax consequences applicable to you if you are subject to special treatment under the United States federal income tax laws (including if you are a United States expatriate, foreign pension fund, “controlled foreign corporation,” “passive foreign investment company” or a partnership or other pass-through entity for United States federal income tax purposes). We cannot assure you that a change in law will not alter significantly the tax considerations that we describe in this summary.

If a partnership (or other entity or arrangement treated as a partnership for United States federal income tax purposes) holds our Class A common stock, the tax treatment of a partner generally will depend upon the status of the partner and the activities of the partnership. If you are a partnership or a partner of a partnership considering an investment in our Class A common stock, you should consult your tax advisors.

If you are considering the purchase of our Class A common stock, you should consult your own tax advisors concerning the particular United States federal income tax consequences to you of the ownership and disposition of our Class A common stock, as well as the consequences to you arising under other United States federal tax laws and the laws of any other taxing jurisdiction.

Dividends

In the event that we make a distribution of cash or other property (other than certain pro rata distributions of our stock) in respect of our Class A common stock, the distribution generally will be treated as a dividend for United States federal income tax purposes to the extent it is paid from our current or accumulated earnings and profits, as determined under United States federal income tax principles. Any portion of a distribution that exceeds our current and accumulated earnings and profits generally will be treated first as a


221


Table of Contents

tax-free return of capital, causing a reduction in the adjusted tax basis of a non-U.S. holder’s Class A common stock, and to the extent the amount of the distribution exceeds a non-U.S. holder’s adjusted tax basis in our Class A common stock, the excess will be treated as gain from the disposition of our Class A common stock (the tax treatment of which is discussed below under “—Gain on Disposition of Class A Common Stock”).

Dividends paid to a non-U.S. holder generally will be subject to withholding of United States federal income tax at a 30% rate or such lower rate as may be specified by an applicable income tax treaty. However, dividends that are effectively connected with the conduct of a trade or business by the non-U.S. holder within the United States (and, if required by an applicable income tax treaty, are attributable to a United States permanent establishment) are not subject to the withholding tax, provided certain certification and disclosure requirements are satisfied. Instead, such dividends are subject to United States federal income tax on a net income basis generally in the same manner as if the non-U.S. holder were a United States person as defined under the Code. Any such effectively connected dividends received by a foreign corporation may be subject to an additional “branch profits tax” at a 30% rate or such lower rate as may be specified by an applicable income tax treaty.

A non-U.S. holder who wishes to claim the benefit of an applicable treaty rate and avoid backup withholding, as discussed below, for dividends will be required (a) to provide the applicable withholding agent with a properly executed Internal Revenue Service (“IRS”) Form W-BEN or Form W-8BEN-E (or other applicable form) certifying under penalty of perjury that such holder is not a United States person as defined under the Code and is eligible for treaty benefits or (b) if our Class A common stock is held through certain foreign intermediaries, to satisfy the relevant certification requirements of applicable United States Treasury regulations. Special certification and other requirements apply to certain non-U.S. holders that are pass-through entities rather than corporations or individuals.

A non-U.S. holder eligible for a reduced rate of United States federal withholding tax pursuant to an income tax treaty may obtain a refund of any excess amounts withheld by timely filing an appropriate claim for refund with the IRS.

Gain on Disposition of Class A Common Stock

Subject to the discussion of backup withholding below, any gain realized by a non-U.S. holder on the sale or other disposition of our Class A common stock generally will not be subject to United States federal income tax unless:


the gain is effectively connected with a trade or business of the non-U.S. holder in the United States (and, if required by an applicable income tax treaty, is attributable to a United States permanent establishment of the non-U.S. holder);


the non-U.S. holder is an individual who is present in the United States for 183 days or more in the taxable year of that disposition, and certain other conditions are met; or


we are or have been a “United States real property holding corporation” for United States federal income tax purposes and certain other conditions are met.

A non-U.S. holder described in the first bullet point immediately above will be subject to tax on the gain derived from the sale or other disposition in the same manner as if the non-U.S. holder were a United States person as defined under the Code. In addition, if any non-U.S. holder described in the first bullet point immediately above is a foreign corporation, the gain realized by such non-U.S. holder may be subject to an additional “branch profits tax” at a 30% rate or such lower rate as may be specified by an applicable income tax treaty. An individual non-U.S. holder described in the second bullet point immediately above will be subject to a 30% (or such lower rate as may be specified by an applicable income tax treaty) tax on the gain derived from the sale or other disposition, which gain may be offset by United States source capital losses even though the individual is not considered a resident of the United States.


222


Table of Contents

Generally, a corporation is a “United States real property holding corporation” if the fair market value of its United States real property interests equals or exceeds 50% of the sum of the fair market value of its worldwide real property interests and its other assets used or held for use in a trade or business (all as determined for United States federal income tax purposes). We believe we are not and do not anticipate becoming a “United States real property holding corporation” for United States federal income tax purposes.

Information Reporting and Backup Withholding

Distributions paid to a non-U.S. holder and the amount of any tax withheld with respect to such distributions generally will be reported to the IRS. Copies of the information returns reporting such distributions and any withholding may also be made available to the tax authorities in the country in which the non-U.S. holder resides under the provisions of an applicable income tax treaty.

A non-U.S. holder will not be subject to backup withholding on distributions received if such holder certifies under penalty of perjury that it is a non-U.S. holder (and the payor does not have actual knowledge or reason to know that such holder is a United States person as defined under the Code), or such holder otherwise establishes an exemption.

Information reporting and, depending on the circumstances, backup withholding will apply to the proceeds of a sale or other disposition of our Class A common stock within the United States or conducted through certain United States-related financial intermediaries, unless the beneficial owner certifies under penalty of perjury that it is a non-U.S. holder (and the payor does not have actual knowledge or reason to know that the beneficial owner is a United States person as defined under the Code), or such owner otherwise establishes an exemption.

Backup withholding is not an additional tax and any amounts withheld under the backup withholding rules will be allowed as a refund or a credit against a non-U.S. holder’s United States federal income tax liability provided the required information is timely furnished to the IRS.

Additional Withholding Requirements

Under Sections 1471 through 1474 of the Code (such Sections commonly referred to as “FATCA”), a 30% United States federal withholding tax may apply to any dividends paid on our Class A common stock to (i) a “foreign financial institution” (as specifically defined in the Code and whether such foreign financial institution is the beneficial owner or an intermediary) which does not provide sufficient documentation, typically on IRS Form W-8BEN-E, evidencing either (x) an exemption from FATCA, or (y) its compliance (or deemed compliance) with FATCA (which may alternatively be in the form of compliance with an intergovernmental agreement with the United States) in a manner which avoids withholding, or (ii) a “non-financial foreign entity” (as specifically defined in the Code and whether such non-financial foreign entity is the beneficial owner of an intermediary) which does not provide sufficient documentation, typically on IRS Form W-8BEN-E, evidencing either (x) an exemption from FATCA, or (y) adequate information regarding certain substantial United States beneficial owners of such entity (if any). If a dividend payment is both subject to withholding under FATCA and subject to the withholding tax discussed above under “—Dividends,” an applicable withholding agent may credit the withholding under FATCA against, and therefore reduce, such other withholding tax. While withholding under FATCA would also have applied to payments of gross proceeds from the sale or other taxable disposition of our Class A common stock, proposed United States Treasury regulations (upon which taxpayers may rely until final regulations are issued) eliminate FATCA withholding ono payments of gross proceeds entirely. You should consult your own tax advisors regarding these requirements and whether they may be relevant to your ownership and disposition of our Class A common stock.


223


Table of Contents

LEGAL MATTERS

The validity of the securities offered by this prospectus has been passed upon for us by Simpson Thacher & Bartlett LLP, Washington, D.C. An investment vehicle comprised of selected partners of Simpson Thacher & Bartlett LLP, members of their families, related persons and others owns an interest representing less than 1% of the capital commitments of funds affiliated with Blackstone. If the validity of any securities is also passed upon by counsel for the underwriters, dealers or agents of an offering of those securities, that counsel will be named in the applicable prospectus supplement.

EXPERTS

The consolidated financial statements of FoA as of December 31, 2020 and 2019 and for the years ended December 31, 2020, 2019 and 2018 and the financial statements of Replay as of December 31, 2020 and 2019 and for the years ended December 31, 2020 and 2019, included in this prospectus, have been so included in reliance on the reports of BDO USA, LLP, an independent registered public accounting firm, appearing elsewhere herein and in the prospectus, given on the authority of said firm as experts in auditing and accounting.

WHERE YOU CAN FIND MORE INFORMATION

We are required to file annual, quarterly and current reports, proxy statements and other information with the SEC. You may inspect these reports and other information without charge at a website maintained by the SEC. The address of this site is http://www.sec.gov.

Our website address is www.financeofamerica.com. Through our website, we make available, free of charge, the following documents as soon as reasonably practicable after they are electronically filed with, or furnished to, the SEC, including our Annual Reports on Form 10-K; our proxy statements for our annual and special stockholder meetings; our Quarterly Reports on Form 10-Q; our Current Reports on Form 8-K and Forms 3, 4 and 5 with respect to our securities filed on behalf of our directors and our executive officers; and amendments to those documents. The information contained on, or that may be accessed through, our website is not part of, and is not incorporated into, this prospectus.


224


Table of Contents

INDEX TO FINANCIAL STATEMENTS


Audited Consolidated Financial Statements of Finance of America Equity Capital LLC as of December 31, 2020 and 2019 and for the years ended December 31, 2020, 2019 and 2018


Report of Independent Registered Public Accounting Firm

     F-2  

Consolidated Statements of Financial Condition

     F-6  

Consolidated Statements of Operations and Comprehensive Income

     F-8  

Consolidated Statements of Changes in Members’ Equity

     F-9  

Consolidated Statements of Cash Flows

     F-10  

Notes to Consolidated Financial Statements

     F-13  

Unaudited Consolidated Financial Statements of Finance of America Equity Capital LLC as of March 31, 2021 and for the three months ended March 31, 2021 and 2020


Consolidated Statements of Financial Condition

     F-112  

Consolidated Statements of Operations and Comprehensive Income

     F-114  

Consolidated Statements of Changes in Members’ Equity

     F-115  

Consolidated Statements of Cash Flows

     F-116  

Notes to Consolidated Financial Statements

     F-119  

Audited Financial Statements of Replay Acquisition Corp as of December 31, 2020 and 2019 and for the years ended December 31, 2020 and 2019


Report of Independent Registered Public Accounting Firm

     F-184  

Balance Sheets as of December 31, 2020 and 2019

     F-185  

Statements of Operations for the years ended December  31, 2020 and December 31, 2019

     F-186  

Statements of Changes in Shareholders’ Equity for the years ended December 31, 2020 and December 31, 2019

     F-187  

Statements of Cash Flows for the year ended December  31, 2020 and December 31, 2019

     F-188  

Notes to Financial Statements

     F-189  

Unaudited Financial Statements of Replay Acquisition Corp. as of March 31, 2021 and for the three months ended March 31, 2021 and 2020


Balance Sheets as of March 31, 2021 (Unaudited) and December 31, 2020

     F-226  

Unaudited Statements of Operations for the three months ended March 31, 2021 and 2020

     F-227  

Unaudited Statements of Changes in Shareholders’ Equity for the three months ended March 31, 2021 and 2020

     F-228  

Unaudited Statements of Cash Flows for the three months ended March 31, 2021 and 2020

     F-229  

Notes to Unaudited Financial Statements

     F-230  


F-1


Table of Contents

Report of Independent Registered Public Accounting Firm

To the Members of the Audit Committee

Finance of America Equity Capital LLC and its Subsidiaries

Dallas, Texas

Opinion on the Consolidated Financial Statements

We have audited the accompanying consolidated statements of financial condition of Finance of America Equity Capital LLC and Subsidiaries (the “Company”) as of December 31, 2020 and 2019, the related consolidated statements of operations and comprehensive income, changes in members’ equity, and cash flows for each of the three years in the period ended December 31, 2020, and the related notes (collectively referred to as the “consolidated financial statements”). In our opinion, the consolidated financial statements present fairly, in all material respects, the financial position of the Company at December 31, 2020 and 2019, and the results of its operations and its cash flows for each of the three years in the period ended December 31, 2020, in conformity with accounting principles generally accepted in the United States of America.

Change in Accounting Principle

As discussed in Note 2 to the consolidated financial statements, effective January 1, 2019, the Company changed its method of accounting for leases due to the adoption of Accounting Standards Codification Topic 842, Leases.

Basis for Opinion

These consolidated financial statements are the responsibility of the Company’s management. Our responsibility is to express an opinion on the Company’s consolidated financial statements based on our audits. We are a public accounting firm registered with the Public Company Accounting Oversight Board (United States) (“PCAOB”) and are required to be independent with respect to the Company in accordance with the U.S. federal securities laws and the applicable rules and regulations of the Securities and Exchange Commission and the PCAOB.

We conducted our audits in accordance with the standards of the PCAOB. Those standards require that we plan and perform the audit to obtain reasonable assurance about whether the consolidated financial statements are free of material misstatement, whether due to error or fraud. The Company is not required to have, nor were we engaged to perform, an audit of its internal control over financial reporting. As part of our audits we are required to obtain an understanding of internal control over financial reporting but not for the purpose of expressing an opinion on the effectiveness of the Company’s internal control over financial reporting. Accordingly, we express no such opinion.

Our audits included performing procedures to assess the risks of material misstatement of the consolidated financial statements, whether due to error or fraud, and performing procedures that respond to those risks. Such procedures included examining, on a test basis, evidence regarding the amounts and disclosures in the consolidated financial statements. Our audits also included evaluating the accounting principles used and significant estimates made by management, as well as evaluating the overall presentation of the consolidated financial statements. We believe that our audits provide a reasonable basis for our opinion.

Critical Audit Matters

The critical audit matters communicated below are matters arising from the current period audit of the consolidated financial statements that were communicated or required to be communicated to the audit committee and that: (1) relate to accounts or disclosures that are material to the consolidated financial statements and (2) involved our especially challenging, subjective, or complex judgments. The communication of critical


F-2


Table of Contents

audit matters does not alter in any way our opinion on the consolidated financial statements, taken as a whole, and we are not, by communicating the critical audit matters below, providing separate opinions on the critical audit matters or on the accounts or disclosures to which they relate.

Fair Value of Certain Level 3 Financial Instruments

As described in Note 2 and 5 to the consolidated financial statements, the Company has $16.5 billion of its assets, and $15.1 billion of its liabilities, measured at fair value on a recurring basis and are classified as level 3 within the fair value hierarchy as they contain one or more inputs into the valuation which are unobservable and significant to their fair value measurement. The Company utilized internally developed valuation models and unobservable inputs to estimate the fair value of these level 3 financial instruments.

We have identified the fair value of mortgage loans held for investment and nonrecourse debt, which are Level 3 financial instruments, as a critical audit matter. There was significant judgment and estimation by management in determining the unobservable inputs used to estimate the fair value of these mortgage loans and related obligations, including prepayment and repayment speed, loss frequency, default and loss severity, home price appreciation, and draw curve assumptions. Auditing these elements involved especially challenging and subjective auditor judgment due to the nature and extent of audit effort required to address these matters, including specialized skill and knowledge needed.

The primary procedures we perform to address this critical audit matter included:


Testing the accuracy of a sample of the unpaid principal balance of the mortgage loan data utilized in the valuation model by confirming balances with borrowers, comparing data to the loan origination documents, and obtaining and inspecting supporting documentation for loan activity.


Testing the completeness and accuracy of the mortgage loan activity and historical results underlying the loss frequency, default and loss severity, prepayment and repayment speeds, and draw curve assumptions.


Utilizing professionals with specialized skill and knowledge in valuation to assist in:


Testing the reasonableness of the valuation methodologies used and assessing the accuracy of the Company’s valuation models by independently calculating the fair value using the Company’s inputs.


Evaluating the reasonableness of a sample of appraisal reports and developing an independent estimate of home price appreciation rates.


Testing the unobservable inputs used by the Company by comparing to current industry, market data and economic trends.

Fair Value of Mortgage Servicing Rights Assets

As described in Note 2, 5, and 11 to the consolidated financial statements, the Company has elected to account for the Company’s mortgage servicing rights assets at fair value, with a balance of $180.7 million as of December 31, 2020. Management estimates the fair value of mortgage servicing rights using a discounted cash flow model, which forecasts cash flows over the life of the loans in conjunction with the Company’s prepayment model, and then discounts these cash flows to present value using static discount rates. The key economic assumptions used to determine the fair value of mortgage servicing rights are prepayment speeds and discount rates.

We identified the valuation of mortgage servicing rights assets as a critical audit matter. There was significant judgment and estimation by management in determining the fair value of mortgage servicing rights, including the determination of prepayment speed and discount rate assumptions. Auditing these elements involved especially challenging and subjective auditor judgment due to the nature and extent of audit effort required to address these matters, including specialized skill and knowledge needed.


F-3


Table of Contents

The primary procedures we perform to address this critical audit matter included:


Testing the completeness and accuracy of the prepayment speed and discount rate assumptions.


Utilizing professionals with specialized skill and knowledge in valuation to assist in testing and evaluating the reasonableness of prepayment speeds and discount rate assumptions, including utilizing information obtained from market participants and recent market activity on other mortgage servicing right transactions to test management’s assumptions and identify potential sources of contradictory information.

/s/ BDO USA, LLP

We have served as the Company’s auditor since 2020.

Philadelphia, Pennsylvania

March 26, 2021


F-4


Table of Contents

Consolidated Financial Statements


F-5


Table of Contents

Finance of America Equity Capital LLC and Subsidiaries

Consolidated Statements of Financial Condition

(Dollars in thousands)


     December 31,  
     2020     2019  

ASSETS


Cash and cash equivalents

   $ 233,101     $ 118,083  

Restricted cash

     306,262       264,581  

Reverse mortgage loans held for investment, subject to HMBS related obligations, at fair value

     9,929,163       9,480,504  

Mortgage loans held for investment, subject to nonrecourse debt, at fair value

     5,396,167       3,511,212  

Mortgage loans held for investment, at fair value

     730,821       1,414,073  

Mortgage loans held for sale, at fair value

     2,222,811       1,251,574  

Debt securities, $— and $102,110 held at fair value, respectively

     10,773       114,701  

Mortgage servicing rights, at fair value

     180,684       2,600  

Derivative assets

     92,065       15,553  

Fixed assets and leasehold improvements, net

     24,512       26,686  

Goodwill

     121,233       121,137  

Intangible assets, net

     16,931       18,743  

Due from related parties

     2,559       2,814  

Other assets, net

     298,073       241,840  


TOTAL ASSETS

   $ 19,565,155     $ 16,584,101  


LIABILITIES, CONTINGENTLY REDEEMABLE NONCONTROLLING INTEREST (“CRNCI”) AND MEMBERS’ EQUITY


HMBS related obligations, at fair value

   $ 9,788,668     $ 9,320,209  

Nonrecourse debt, at fair value

     5,257,754       3,490,196  

Other financing lines of credit

     2,973,743       2,749,413  

Payables and other liabilities

     414,146       326,176  

Notes payable, net

     336,573       27,313  


TOTAL LIABILITIES

     18,770,884       15,913,307  


Commitments and contingencies (Note 26)


CRNCI

     166,231       187,981  

MEMBERS’ EQUITY


FoA Equity Capital LLC members’ equity

     628,176       482,719  

Accumulated other comprehensive income (loss)

     9       (51

Noncontrolling interest

     (145     145  


TOTAL MEMBERS’ EQUITY

     628,040       482,813  


TOTAL LIABILITIES, CRNCI AND MEMBERS’ EQUITY

   $ 19,565,155     $ 16,584,101  


See accompanying notes to consolidated financial statements


F-6


Table of Contents

Finance of America Equity Capital LLC and Subsidiaries

Consolidated Statements of Financial Condition

(Dollars in thousands)


The following table presents the assets and liabilities of the Company’s consolidated variable interest entities, which are included on the Consolidated Statements of Financial Condition above, and excludes intercompany balances and other retained beneficial interests that eliminate in consolidation.


     December 31,  
     2020      2019  

ASSETS


Restricted cash

   $ 293,580      $ 226,408  

Mortgage loans held for investment, subject to nonrecourse debt, at fair value:


2019 FASST JR2

     488,760        505,009  

2019 FASST JR3

     450,703        460,344  

2018 FASST JR1

     449,069        506,786  

2020 FASST HB2

     398,480        —    

2019 FASST JR4

     377,265        367,380  

2020 FASST JR3

     372,015        —    

2020 FASST JR2

     341,439        —    

2019 FASST JR1

     331,244        348,919  

2020 FASST S3

     316,774        —    

2020 FASST S2

     311,721        —    

2020 FASST HB1

     265,923        —    

2018 FASST JR2

     264,622        276,125  

2020 FASST JR1

     263,266        —    

2020 FASST-JR4

     237,100        —    

2020 FASST S1

     189,243        —    

2020 RTL1 ANTLR

     137,989        —    

2019 RTL1 ANTLR

     118,161        221,143  

2018 RTL1 ANTLR

     82,393        222,099  

2018 FASST HB1

     —          206,586  

2019 FASST HB1

     —          201,382  

2019 FAHB 19-1

     —          195,439  

Other assets

     79,528        75,115  


TOTAL ASSETS

   $ 5,769,275      $ 3,812,735  


LIABILITIES


Nonrecourse debt, at fair value


2020 FASST HB2

   $ 472,074        —    

2019 FASST JR2

     463,568        474,134  

2018 FASST JR1

     450,268        507,516  

2019 FASST JR3

     423,406        427,264  

2019 FASST JR4

     350,514        343,172  

2020 FASST JR3

     337,024        —    

2019 FASST JR1

     326,367        332,829  

2020 FASST HB1

     298,913        —    

2020 FASST S2

     298,435        —    

2020 FASST JR2

     297,046        —    

2020 FASST S3

     294,226        —    

2018 FASST JR2

     265,695        274,139  

2020 FASST JR1

     238,438        —    

2020 FASST JR4

     217,362        —    

2020 FASST S1

     181,630        —    

2020 RTL1 ANTLR

     140,441        —    

2019 RTL1 ANTLR

     121,580        206,176  

2018 RTL1 ANTLR

     80,767        210,738  

2018 FASST HB1

     —          224,053  

2019 FASST HB1

     —          236,726  

2019 FAHB 19-1

     —          253,449  

Payables and other liabilities

     291        13  


TOTAL LIABILITIES

   $ 5,258,045      $ 3,490,209  


Net fair value of assets subject to nonrecourse debt

   $ 511,230      $ 322,526  


See accompanying notes to consolidated financial statements


F-7


Table of Contents

Finance of America Equity Capital LLC and Subsidiaries

Consolidated Statements of Operations and Comprehensive Income

(Dollars in thousands)


     For the year ended December 31,  
     2020     2019     2018  

REVENUES


Gain on sale and other income from mortgage loans held for sale, net

   $ 1,178,995     $ 464,308     $ 400,302  

Net fair value gains on mortgage loans and related obligations

     311,698       329,526       310,864  

Fee income

     386,752       201,628       151,602  

Net interest expense:


Interest income

     42,584       37,323       35,334  

Interest expense

     (123,001     (138,731     (108,840


Net interest expense

     (80,417     (101,408     (73,506


TOTAL REVENUES

     1,797,028       894,054       789,262  


EXPENSES


Salaries, benefits and related expenses

     868,265       529,250       485,463  

Occupancy, equipment rentals and other office related expenses

     29,621       32,811       37,957  

General and administrative expenses

     398,885       254,414       218,311  


TOTAL EXPENSES

     1,296,771       816,475       741,731  


NET INCOME BEFORE INCOME TAXES

     500,257       77,579       47,531  

Provision for income taxes

     2,344       949       286  


NET INCOME

     497,913       76,630       47,245  

CRNCI

     (21,749     21,707       15,244  

Noncontrolling interest

     1,274       511       (61


NET INCOME ATTRIBUTABLE TO FOA EQUITY CAPITAL LLC

     518,388       54,412       32,062  

COMPREHENSIVE INCOME (LOSS) ITEM:


Impact of foreign currency translation adjustment

     60       47       (44


COMPREHENSIVE INCOME ATTRIBUTABLE TO FOA EQUITY CAPITAL LLC

   $ 518,448     $ 54,459     $ 32,018  


See accompanying notes to consolidated financial statements


F-8


Table of Contents

Finance of America Equity Capital LLC and Subsidiaries

Consolidated Statements of Changes in Members’ Equity

(Dollars in thousands)


     FoA
Members’
Equity
    Accumulated
Other
Comprehensive
Income (Loss)
    Noncontrolling
Interest
    Total  

Balance at December 31, 2017

   $ 393,827     $ (54   $ 109     $ 393,882  

Members’ contributions

     1,162       —         —         1,162  

Share based compensation

     341       —         —         341  

Net income (loss) attributable to FoA Equity Capital LLC

     32,062       —         (61     32,001  

Foreign currency translation adjustment

     —         (44     —         (44


Balance at December 31, 2018

     427,392       (98     48       427,342  

Members’ contributions

     795       —         —         795  

Distributions to members

     (2,799     —         —         (2,799

Noncontrolling interest contributions

     —         —         25       25  

Noncontrolling interest distributions

     —         —         (439     (439

Share based compensation

     2,919       —         —         2,919  

Net income attributable to FoA Equity Capital LLC

     54,412       —         511       54,923  

Foreign currency translation adjustment

     —         47       —         47  


Balance at December 31, 2019

     482,719       (51     145       482,813  

Members’ contributions

     7,500       —         —         7,500  

Distributions to members

     (380,431     —         —         (380,431

Noncontrolling interest contributions

     —         —         104       104  

Noncontrolling interest distributions

     —         —         (1,668     (1,668

Net income attributable to FoA Equity Capital LLC

     518,388       —         1,274       519,662  

Foreign currency translation adjustment

     —         60       —         60  


Balance at December 31, 2020

   $ 628,176     $ 9     $ (145   $ 628,040  


See accompanying notes to consolidated financial statements


F-9


Table of Contents

Finance of America Equity Capital LLC and Subsidiaries

Consolidated Statements of Cash Flows

(Dollars in thousands)


     For the year ended December 31,  
     2020     2019     2018  

Operating activities


Net income

   $ 497,913     $ 76,630     $ 47,245  

Adjustments to reconcile net income to net cash (used in) provided by operating activities:


Gain on sale and other income from mortgage loans held for sale, net

     (1,178,995     (464,308     (400,302

Unrealized changes on mortgage loans, related obligations and derivatives

     (275,485     (280,662     (286,594

Change in fair value of mortgage servicing rights

     (4,562     1,357       (1,730

Depreciation and amortization

     19,327       19,341       14,355  

Impairment of ROU asset

     702       1,689       2,824  

Change in fair value of nonrecourse MSR financing liability

     (798     —         —    

Impairment of goodwill

     —         422       —    

Deferred tax assets

     (231     (96     (18

Change in fair value of deferred purchase price liabilities

     3,014       (1,804     (1,525

Change in fair value of equity securities

     —         (1,429     (2,168

Loss on investments

     3,838       —         —    

Share based compensation

     —         2,919       341  

Non-cash expense related to leases

     3,824       5,658       —    

Provision for claims

     3,520       1,417       277  

Interest rate swap settlements

     (15,922     (18,338     (1,696

Originations/purchases of mortgage loans held for sale

     (29,407,723     (15,695,648     (14,867,264

Proceeds from sale of mortgage loans held for sale

     29,628,177       16,488,142       16,031,316  

Changes in operating assets and liabilities:


Other assets, net

     33,058       (72,203     93,088  

Payables and accrued expenses

     4,253       38,038       (22,268


Net cash (used in) provided by operating activities

     (686,090     101,125       605,881  


Investing activities


Purchases and originations of mortgage loans held for investment

     (3,637,299     (3,547,544     (2,012,443

Proceeds/payments received on mortgage loans held for investment

     1,822,409       920,768       1,086,166  

Purchases and originations of mortgage loans held for investment, subject to nonrecourse debt

     (44,705     (45,782     (18,723

Proceeds/payments received on mortgage loans held for investment, subject to nonrecourse debt

     913,824       760,013       137,453  

Purchases of debt securities

     (39,264     (128,828     —    

Purchases of mortgage servicing rights

     (14,088     —         —    

Proceeds/payments received on debt securities

     140,787       20,487       —    

Proceeds on sale of mortgage servicing rights

     —         2,497       17,311  

Acquisition of fixed assets

     (9,027     (4,289     (15,368

Purchase of investments

     (3,937     (2,063     (6,133

Payments on deferred purchase price liability

     (3,610     (894     (646

Acquisition of subsidiaries, net of cash acquired

     (197     —         (4,635


Net cash used in investing activities

     (875,107     (2,025,635     (817,018


F-10


Table of Contents

Finance of America Equity Capital LLC and Subsidiaries

Consolidated Statements of Cash Flows

(Dollars in thousands)


     For the year ended December 31,  
     2020     2019     2018  

Financing activities


Proceeds from securitizations of mortgage loans, subject to HMBS related obligations

     2,051,954       1,310,343       1,469,578  

Payments on HMBS related obligations

     (1,943,445     (1,974,683     (2,232,650

Proceeds from issuance of nonrecourse debt

     3,074,047       2,343,707       1,406,708  

Payments on nonrecourse debt

     (1,637,612     (558,808     (217,127

Proceeds from other financing lines of credit

     35,215,086       23,785,157       20,355,608  

Payments on other financing lines of credit

     (34,968,807     (22,825,625     (20,451,201

Debt issuance costs

     (16,981     (8,795     (5,327

Issuance of note payable

     350,000       —         —    

Payments on notes payable

     (46,771     (505     (3,219

Issuance of note receivable

     —         —         (3,500

Payments on note receivable

     —         —         3,500  

Principal payments under capital lease obligation

     —         (297     (270

Proceeds from issuance of nonrecourse MSR financing liability

     15,101       —         —    

Payments on nonrecourse MSR financing liability

     (215     —         —    

Noncontrolling interest distributions

     (1,668     (439     —    

Noncontrolling interest contributions

     104       25       —    

Members distributions

     (380,431     (2,676     —    

Members contributions

     7,500       524       65  


Net cash provided by financing activities

     1,717,862       2,067,928       322,165  


Foreign currency translation adjustment

     34       22       (44


Net increase in cash and restricted cash

     156,699       143,440       110,984  

Cash and restricted cash, beginning of period

     382,664       239,224       128,240  


Cash and restricted cash, end of period

   $ 539,363     $ 382,664     $ 239,224  


Supplementary Cash Flows Information


Cash paid for interest

   $ 169,362     $ 159,165     $ 124,931  

Cash paid for taxes

     1,447       698       128  

Loans transferred to mortgage loans held for investment, at fair value, from mortgage loans held for investment, subject to nonrecourse debt, at fair value

     568,439       263,645       746,548  

Loans transferred to mortgage loans held for sale, at fair value, from mortgage loans held for investment, at fair value

     183,578       828,845       1,499,263  

Loans transferred to government guaranteed receivables from mortgage loans held for investment, at fair value, and mortgage loans held for sale, at fair value

     28,599       75,080       66,574  

Loans transferred to mortgage loans held for investment, subject to nonrecourse debt, at fair value, from mortgage loans held for investment, at fair value

     2,729,356       2,796,514       1,381,137  

Non-cash members’ contributions

     —         271       1,097  

Non-cash members’ distributions

     —         123       —    

See accompanying notes to consolidated financial statements


F-11


Table of Contents

Notes to Consolidated Financial Statements


F-12


Table of Contents

Finance of America Equity Capital LLC and Subsidiaries

Notes to Consolidated Financial Statements


1.

Organization and Description of Business

Finance of America Equity Capital LLC (“FoA” or the “Company”) is a limited liability company that was formed in July 2020. FoA is a wholly-owned subsidiary of UFG Holdings LLC (“UFG”). FoA is a financial services holding company which, through its operating subsidiaries, is a leading originator and servicer of residential mortgage loans and provider of complementary financial services.

FoA owns all of the outstanding equity interests or has a controlling financial interest in Finance of America Holdings LLC (“FAH”) and Incenter LLC (“Incenter”), which are wholly owned subsidiaries of Finance of America Funding LLC (“FOAF”) (collectively known as “operating subsidiaries”).

The Company, through its primary operating subsidiary FAH, originates, purchases, sells and securitizes conventional (conforming to the underwriting standards of Fannie Mae or Freddie Mac; collectively referred to as government sponsored entities (“GSEs”), government-insured (Federal Housing Administration (“FHA”)), government guaranteed (Department of Veteran Affairs), and proprietary non-Agency forward and reverse mortgages. In addition, FAH also serves as a specialty finance company which originates a variety of commercial mortgage loans to owners and investors of single and multi-family residential rental properties. The Company, through its other operating subsidiary, Incenter, also provides lender services, title services, secondary markets advisory, mortgage trade brokerage, appraisal and capital management services to customers in the residential mortgage, student lending, and commercial lending industries. Incenter is a wholly owned subsidiary of the Company, and operates a foreign branch in the Philippines for fulfillment transactional support.

Recent Developments

On January 30, 2020, the World Health Organization (“WHO”) announced a global health emergency because of a new strain of coronavirus (the “COVID-19 outbreak”) and the risks to the international community as the virus spreads globally beyond its point of origin. In March 2020, the WHO classified the COVID-19 outbreak as a pandemic, based on the rapid increase in exposure globally. The full impact of the COVID-19 outbreak continues to evolve as of the date of this report.

The COVID-19 outbreak has adversely impacted global financial markets and contributed to significant volatility in market liquidity and yields required by market investors in the type of financial instruments originated by the Company’s primary operating subsidiaries. The pandemic and related government responses are creating disruption in global supply chains and adversely impacting virtually all industries. Although the Company cannot estimate the length or gravity of the impact of the COVID-19 outbreak will have on the residential mortgage and commercial lending industries at this time, if the pandemic continues, it may have an adverse effect on the Company’s results of future operations, financial position, intangible assets and liquidity in fiscal year 2020. Management is actively monitoring the global situation and its effect on the Company’s financial condition, liquidity, operations, suppliers, industry, and workforce.

On March 27, 2020, the Coronavirus Aid, Relief, and Economic Security Act (the “CARES Act”) was enacted into law. The CARES Act, among other things, includes provisions relating to refundable payroll tax credits, deferment of employer side social security payments, net operating loss carryback periods, alternative minimum tax credit refunds, modifications to the net interest deduction limitations, increased limitations on qualified charitable contributions, and technical corrections to tax depreciation methods for qualified improvement property. The Company continues to examine the impact that the CARES Act may have on the business. The CARES Act had no material impact to the Company’s consolidated financial statements. As of December 31, 2020, the COVID-19 pandemic remains in place and impact the economic environment in which the Company conducts business.


F-13


Table of Contents

Finance of America Equity Capital LLC and Subsidiaries

Notes to Consolidated Financial Statements


2.

Summary of Significant Accounting Policies

Basis of Presentation

FoA is a holding company formed under the laws of the State of Delaware in July 2020. Through its Parent, the Company is owned by Libman Family Holdings, LLC, certain investment funds affiliated with The Blackstone Group Inc. (“Blackstone”) and other co-investors (collectively, the “Initial Investors”). There are no historical operating results as, contemporaneous with the formation of FoA, UFG contributed all of its operating subsidiaries into FoA in a common control reorganization. The reorganization was accounted for as a reorganization under common control and, accordingly, the historical basis of accounting was retained as if the entities had always been combined for financial reporting purposes. The Company conducts substantially all of its business operations through its operating subsidiaries. In October 2020, UFG and FoA entered into a transaction agreement with a special purpose acquisition company (“SPAC”), pursuant to which, the SPAC will acquire an equity interest in FoA from its Initial Investors.

The consolidated financial statements of the Company have been prepared in accordance with U.S. generally accepted accounting principles (“GAAP”). The significant accounting policies described below, together with the other notes that follow, are an integral part of the consolidated financial statements.

Principles of Consolidation

The consolidated financial statements include the accounts of the Company and its wholly-owned subsidiaries and certain variable interest entities (“VIEs”) where the Company is the primary beneficiary. The Company is deemed to be the primary beneficiary of a VIE when it has both (1) the power to direct the activities of the VIE that most significantly impact the entity’s economic performance, and (2) exposure to benefits and/or losses that could potentially be significant to the entity. Assets and liabilities of VIEs and their respective results of operations are consolidated from the date that the Company became the primary beneficiary through the date that the Company ceases to be the primary beneficiary.

The company consolidates the accounts of Finance of America Commercial Holdings LLC (“FACo Holdings”), the noncontrolling interests of which meet the definition of contingently redeemable financial instruments for which the ability to redeem is outside the control of the consolidating entity. The Contingently Redeemable Noncontrolling Interest (“CRNCI”) in this subsidiary is shown as a separate caption between liabilities and equity. Any income or losses attributable to the CRNCI are shown as an addition to or deduction from CRNCI in the Consolidated Statements of Financial Condition. All significant intercompany balances and transactions have been eliminated.

Use of Estimates

The preparation of consolidated financial statements in conformity with GAAP requires the Company to make estimates and assumptions that affect the reported amounts of assets and liabilities at the date of the consolidated financial statements and the reported amounts of revenues and expenses during the reporting period. Actual results may differ from those estimates and assumptions due to factors such as changes in the economy, interest rates, secondary market pricing, prepayment assumptions, home prices or discrete events affecting specific borrowers, and such differences could be material.

Business Combinations

In accordance with Accounting Standards Codification (“ASC”) 805, Business Combinations (“ASC 805”), the Company applies the acquisition method to all transactions and other events in which the entity obtains control


F-14


Table of Contents

Finance of America Equity Capital LLC and Subsidiaries

Notes to Consolidated Financial Statements


over one or more other businesses. Assets acquired and liabilities assumed are measured at fair value as of the acquisition date. Liabilities related to contingent consideration are recognized at the acquisition date and re-measured at fair value in each subsequent reporting period. Goodwill is recognized if the consideration transferred exceeds the fair value of the net assets acquired.

VIEs

The Company has been the transferor in connection with securitizations or asset-backed financing arrangements with special purpose entities (“SPE”), in which the Company has continuing involvement with the underlying transferred financial assets. The Company’s continuing involvement includes acting as servicer for the mortgage loans transferred and retaining beneficial interests in the SPE to which the assets were transferred.

The Company evaluates its interests in each SPE for classification as a VIE in accordance with ASC 810-10 Consolidation. When an SPE meets the definition of a VIE and the Company determines that it is the VIE’s primary beneficiary, the Company includes the SPE in its consolidated financial statements.

The beneficial interests held consist of residual securities that were retained at the time of securitization. These beneficial interests may obligate the Company to absorb losses of the VIE that could potentially be significant to the VIE, or affords the Company the right to receive benefits from the VIE that could potentially be significant. In addition, when the Company acts as servicer of the transferred assets, the Company retains the power to direct the activities of the VIE that most significantly impact the economic performance of the VIE. When it is determined that the Company has both the power to direct the activities that most significantly impact the economic performance of the VIE and the obligation to absorb losses or the right to receive benefits that could potentially be significant to the VIE, the assets and liabilities of these VIEs are included in the consolidated financial statements of the Company. The Company reassesses its evaluation of an entity as a VIE upon the occurrence of certain reconsideration events.

The Company elected the fair value option provided for by ASC 825-10, Financial Instruments-Overall. This option was applied for the nonrecourse debt issued by the consolidated VIE.

See Note 3 - VIEs for further discussion of VIEs in which the Company is deemed to be the primary beneficiary.

Contingently Redeemable Noncontrolling Interest

Per the Amended and Restated Limited Liability Company Agreement of Finance of America Commercial Holdings LLC (“the FACo Holdings Agreement”), the Class B-1 and Class B-2 Units may only be redeemed upon sale of Finance of America Commercial LLC (“FACo”) by FACo Holdings, sale of FAH, or sale of UFG, which would require FAH to purchase the outstanding Class B Units. As such, the CRNCI has continued to be shown as a separate caption between liabilities and equity. The Company has determined that the legal provisions in the FACo Holdings Agreement in which there is a noncontrolling interest represent a substantive profit-sharing arrangement, where the allocation to the members differs from the stated ownership percentages. The Company utilizes the hypothetical liquidation at book value, or HLBV, method for the allocation of profits and losses each period. Under the HLBV method, the amounts of income and loss attributed to the noncontrolling interests in the Consolidated Statements of Operations and Comprehensive Income reflects changes in the amounts each member would hypothetically receive at each balance sheet date under the liquidation provisions of the FACo Holdings Agreement, assuming the net assets of FACo Holdings were liquidated at their respective recorded amounts.


F-15


Table of Contents

Finance of America Equity Capital LLC and Subsidiaries

Notes to Consolidated Financial Statements


Noncontrolling Interest

Noncontrolling interest represents the Company’s less than 50% ownership interest in consolidated subsidiaries which are not attributable, directly or indirectly, to the Company. Net income is reduced by the portion of net income that is attributable to noncontrolling interests.

Cash and Cash Equivalents

The Company considers all highly liquid investments with original maturities of three months or less to be cash equivalents. These investments are with high quality financial, governmental or corporate institutions and potentially subject the Company to concentrations of credit risk.

Restricted Cash

Restricted cash includes amounts specifically designated to repay debt and provide over-collateralization within warehouse facilities and securitized nonrecourse debt obligations, custodial accounts related to the Company’s portfolio of mortgage loans serviced for investors, and funds deposited from prospective borrowers to cover out-of- pocket expenses incurred by the Company in connection with due diligence activities performed during the loan approval process. Certain funds deposited with the Company may be returned to the borrower at the time the loan funds or if the loan does not close. The Company records a liability for these amounts until the loan has closed or a cost has been incurred.

Reverse Mortgage Loans Held for Investment, Subject to Home Equity Conversion Mortgage (HECM) Mortgage- Backed Security (HMBS) Related Obligations, at Fair Value

The Company elected the fair value option provided for by ASC 825-10, Financial Instruments-Overall. A reverse home equity conversion mortgage (“HECM”) is a reverse mortgage loan available to homeowners aged 62 or older that allows conversion of a portion of the home’s equity into cash. The HECM loan terms do not have a defined maturity date or a scheduled repayment of principal and interest. Interest rates are tied to an index plus a margin that ranges up to three percentage points. Interest compounds over the life of the loan and is not paid by the borrower until the loan is repaid. HECM loans include a monthly mortgage insurance premium (“MIP”) that is payable to FHA. The MIP amount is typically calculated as 0.5% of the mortgage balance for loans originated prior to October 2, 2017 and 1.25% for loans originated after October 2, 2017 and accretes to the borrower’s loan balance over the life of the loan. As the issuer, the Company is responsible for remitting the MIP to FHA.

A maturity event will cause the loan to become due and payable. Maturity events include: borrower has passed away and the property is not the principal residence of at least one surviving borrower; borrower has sold or conveyed title of the property to a third party; the property is no longer the principal residence of at least one borrower for reasons other than death; the borrower does not maintain the property as principal residence for a period exceeding 12 months; the borrower fails to pay property taxes and/or insurance and all attempts to rectify the situation have been exhausted; and the property is in disrepair and the borrower has refused or is unable to repair the property.

Once a loan has become due and payable, unsecuritized borrower advances cannot be placed into a Ginnie Mae (“GNMA”) Home Equity Conversion Mortgage-Backed Securities (“HMBS”). Generally, the Company recovers such advances (referred to as unpoolable tails) from borrowers, from proceeds of liquidation of collateral or ultimate disposition of the loan, including conveyance of claims to FHA.

If the loan is not paid within six months of the maturity event, the Company may proceed with foreclosure on the property. A loan may be satisfied by borrower repayment, sales- or appraisal-based claim submissions to the


F-16


Table of Contents

Finance of America Equity Capital LLC and Subsidiaries

Notes to Consolidated Financial Statements


Department of Housing and Urban Development (“HUD”) and/or foreclosure sale proceeds. If the Company sells the property within six months, it may file a sales-based claim with HUD to recover any shortfall between the sales price of the property and the outstanding loan balance. If the property is not sold within six months, the Company may file an appraisal-based claim with HUD to recover any shortfall between the appraised value and the outstanding loan balance. Once the appraisal based claim is paid by HUD, any subsequent expenses or loss in the property’s value exposes the Company to additional losses that may not be eligible to be recouped through the filing of an additional HUD claim.

The Company has determined that HECM loans transferred under the current GNMA HMBS securitization program do not meet the requirements for sale accounting and are not derecognized upon date of transfer. The GNMA HMBS securitization program includes certain terms that do not meet the participating interest requirements and require or provide an option for the Company to reacquire the loans prior to maturity. Due to these terms, the transfer of the loans does not meet the requirements of sale accounting. As a result, the Company accounts for HECM loans transferred into HMBS securitizations as secured borrowings and continues to recognize the loans as held for investment, subject to HMBS related obligations, along with the corresponding liability for the HMBS related obligations. No gains or losses are recognized on these transfers of HECM loans into HMBS securitizations.

Loans are considered nonperforming upon events such as, but not limited to, the death of the mortgagor, the mortgagor no longer occupying the property as their principal residence, or the property taxes or insurance not being paid. In addition to having to fund these repurchases, the Company also typically earns a lower interest rate and incurs certain non-reimbursable costs during the process of liquidating nonperforming loans. Loans purchased out of GNMA HMBS are recorded in the Consolidated Statements of Financial Condition at their fair value reflective of proceeds of liquidation of collateral or ultimate disposition of the loan.

Reverse mortgage loans held for investment, subject to HMBS related obligations, also include claims receivable that have been submitted to HUD awaiting reimbursement. These amounts are recorded net of amounts the Company does not expect to recover through outstanding claims.

The yield recognized on loans held for investment, subject to HMBS related obligations, and changes in estimated fair value are recorded in net fair value gains on mortgage loans and related obligations in the Consolidated Statements of Operations and Comprehensive Income. The yield recognized includes the recognition of interest income based on the stated interest rates of the loans that is expected to be collected through conveyance of loans to FHA, repayment by borrower or through disposition of real estate upon foreclosure.

Loan origination fees represent an up-front fee charged to a borrower for processing the HECM or jumbo reverse mortgage application and are recorded as they are received when a loan is successfully funded in fee income in the Consolidated Statements of Operations and Comprehensive Income. Costs to originate loans are recognized as incurred and recorded in general and administrative expenses in the Consolidated Statements of Operations and Comprehensive Income.

Certain HECM and jumbo reverse mortgage loans originated or acquired by the Company include broker compensation or correspondent fees. These premiums are remitted to the mortgage broker or correspondent lender who acted as the intermediary for the reverse mortgage. Broker compensation and correspondent fees are recorded on a net basis in net fair value gains on mortgage loans and related obligations in the Consolidated Statements of Operations and Comprehensive Income and therefore not separately presented.


F-17


Table of Contents

Finance of America Equity Capital LLC and Subsidiaries

Notes to Consolidated Financial Statements


See Note 5 - Fair Value for further discussion of valuation of reverse mortgage loans held for investment, subject to HMBS related obligations.

Mortgage Loans Held for Investment, Subject to Nonrecourse Debt, at Fair Value

Mortgage loans held for investment, subject to nonrecourse debt, are loans that were securitized and serve as collateral for the issued nonrecourse debt, including reverse mortgage loans that were previously repurchased out of a HMBS pool (“HECM Buyouts”), fix & flip securitized loans, and non FHA-insured jumbo reverse mortgages (“non-agency reverse mortgages - Securitized”) that were subsequently securitized into trusts that meet the definition of a VIE and were consolidated. The Company has determined that it has both the power to direct the activities that most significantly impact the economic performance of the VIE and the obligation to absorb losses or the right to receive benefits that could potentially be significant to the VIE. The Company has elected the fair value option for all loans held for investment and determines the fair value, on a recurring basis, based on discounted cash flow models. The difference between the cost basis of newly originated or acquired loans and their estimated fair value is recognized in net fair value gains on mortgage loans and related obligations in the Consolidated Statements of Operations and Comprehensive Income. No gains or losses are recognized on these transfers of these loans into securitizations. See Note 5 - Fair Value for further discussion of valuation of mortgage loans held for investment, subject to nonrecourse debt.

The yield recognized on loans held for investment, subject to nonrecourse debt, and changes in estimated fair value are recorded in net fair value gains on mortgage loans and related obligations in the Consolidated Statements of Operations and Comprehensive Income. The yield recognized includes the contractual interest income that is expected to be collected based on the stated interest rates of the loans.

Mortgage Loans Held for Investment, at Fair Value

Mortgage loans held for investment, at fair value, consists of certain reverse mortgage and commercial mortgage loans that the Company intends to hold to maturity. The Company has elected the fair value option for all loans held for investment and determines the fair value, on a recurring basis, based on discounted cash flow models. These valuations require the use of judgment by the Company and changes in assumptions can have a significant impact on the determination of the loan’s fair value. The difference between the cost basis of newly originated or acquired loans and their estimated fair value is recognized in net fair value gains on mortgage loans and related obligations in the Consolidated Statements of Operations and Comprehensive Income. See Note 5 - Fair Value for further discussion of valuation of mortgage loans held for investment.

The yield recognized on loans held for investment and changes in estimated fair value are recorded in net fair value gains on mortgage loans and related obligations in the Consolidated Statements of Operations and Comprehensive Income. The yield recognized includes the contractual interest income that is expected to be collected based on the stated interest rates of the loans.

Reverse Mortgage Loans

Reverse mortgage loans held for investment consists of originated or purchased HECM and non-agency reverse mortgage loans not yet securitized, unsecuritized tails, and certain HECMs purchased out of GNMA HMBS, which the Company intends to hold to maturity.

HECM loans and tails that have not yet been securitized into HMBS consist primarily of newly-issued HECMs that the Company has either originated or purchased, subsequent borrower draws and amounts paid by the Company on the borrower’s behalf for MIP that have not yet been transferred to a GNMA securitization.


F-18


Table of Contents

Finance of America Equity Capital LLC and Subsidiaries

Notes to Consolidated Financial Statements


As a jumbo reverse mortgage, non-agency reverse mortgage loans are designated for homeowners aged 62 or older with higher priced homes. The minimum home value is $500 thousand and the maximum loan amount is $4 million. non-agency reverse mortgage loans are not insured by the FHA and will not be placed into a GNMA HMBS. However, the Company may transfer or pledge these assets as collateral for securitized nonrecourse debt obligations.

The Company, as an issuer of HMBS, is required to repurchase reverse loans out of the GNMA securitization pools once the outstanding principal balance of the related HECM is equal to or greater than 98% of the Maximum Claim Amount (“MCA”) (referred to as HECM Buyouts). Performing repurchased loans are conveyed to HUD and payment is received from HUD typically within 75 days of repurchase. Nonperforming repurchased loans are generally liquidated through foreclosure, subsequent sale of the real estate owned, and claim submissions to HUD.

Loans are considered nonperforming upon events such as, but not limited to, the death of the mortgagor, the mortgagor no longer occupying the property as their principal residence, or the property taxes or insurance not being paid. In addition to having to fund these repurchases, the Company also typically earns a lower interest rate and incurs certain non-reimbursable costs during the process of liquidating nonperforming loans. Loans purchased out of GNMA HMBS are recorded in the Consolidated Statements of Financial Condition at their fair value reflective of proceeds of liquidation of collateral or ultimate disposition of the loan.

Reverse mortgage loans also include claims receivable that have been submitted to HUD awaiting reimbursement. These amounts are recorded net of amounts the Company does not expect to recover through outstanding claims.

Certain HECM and jumbo reverse mortgage loans originated or acquired by the Company include broker compensation or correspondent fees. These premiums are remitted to the mortgage broker or correspondent lender who acted as the intermediary for the reverse mortgage. Broker compensation and correspondent fees are recorded on a net basis in net fair value gains on mortgage loans and related obligations and therefore are not separately presented in the Consolidated Statements of Operations and Comprehensive Income.

Commercial Mortgage Loans

Commercial mortgage loans held for investment primarily consist of short-term loans for real estate investors and agricultural loans for farmers.

Mortgage Loans Held for Sale, at Fair Value

Mortgage loans held for sale represent mortgage loans originated by the Company and held until sold to secondary market investors. The Company primarily originates conventional GSEs, government insured (FHA), and government guaranteed (Department of Veteran Affairs) residential mortgage loans (collectively “residential mortgage loans held for sale”), commercial mortgage loans to owners and investors of single and multi-family residential rental properties (“commercial loans held for sale”), and certain HECMs purchased out of GNMA HMBS that the Company intends to sell to third parties (collectively, “reverse mortgage loans held for sale”).

The Company elected the fair value option provided for by ASC 825-10, Financial Instruments-Overall. Mortgage loans held for sale are measured at fair value at the time of origination and on a recurring basis thereafter. Gains and losses on mortgage loans held for sale are recorded in gain on sale of mortgage loans, net, and other income related to the origination of mortgage loans held for sale, net, in the Consolidated Statements of Operations and Comprehensive Income. The yield recognized includes the contractual interest income that is expected to be collected based on the stated interest rates of the loans.


F-19


Table of Contents

Finance of America Equity Capital LLC and Subsidiaries

Notes to Consolidated Financial Statements


In connection with the Company’s election to measure originated mortgage loans held for sale at fair value, any fees recognized in relation to originated mortgage loans are recognized as they are received and are included in fee income in the Consolidated Statements of Operations and Comprehensive Income. Direct loan origination costs and fees are expensed when incurred and are included in general and administrative expenses in the Consolidated Statements of Operations and Comprehensive Income.

Residential Mortgage Loans Held for Sale

Residential mortgage loans held for sale are typically warehoused for a period after origination or purchase before sale into the secondary market. Servicing rights are either released upon sale of mortgage loans in the secondary market or retained by the Company. The yield on residential mortgage loans held for sale is recorded in interest income and changes in fair value are recorded in gain on sale and other income from mortgage loans held for sale, net, in the Consolidated Statements of Operations and Comprehensive Income.

Commercial Loans Held for Sale

The Company estimates fair value by evaluating a variety of market indicators, including recent sales of similar product types and outstanding commitments, calculated on an aggregate basis. The yield recognized on commercial loans held for sale and changes in estimated fair value are recorded in net fair value gains on mortgage loans and related obligations in the Consolidated Statements of Operations and Comprehensive Income. In connection with the Company’s election to measure loans held for sale at fair value, the Company is not permitted to defer the loan origination fees, net of direct loan origination costs associated with these loans.

Reverse Mortgage Loans Held for Sale

The Company has determined that the transfer of HECM loans to third party investors after repurchased from HMBS pools qualify as sales as the Company no longer retains effective control over the transferred loans. The yield recognized on reverse loans held for sale and changes in estimated fair value are recorded in net fair value gains on mortgage loans and related obligations in the Consolidated Statements of Operations and Comprehensive Income.

Reverse mortgage loans held for sale also includes claims receivable that have been submitted to HUD awaiting reimbursement. These amounts are recorded net of amounts the Company does not expect to recover through outstanding claims and included in gain on sale and other income from mortgage loans held for sale, net, in the Consolidated Statements of Operations and Comprehensive Income.

Mortgage Servicing Rights, at Fair Value

Mortgage servicing rights (“MSRs”) represent contractual rights to perform specific administrative functions for the underlying loans including specified mortgage servicing activities, which consist of collecting loan payments, remitting principal and interest payments to investors, managing escrow funds for the payment of mortgage-related expenses such as taxes and insurance, and otherwise administrating the mortgage loan servicing portfolio. MSRs are created through the sale of an originated mortgage loan or purchased from third parties. The unpaid principal balance (UPB) of the loans underlying the MSRs is not included on the Consolidated Statements of Financial Condition. For servicing retained in connection with the securitization of reverse mortgage loans accounted for as secured financings, an MSR is not recognized.


F-20


Table of Contents

Finance of America Equity Capital LLC and Subsidiaries

Notes to Consolidated Financial Statements


The Company follows the fair value measurement method to record the value of MSRs in accordance with ASC 860, Transfers and Servicing. Under this method, servicing assets are measured at fair value on a recurring basis with changes in fair value recorded through earnings in the period of the change as a component of fee income in the Consolidated Statements of Operations and Comprehensive Income.

The fair value of the MSRs is based upon the present value of the expected future net cash flows related to servicing these loans. For MSRs that the Company has current commitments to sell to third parties, the fair value is based on the outstanding commitment price. The Company receives a base servicing fee based on the remaining outstanding principal balances of the loans, which are collected from borrowers on a monthly basis. The Company determines the fair value of the MSRs by the use of a discounted cash flow model that incorporates prepayment speeds, delinquencies, discount rate, ancillary revenues and other assumptions (including costs to service) that management believes are consistent with the assumptions other similar market participants use in valuing the MSRs.

The primary risk associated with MSRs is the potential reduction in fair value as a result of higher than anticipated prepayments due to loan refinancing prompted, in part, by declining interest rates or government intervention. Conversely, these assets generally increase in value in a rising interest rate environment to the extent that prepayments are slower than anticipated. At times, the Company may utilize derivatives as economic hedges to offset changes in the fair value of the MSRs resulting from the actual or anticipated changes in prepayments stemming from changing interest rate environments. There is also a risk of valuation decline due to higher than expected increases in default rates, which the Company does not believe can be effectively managed using derivatives.

Debt Securities

Debt securities consists of U.S. government securities, securities backed by collateral pools of proprietary jumbo reverse mortgages that are not insured by the FHA, and other debt securities. The Company accounts for debt securities in accordance with ASC 320, Investments-Debt and Equity Securities (“ASC 320”). The Company determines the classification of securities at purchase. The Company classifies debt securities into held-to-maturity, trading, or available-for-sale categories. Debt securities that management has the ability and intent to hold to maturity as classified as held-to-maturity and carried at cost, adjusted for amortization of premiums and accretion of discounts using the interest method.

The Company has elected to account for certain debt securities at fair value under the fair value option provisions included in ASC 825, Financial Instruments. The election is made on an instrument-by-instrument basis and is irrevocable. Changes in fair value of these securities are included as a component of net fair value gains on mortgage loans and related obligations.

Derivatives and Hedging Activities

The Company’s principal market exposure is to interest rate risk, specifically long-term U.S. Treasury and mortgage interest rates due to their impact on the fair value of mortgage loans and related commitments.

The Company uses derivative instruments as part of its overall strategy to manage its exposure to market and price risks primarily associated with fluctuations in interest rates. As a matter of policy, the Company does not use derivatives for speculative purposes.

Interest Rate Lock Commitments

Interest rate lock commitments (“IRLCs”) represent an agreement to extend credit to a mortgage loan applicant, whereby the interest rate on the loan is set prior to funding. The IRLC binds the Company (subject to the loan


F-21


Table of Contents

Finance of America Equity Capital LLC and Subsidiaries

Notes to Consolidated Financial Statements


approval process) to lend funds to a potential borrower at the specified rate, regardless of whether interest rates have changed between the commitment date and the loan funding date. As such, outstanding IRLCs are subject to interest rate risk and related price risk during the period from the date of issuance through the date of loan funding, cancellation or expiration. The Company uses mandatory and best efforts commitments to substantially mitigate these risks. Loan commitments generally range between 30 and 90 days; however, the borrower is not obligated to obtain the loan. The Company is subject to fallout risk related to IRLCs, which is realized if approved borrowers choose not to close on the loans within the terms of the IRLCs. Historical commitment-to-closing ratios are considered to estimate the quantity of mortgage loans that will fund within the terms of the IRLCs.

IRLCs that relate to the origination of a mortgage that will be held for sale upon funding are considered derivative instruments under the derivatives and hedging accounting guidance ASC 815, Derivatives and Hedging (“ASC 815”). Loan commitments that are derivatives are recognized at fair value in the Company’s Consolidated Statements of Financial Condition in derivative assets or payables and other liabilities, with changes in their fair values recorded in net fair value gains on mortgage loans and related obligations, in the Consolidated Statements of Operations and Comprehensive Income.

The fair value of the Company’s IRLCs is based upon the estimated fair value of the underlying mortgage loan, adjusted for (i) estimated costs to complete and originate the loan and (ii) the estimated percentage of IRLCs that will result in a closed mortgage loan. The valuation of the Company’s IRLCs are based on prices of mortgage backed securities (“MBS”) in the market place and the value of the related mortgage servicing.

Forward Loan Sale Commitments

The Company is subject to interest rate and price risk on its mortgage loans held for sale and IRLCs from the date the IRLC is made until the date the loan is sold. Mandatory commitments which fix the forward sales price that will be realized in the secondary market are used to substantially mitigate the interest rate and price risk to the Company.

The Company carefully evaluates all loan sale agreements to determine whether they meet the definition of a derivative under the derivatives and hedging accounting guidance under ASC 815. To mitigate the price risk the Company is exposed to on its outstanding loan commitments, the Company uses “mandatory delivery” forward loan sale commitments to manage the risk of potential interest rate movements and their impact on the value of the underlying mortgage loans. Mandatory delivery contracts that meet the definition of a derivative are accounted for as derivative instruments. Accordingly, forward loan sale commitments are recognized at fair value on the Consolidated Statements of Financial Condition in derivative assets or payables and other liabilities with changes in their fair values recorded in gain on sale and other income from mortgage loans held for sale, net, and net fair value gains on mortgage loans and related obligations in the Consolidated Statements of Operations and Comprehensive Income. The fair value is determined on a recurring basis based on forward prices with dealers in such securities or internally-developed or third-party models utilizing observable market inputs.

To Be Announced Securities

To Be Announced Securities (“TBAs”) are “forward delivery” securities considered derivative instruments under derivatives and hedging accounting guidance ASC 815. The Company uses TBAs to protect against the price risk inherent in derivative loan commitments. TBAs are valued based on forward dealer marks from the Company’s approved counterparties. The Company utilizes internal and third-party market pricing services which compile current prices for instruments from market sources, and those prices represent the current executable price. TBAs


F-22


Table of Contents

Finance of America Equity Capital LLC and Subsidiaries

Notes to Consolidated Financial Statements


are recorded at fair value in the Consolidated Statements of Financial Condition in derivative assets and payables and other liabilities, with changes in fair value recorded in gain on sale and other income from mortgage loans held for sale, net, in the Consolidated Statements of Operations and Comprehensive Income.

Best Efforts Commitments

The Company uses best efforts commitments with various investors to mitigate the risk associated with mortgage loans held for sale and interest rate lock commitments. The Company is exposed to counterparty risk with its best efforts commitments in the event that the counterparty cannot take delivery of the underlying mortgage loan. Best Efforts Commitments are recorded at fair value in the Consolidated Statements of Financial Condition in derivative assets and payables and other liabilities, with changes in fair value recorded in gain on sale and other income from mortgage loans held for sale, net, in the Consolidated Statements of Operations and Comprehensive Income.

Forward MBS Commitments

Periodically, the Company uses forward MBS commitments to hedge changes in the value of MSRs. MSRs are subject to substantial interest rate risk as the mortgage loans underlying the servicing rights permit the borrowers to prepay the loans. The Company may at times enter into economic hedges, which do not qualify as hedges for accounting purposes, including forward contracts to minimize the effects of loss in value of these MSRs associated with increased prepayment activity that generally results from declining interest rates. Forward commitments are recorded at fair value in the Consolidated Statements of Financial Condition in derivative assets and payables and other liabilities, with changes in fair value recorded in gain on sale and other income from mortgage loans held for sale, net, in the Consolidated Statements of Operations and Comprehensive Income.

The Company treats forward HMBS purchase and sale commitments that have not settled as derivate instruments. Any changes in fair value are recorded in net fair value gains on mortgage loans and related obligations in the Consolidated Statements of Operations and Comprehensive Income. The fair value is determined on a recurring basis based on forward prices with dealers in such securities or internally-developed or third-party models utilizing observable market inputs. These forward commitments will be fulfilled with loans not yet securitized and new reverse mortgage loan originations and purchases.

Interest Rate Swaps and Futures Contracts

The Company also enters into interest rate swaps and futures contracts to offset changes in the value of its unsecuritized non-agency reverse mortgage loans, commercial loans and mortgage servicing rights. The Company has not designated its interest rate swaps and futures contracts as hedges for accounting purposes. These interest rate swaps and futures contracts are accounted for as derivatives and recorded at fair value as derivative assets or as a component of payables and other liabilities in the Consolidated Statements of Financial Condition. Realized and unrealized changes in fair value of interest rate swaps and futures contracts are recorded in net fair value gains on mortgage loans and related obligations in the Consolidated Statements of Operations and Comprehensive Income. Certain of the trade counterparties contain margin call provisions that, upon notice from the counterparty require us to transfer cash to eliminate any margin deficit. A margin deficit will generally result from any decline in market value of the assets subject to the related hedging transaction. Margin deposits are presented in other assets, net in the Consolidated Statement of Financial Condition. See Note 12 - Derivatives and Risk Management Activities for further discussion of derivative assets and liabilities. The Company does not account for margin deposits as an offset against the reported derivative assets or liabilities.


F-23


Table of Contents

Finance of America Equity Capital LLC and Subsidiaries

Notes to Consolidated Financial Statements


Fixed Assets and Leasehold Improvements, Net

Fixed assets are depreciated on a straight-line basis over their estimated useful lives. Leasehold improvements are amortized on a straight-line basis over the shorter of the term of the related office lease or the expected useful life of the assets. The Company capitalizes certain costs associated with the acquisition of internal-use software and amortizes the software over its estimated useful life, commencing at the time the software is placed in service. The Company reviews fixed assets and leasehold improvements for impairment whenever events or changes in circumstances indicate that the related carrying amounts may not be recoverable.

The Company evaluates all leases at inception to determine if they meet the criteria for a finance lease. A capital lease is recorded as an acquisition of property or equipment at an amount equal to the present value of minimum lease payments at the date of inception. Assets acquired under a capital lease are depreciated on a straight-line basis in accordance with the Company’s normal depreciation policy over the lease term and are included in fixed assets and leasehold improvements, net, in the Consolidated Statements of Financial Condition. A corresponding liability is recorded representing an obligation to make lease payments which is included in payables and other liabilities in the Consolidated Statements of Financial Condition. Lease payments are allocated between interest expense and reduction of obligation.

Goodwill

Goodwill is the excess of the purchase price over the fair value of the net assets acquired. Goodwill is not amortized, but is reviewed for impairment annually as of October 1 and monitored for interim triggering events on an ongoing basis. If certain events occur, which indicate goodwill might be impaired between annual tests, goodwill must be tested when such events occur. In making this assessment, the Company considers a number of factors including operating results, business plans, economic projections, anticipated future cash flows, etc. There are inherent uncertainties related to these factors and management’s judgment in applying them to the analysis of goodwill impairment. Changes in economic and operating conditions could result in goodwill impairment in future periods. In testing goodwill for impairment, the Company follows ASC 350, Intangibles-Goodwill and Other (“ASC 350”), which permits a qualitative assessment of whether it is more likely than not that the fair value of a reporting unit is less than its carrying value including goodwill. If the qualitative assessment determines that it is more likely than not that the fair value of the reporting unit is less than its carrying value including goodwill, the Company will compare the fair value of that reporting unit with its carrying value, including goodwill. If the carrying value of a reporting unit exceeds its fair value, goodwill is considered impaired with the impairment loss equal to the amount by which the carrying value of the goodwill exceeds the implied fair value of that goodwill.

Intangible Assets, Net

Intangible assets, net primarily consist of customer list, domain name and broker relationships acquired through various acquisitions. Intangible assets are amortized on a straight line basis over their estimated useful lives. Amortization expense of intangibles is included in general and administrative expenses on the Consolidated Statements of Operations and Comprehensive Income. The Company reviews intangible assets for impairment whenever events or changes in circumstances indicate that the related carrying amounts may not be recoverable. No impairment was recorded on intangible assets for the years ended December 31, 2020, 2019 and 2018.

Other Assets, Net

Other assets, net, consist of receivables, net of allowance, government guaranteed receivables, net, ROU assets, loans subject to repurchase from GNMA, other, investments, at fair value, prepaid expenses, deposits, servicer


F-24


Table of Contents

Finance of America Equity Capital LLC and Subsidiaries

Notes to Consolidated Financial Statements


advances, net of allowance, and receivable from clearing organization. The components of other assets, net, are detailed in Note 16 - Other Assets, Net.

Receivables, Net of Allowance

Receivables, net of allowance are represented by amounts due from investors and other parties and are stated at the amounts management expects to collect. If the Company expects to collect less than 100% of the recorded receivable balances, an allowance for doubtful accounts is recorded based on the expected credit loss (“CECL”) methodology which includes a combination of historical experience, aging analysis, information on specific balances and reasonable and supportable forecasts.

Government Guaranteed Receivables, Net

The Company accounts for foreclosed mortgage loans guaranteed by the government as a separate receivable. These amounts are carried at the net amounts the Company expects to receive from the liquidation of the underlying property and any expected claim proceeds from HUD for shortfall on liquidation proceeds in other assets, net, in the Consolidated Statements of Financial Condition.

Outstanding HUD claims associated with HECM loans that are collateral for issued and outstanding HMBS may be retained inside the HMBS while the associated HECM loan remains insured by HUD or a HUD claim is outstanding and the HECM loan has not yet reached 98% of the loan’s MCA. Subsequent to reaching 98% of the MCA, the Company must purchase the loan out of the HMBS.

Loans Subject to Repurchase from GNMA

For certain loans that the Company has pooled and securitized with GNMA, the Company as the issuer has the unilateral right to repurchase, with GNMA’s prior authorization, any individual loan in a GNMA securitization pool if that loan meets certain criteria, including being delinquent greater than 90 days. Once the Company has the unilateral right to repurchase a delinquent loan, the Company has effectively regained control over the loan and under GAAP, must re-recognize the loan in its Consolidated Statements of Financial Conditions and establish a corresponding liability regardless of the Company’s intention to repurchase the loan.

Investments, at Fair Value

The Company invests in the equity of other companies in the form of common stock, preferred stock or other in- substance equity interests or an investment in a limited liability company. The Company evaluates its outstanding equity investments in other companies to determine whether the Company is able to demonstrate a controlling financial interest or significant influence. For investments for which the Company is able to exercise significant influence, the Company applies the equity method of accounting. If the investment does not meet the criteria for the use of the equity method of accounting, the investment is accounted for at cost unless an election is made to account for it at fair value. For investments in which the Company is unable to exercise significant influence, the Company does not account for these equity investments under ASC 323, Investments - Equity Method and Joint Ventures.

The Company has elected to account for certain of its investments at fair value under the fair value option provisions included in FASB ASC 825, Financial Instruments. This standard provides companies the option of reporting certain instruments at fair value (with changes in fair value recognized in the statement of operations) that were previously either carried at cost, not recognized on the financial statements, or carried at fair value with


F-25


Table of Contents

Finance of America Equity Capital LLC and Subsidiaries

Notes to Consolidated Financial Statements


changes in fair value recognized as a component of equity rather than in the statement of operations. The election is made on an instrument-by-instrument basis and is irrevocable. See Note 5 - Fair Value for the information regarding the effects of applying the fair value option to the Company’s financial instruments in the consolidated financial statements.

Equity securities with a readily determinable fair value are required to be measured at fair value, with changes in fair value recognized through net income. Equity securities without readily determinable fair value are carried at cost, less any impairment plus or minus changes resulting from observable price changes for identical or similar investments.

Servicer Advances, Net of Allowance

The Company is required under certain servicing contracts to ensure that property taxes, insurance premiums, foreclosure costs and various other items are paid in order to preserve the assets being serviced. Generally, the Company recovers such advances from borrowers for reinstated or performing loans, from proceeds of liquidation of collateral or ultimate disposition of the loan, from credit owners or from loan insurers.

Receivable from Clearing Organization

The Company clears all of its proprietary and all of its customer transactions through another broker-dealer on a fully disclosed basis. Securities transactions are recorded on the trade date as if they had settled. The related amounts receivable and payable for unsettled securities transactions along with contractual deposits, are recorded in receivable from or payable to clearing organization in the Consolidated Statements of Financial Condition.

Operating Leases

The Company records the operating lease expense on a straight-line basis over the lease term by adding interest expense determined using the effective interest method to the amortization of the right-of-use (“ROU”) assets. Amortization of the ROU assets is calculated as the difference between the straight-line expense and the interest expense on the lease liability for a given period. See Note 21 - Leases for further discussion of operating leases.

HMBS Related Obligations, at Fair Value

HMBS related obligations represent the secured borrowing associated with the Company’s securitization of HECM loans where the securitization does not meet the criteria for sale accounting treatment. This liability includes the Company’s obligation to repay the secured borrowing from the FHA insured HECM cash flows and the obligations as issuer and servicer of the HECM loans and HMBS.

As an issuer of HMBS, the Company is obligated to service the HECM loan and associated HMBS, which includes funding the repurchase of the HECM loans or pass through of cash due to the holder of the beneficial interests in the GNMA HMBS upon maturity events and certain funding obligations related to monthly guarantee fees, mortgage insurance proceeds and partial month interest.

As an issuer, the Company is required to repurchase reverse loans out of the GNMA securitization pools once the outstanding principal balance of the related HECM is equal to or greater than 98% of the MCA. The Company is also required to pay off the outstanding remaining principal balance of secured borrowings if certain triggering events are reached prior to the 98% of MCA limit, such as death of borrower and completion of foreclosure. Performing repurchased loans are conveyed to HUD and payment is received from HUD typically within 75 days


F-26


Table of Contents

Finance of America Equity Capital LLC and Subsidiaries

Notes to Consolidated Financial Statements


of repurchase. Nonperforming repurchased loans are generally liquidated through foreclosure, subsequent sale of real estate owned and claim submissions to HUD. Loans are considered nonperforming upon events such as, but not limited to, the death of the mortgagor, the mortgagor no longer occupying the property as their principal residence, or the property taxes or insurance not being paid. The Company relies upon its secured financing facilities (see Note 19 - Other Financing Lines of Credit) and operating cash flows, to the extent necessary, to repurchase loans. The timing and amount of the Company’s obligation to repurchase HECMs is uncertain as repurchase is predicated on certain factors such as whether or not a borrower event of default occurs prior to the HECM reaching the mandatory repurchase threshold under which the Company is obligated to repurchase the loan.

Performing repurchased loans are conveyed to HUD and nonperforming repurchased loans are generally liquidated in accordance with program requirements. In addition to having to fund repurchases, the Company may sustain losses during the process of liquidating the loans. The issuer is also required to fund guarantee fees to GNMA, MIP to the FHA and is obligated to fund partial month interest resulting from shortfalls in interest received from borrower payoffs to the holders of the HMBS beneficial interests. Estimated cash flows associated with these obligations are included in the HMBS related obligations, at fair value in the Consolidated Statements of Financial Condition.

The Company has elected to record the HMBS related obligations at fair value. The estimated fair value is generally determined by discounting expected principal, interest and other servicing or issuer obligation cash flows using an estimated market discount rate that management believes a market participant would consider in determining fair value.

See Note 5 - Fair Value for further discussion of valuation of HMBS related obligations.

The yield on HMBS related obligations along with any changes in fair value are recorded in net fair value gains on mortgage loans and related obligations in the Consolidated Statements of Operations and Comprehensive Income. The yield on the HMBS related obligations includes recognitions of contractual interest expense based on the stated interest rates of the HMBS beneficial interests.

Nonrecourse Debt, at Fair Value

Nonrecourse debt is debt of securitization trusts that are VIEs that have been consolidated, as the Company is the primary beneficiary. The loans initially transferred to the securitization trust serve as collateral for the nonrecourse debt, and the principal and interest cash flows from these loans serve as the sole source of repayment.

The Company has elected to measure the outstanding nonrecourse debt at fair value in the Consolidated Statements of Financial Condition with all changes in fair value recorded to net fair value gains on mortgage loans and related obligations in the Consolidated Statements of Operations and Comprehensive Income. The yield on nonrecourse debt and any change in fair value are also recorded in net fair value gains on mortgage loans and related obligations in the Consolidated Statements of Operations and Comprehensive Income. The yield recognized includes the contractual interest expense based on the stated interest rates of the debt and amortization of any discount at which the related bonds were issued.

Reverse Mortgage Loans

The Company securitizes certain of its interests in HECM Buyouts and non-agency reverse mortgage loans. The transactions provide investors with the ability to invest in a pool of reverse mortgage loans secured by


F-27


Table of Contents

Finance of America Equity Capital LLC and Subsidiaries

Notes to Consolidated Financial Statements


one-to-four-family residential properties. The transactions provide the Company with access to liquidity for these assets, ongoing servicing fees, and potential residual returns. The securitizations are callable at or following the optional redemption date as defined in the respective indenture agreements.

Commercial Mortgage Loans

The Company issued nonrecourse debt securities secured by mortgage loans made to real estate investors. The transactions provide debt security holders the ability to invest in a pool of performing loans secured by investment real estate. The transactions provide the Company with access to liquidity for the mortgage loans and ongoing management fees.

Nonrecourse MSR Financing Liability, at Fair Value

The Company has agreements with third parties to sell beneficial interests in the servicing fees generated from its originated or acquired mortgage servicing rights. Under these agreements, the Company has agreed to sell to the third parties the right to receive all excess servicing and ancillary fees related to the identified MSRs in exchange for an upfront payment equal to the entire purchase price of the acquired or originated mortgage servicing rights. These transactions are accounted for as financings under ASC 470, Debt and included in payables and other liabilities in the Consolidated Statements of Financial Condition.

The Company elected to measure the outstanding financings related to the nonrecourse MSR financing liability, at fair value, as permitted under ASC 825, Financial Instruments, with all changes in fair value recorded as a charge or credit to fee income in the Consolidated Statements of Operations and Comprehensive Income. The fair value on the nonrecourse MSR financing liability is based on the present value of the future expected discounted cash flows paid to the third parties with the discount rate approximating current market value for similar financial instruments. See Note 37 - Related Parties for additional information regarding the nonrecourse MSR financing liability.

Other Financing Lines of Credit

Other financing lines of credit principally consists of variable-rate, asset-backed facilities, primarily warehouse lines of credit, to support the origination of mortgage loans and operations of the Company, which provide creditors a collateralized interest in specific mortgage loans and other Company assets that meet the eligibility requirements under the terms of the facility. The source of repayment of the facilities is typically from the sale or securitization of the underlying loans into the secondary mortgage market. The Company evaluates its capacity needs for warehouse facilities and adjusts the amount of available capacity under these facilities in response to the current mortgage environment and origination needs. Interest expense from these financings is recorded in net interest expense in the Consolidated Statements of Operations and Comprehensive Income.

Costs incurred in connection with obtaining financing lines of credit are capitalized to other assets, net, within the Consolidated Statements of Financial Position and amortized over the term of the related financing as interest expense within the Consolidated Statements of Operations and Comprehensive Income.

Payables and Other Liabilities

Payables and other liabilities consist of accrued compensation expense, accrued liabilities, lease liabilities, liability for loans eligible for repurchase from GNMA, GNMA reverse mortgage buy-out payable, derivative liabilities, nonrecourse MSR financing liability, at fair value, repurchase reserves, estimate of claim losses, deferred purchase price liabilities, at fair value, finance lease obligations, and due to investors. The components of payables and other liabilities are detailed in Note 20 - Payables and Other Liabilities.


F-28


Table of Contents

Finance of America Equity Capital LLC and Subsidiaries

Notes to Consolidated Financial Statements


IBNR and Estimate of Claim Losses

The Company offers medical, dental, and other benefits to its employees. In 2016, certain of these medical benefit plans became self-funded by the Company, whereby the Company pays actual claims made by its employees. Any employee-paid portion of these benefits are withheld by the individual operating entities and remitted back to the Company on a monthly basis. In addition, the Company has a stop-loss insurance policy in place which reimburses the company for extraordinary claims. The Company estimates incurred but not reported obligations, including any existing and future claims (“IBNR”), related to these self-funded benefits on a quarterly basis. The estimated claims are recorded based upon current and future claims expected to be received. In addition, the Company has engaged a third party actuary to validate the reasonableness of the existing estimated claims.

The Company is occasionally named as a defendant in claims concerning alleged errors or omissions pertaining to the issuance of title policies or the performance of escrow services. The Company assesses pending and threatened claims to determine whether losses are probable and reasonably estimable in accordance with ASC 450, Contingencies. To the extent losses are deemed probable and reasonably estimable, the Company will establish an accrual for those losses based on historical experience and analysis of specific claim attributes.

The Company maintains an estimate of claim losses for potential losses related to title research and the related title policies sold by the Company as agent. This reserve is subjective and is based on known claims and claims incurred but not yet reported to the Company. The Company monitors the estimate of claim losses for adequacy on an annual basis.

This liability also includes amounts determined on the basis of claim evaluation, estimates for reported losses and estimates for losses incurred but not reported related to the Company’s title and settlement services subsidiary. These estimates are continually reviewed and updated. Any adjustments are reflected currently. Accordingly, loss and loss adjustment expenses are charged to income as incurred. Management believes the liability for loss and loss adjustment expenses is adequate; however, the ultimate liability may be in excess of or less than the amounts provided.

Repurchase Reserve

The Company has exposure to potential mortgage loan repurchases and indemnifications in its capacity as a seller of mortgage loans. The estimation of the liability for probable loss related to repurchase and indemnification obligations considers: (i) specific, non-performing loans where the Company has received a repurchase or indemnification request and believes it will be required to repurchase the loan or indemnify the investor for any losses; and (ii) an estimate of probable future repurchase or indemnification obligations for standard representation and warranty provisions, early payment defaults or other recourse obligations. The Company establishes an initial reserve at fair value for expected losses relating to loan sales at the date the loans are de-recognized from the Consolidated Statements of Financial Condition, which is recorded as a component of gain on sale and other income from mortgage loans held for sale, net in the Consolidated Statements of Operations and Comprehensive Income.

Deferred Purchase Price Liabilities, at fair value

As a result of business acquisitions, the Company has recorded contingent liabilities based upon expected future payouts. These payouts are partially based on future loan production and profits of the Company. In accordance with ASC 805, the Company measures any contingent consideration related to business combinations at fair value, and adjusts the reported amount each period with the change in fair value recorded in general and administrative expenses in the Consolidated Statements of Operations and Comprehensive Income.


F-29


Table of Contents

Finance of America Equity Capital LLC and Subsidiaries

Notes to Consolidated Financial Statements


Notes Payable

The Company accounts for outstanding notes payable in accordance with ASC 470 - Debt. Notes payable are carried at amortized cost. Issuance costs, premiums and discounts are capitalized as part of the notes payable balance and amortized to interest expense on the Consolidated Statements of Operations and Comprehensive Income over the outstanding life of the note using the effective interest method.

Offsetting of Amounts Related to Certain Contracts

When the requirements of FASB ASC 815-10-45-5, Derivatives and Hedging, are met, the Company offsets certain fair value amounts recognized for cash collateral receivables or payables against fair value amounts recognized for net derivative positions executed with the same counterparty under the same master netting arrangement.

Reinsurance

The Company assumes and cedes reinsurance with other insurance companies in the normal course of business. Ceded insurance is comprised of excess of loss treaties, which protect against losses over defined amounts. The Company remains liable to the insured for claims under ceded insurance policies in the event the assuming insurance companies are unable to meet their obligations under these contracts. Reinsurance is recorded as a contra revenue within fee income on the Consolidated Statements of Operations and Comprehensive Income.

Comprehensive Income

Recognized revenue, expenses, gains and losses are included in operations. Certain changes in assets and liabilities, such as foreign currency translation adjustments, are reported as a separate component in the Consolidated Statements of Changes in Members’ Equity. Such items, along with net income and losses, are components of comprehensive income (loss).

The components of other comprehensive income (loss) are reported in the Consolidated Statements of Operations and Comprehensive Income. For the years ended December 31, 2020, 2019 and 2018, the only component of other comprehensive income (loss) was foreign currency translation adjustments, arising from translation of the foreign branch accounts in Manila, Philippines.

Foreign Currency

The functional currency of the Company’s international branch is the Philippine peso. Foreign currency denominated assets and liabilities are translated into United States dollars using the exchange rates in effect at the dates of the Consolidated Statements of Financial Condition. Results of operations and cash flows are translated using the average exchange rates throughout the period. The resulting exchange rate translation adjustments are included as a component of members’ equity in accumulated other comprehensive income (loss).

Revenue Recognition

The Company derives its revenues principally from gains on origination and sale of loans, including revenue fees collected from the borrower at closing, loan servicing fees, fair value gains on originated mortgage loans, net of changes in fair value associated with outstanding HMBS and other nonrecourse obligations, other fee income, and net interest income on loans.


F-30


Table of Contents

Finance of America Equity Capital LLC and Subsidiaries

Notes to Consolidated Financial Statements


Net gains on mortgage loans held for sale include realized and unrealized gains and losses on loans held for sale, interest rate lock commitments, hedging derivatives and retained mortgage servicing rights. The Company sells mortgage loans into the secondary market, including sales to the GSEs on a servicing-released basis, where the loans are sold to an investor with the associated mortgage servicing rights transferred to the investor or to a separate third-party investor. In addition, the Company may opportunistically sell loans on a servicing-retained basis, where the loan is sold and the rights to service that loan are retained. Unrealized gains and losses include fair value gains and losses resulting from changes in fair value in the underlying mortgages, interest rate lock commitments, hedging derivatives and retained mortgage servicing rights, from the time of origination to the ultimate sale of the loan or other settlement of those financial instruments.

Monthly servicing revenue represents income derived by the Company in relation to the servicing of loans. Interest income reflects interest collected at the closings of loans, as well as on loans held for sale by the Company prior to sale on the secondary market. The interest income collected on such loans is reported net of the interest expense incurred while the loans are carried on the Company’s warehouse lines.

Interest income is recognized using the interest method. Loans are placed on non-accrual status when any portion of the principal or interest is 90 days past due or earlier if factors indicate that the ultimate collectability of the principal or interest is not probable. Interest received from loans on non-accrual status is recorded as income when collected. Loans return to accrual status when the principal and interest become current and it is probable that the amounts are fully collectible.

Agents National Title Insurance Company (“ANTIC”), a subsidiary of the Company, issues title insurance products through a network of title insurance agents throughout the country. Title insurance is a product providing coverage to parties within a real estate transaction according to the respective state regulatory bodies in the United States of America. Insurance premium revenue is recognized from title insurance contracts when the title agents report the issuance of a title insurance policy. The revenue stream falls under ASU 2016-20, Issue 5: Scope of Topic 606 11, which is excluded from ASC 606, Revenue from Contracts with Customers (“ASC 606”). The scope exceptions to ASC 606 clarify that all contracts within the scope of Topic 944, Financial Services-Insurance, are excluded from the scope of Topic 606. Therefore ANTIC is considered under Insurance Contracts within the scope of ASC 944-605 which reflects premiums from title insurance contracts shall be considered due from policyholders and, accordingly, recognized as revenue on the effective date of the insurance contract because most of the services associated with the contract have been rendered by that time. However, the binder date is appropriate if the insurance entity is legally or contractually entitled to the premium on the binder date.

The majority of revenue generated by the Company in connection with originations and servicing are not within the scope of ASC 606.

The Company recognizes revenues from services provided in accordance with the five-step process outlined in ASC 606. Revenue was recognized when the performance obligations have been satisfied by transferring control of a product or service to a customer in an amount that reflects the consideration that the Company expects to receive. This revenue can be recognized at a point in time or over time. Based on its evaluation of loan origination fees, the Company has determined that loan origination fees are recorded in fee income in the Consolidated Statements of Operations and Comprehensive Income when a loan is successfully funded, with the related costs recognized in general and administrative expenses when incurred.


F-31


Table of Contents

Finance of America Equity Capital LLC and Subsidiaries

Notes to Consolidated Financial Statements


The primary components of fee income consist of the following:

Loan Servicing Fees

Loan servicing income represents recurring servicing and other ancillary fees earned for servicing mortgage loans owned by investors. Servicing fees received for servicing mortgage loans owned by investors are based on a stipulated percentage of the outstanding monthly principal balance on such loans, or the difference between the weighted-average yield received on the mortgage loans and the amount paid to the investor, less guaranty fees and interest on curtailments. Loan servicing income is receivable only out of interest collected from mortgagors and is recorded as income when collected. Late charges and other miscellaneous fees collected from mortgagors are also recorded as income when collected, and are included as a component of fee income in the Consolidated Statements of Operations and Comprehensive Income.

Loan Origination Fees

Loan origination fees are recorded in fee income in the Consolidated Statements of Operations and Comprehensive Income when earned, with the related costs recognized in general and administrative expenses when incurred at the date of origination.

The Company collects from the borrower certain amounts, including underwriting fees, credit reporting fees, loan administration and appraisal fees. The Company has determined that it is primarily responsible for fulfillment and acceptability for these services, and has discretion in setting the price to the borrower, and therefore these fees should be recognized gross as the Company is the principal for the specified goods and services performed.

In addition to the fees above, the Company also acts as agent for certain services for its customers. These services include obtaining flood certification, credit reporting, and inspection fees. In these transactions, the Company will facilitate the providing of the goods or services to prospective borrowers, and collects these amounts from the borrower prior to the services being provided. These amounts are recorded net in the Company’s consolidated financial statements.

Other Fee Income

Title and Closing Services: The Company generates revenue by providing title agent and closing services for lenders in connection with loan closings. Specific fees are specified within each lenders/financial institutions’ agreements. While the services are generally performed over a 90-day time frame leading up to and finalized before the date of loan closing, no fees are earned and recorded unless the loan closing occurs. Net fees are issued to the Company at the time of the respective loan closing. The specific good and/or service provided to the customer is the issuance of title insurance policy. The risk in the title issuance lies mostly with the title underwriter of the insurance policy and less on the Company, as the agent, thus the Company determined within step 5 of ASC 606 that the Company does not control the goods or service before it is transferred to the customer. The Company is recognizing net revenue at a point in time using the output method, specifically as services are completed in connection with the performance of said obligations. There are two performance obligations, the first is the search and examination of the title of a property, which is performed by the Company on behalf of the underwriter. The second will be the issuance of a title insurance policy, which is performed by an independent underwriter. The transaction price is allocated between the performance obligations based on the terms of the transaction agreement.


F-32


Table of Contents

Finance of America Equity Capital LLC and Subsidiaries

Notes to Consolidated Financial Statements


Settlement, Appraisal and Other Services: Settlement, appraisal and other services include specific real estate transaction services provided to customers to facilitate the origination of mortgage loans. Revenue is recognized when the performance obligations have been satisfied by transferring control of a product or service to a customer in an amount that reflects the consideration that the Company expects to receive. The Company recognizes gross revenue at a point in time using the output method, specifically as services are completed in connection with the performance of said obligations.

The Company earns appraisal revenue through the one performance obligation of managing the appraisal process for a consumer to obtain an independent valuation of a property to be mortgaged. The appraisal management company maintains a pool of qualified appraisers, who on behalf of the lender provide an appraisal report for a property. Gross revenue is earned and recognized at a point in time using the output method when each appraisal is performed and completed.

There are no variable consideration or significant judgments or estimates when revenue is recognized for this stream in accordance with ASC 606.

Transactional Revenue: The Company generates revenue through loan processing activities for in-school students and refinancing existing student loans. Transaction fees are considered revenue from contracts with customers. The Company receives transaction fees for the performance obligation of providing loan application processing and loan facilitation services for the issuing banks. The Company records revenue over time using the output method, specifically when certain milestones are reached in connection with the performance of said obligations.

Hedge Advisory Services: The Company provides certain valuation and advisory services, which includes the development and implementation of a mortgage servicing rights hedging framework, for various independent mortgage banks. Pursuant to these agreements or other governing documents, the Company’s maintenance fee (the “maintenance fee”) will generally vary between 0.05% and 0.25% of the assets under management per month. The maintenance fee is typically calculated and paid monthly and is recognized in the Consolidated Statements of Operations and Comprehensive Income in the month services are provided. In addition to the Company’s maintenance fee, the Company may also be entitled to receive incentive compensation (the “at-risk fee”) tied to the performance of the MSR portfolio, which will generally vary between 5% and 15% of net gains. The at-risk fee is typically calculated and paid monthly. The Company recognizes gross revenues over time utilizing the output method.

Other advisory fees: In addition to the management fee and incentive fee, the Company may also receive expense reimbursements from its clients in accordance with applicable advisory or sub-advisory agreements and other governing documents. These may include but are not limited to, reimbursement for expenses associated with legal entity formation and capital raising activities, initial public offering costs and expenses, fund administration costs, professional fees, securitization costs, custodian and transfer agent costs and certain other out-of-pocket expenses. To the extent such reimbursements are provided, the Company recognizes these amounts in revenues in the Consolidated Statements of Operations and Comprehensive Income. The Company recognizes gross revenues over time utilizing the output method.

MSR Trade Broker: The Company’s one performance obligation for these services is providing brokerage services to its clients. Services include analysis, structuring, marketing and negotiation of transactions for servicing portfolios in the secondary market. The Company earns revenue based on fees resulting from the trade of MSR assets. Trading of MSR assets is done in two ways: 1) co-issue, flow arrangement for the exit of a pipeline on a per loan basis, and 2) bulk, sale of an entire MSR portfolio. Fees on these brokered trades are based


F-33


Table of Contents

Finance of America Equity Capital LLC and Subsidiaries

Notes to Consolidated Financial Statements


upon a dollar per loan or basis points on unpaid principal balance (“UPB”) of underlying loans. Fees are defined in agreements with clients. Service is completed at the settlement date. The Company recognizes gross revenue at a point in time when the services are performed utilizing the output method.

OAS & MSR Valuation Services: The Company has one performance obligation for these services which is providing the analytic valuation services specified in the client-specific statement of work. Services are rendered when valuation results are complete and delivered to the client. The Company recognizes gross revenue at a point in time in which the services are performed using the output method.

Contract Balances

A contract asset balance occurs when an entity performs a service for a customer before the customer pays consideration (resulting in a contract receivable) or before payment is due (resulting in a contract asset). A contract liability balance is an entity’s obligation to transfer a service to a customer for which the entity has already received payment (or payment is due) from the customer. The Company’s non-interest revenue streams are largely based on transactional activity, or standard month-end revenue accruals. Consideration is often received immediately or shortly after the Company satisfies its performance obligation and revenue is recognized. The Company does not typically enter into long-term revenue contracts with customers, and therefore, does not experience significant contract balances. The Company did not have any significant contract balances at December 31, 2020 and 2019.

The Company has other revenue streams that are considered insignificant to the overall business. These services are negotiated with customers based on separate contracts for each of the respective services. These revenue streams are also recognized over time using the output method and contain only one performance obligation. There is no significant variable consideration or significant judgments or estimates when revenue is recognized for the Company’s revenue streams in accordance with ASC 606.

Revenue streams were reflected as $272.6 million, $48.3 million and $32.1 million point in time revenue, $69.6 million, $34.2 million and $28.8 million over time revenue, and $44.5 million, $119.1 million and $90.7 million non ASC 606 revenue recognition revenue for the years ended December 31, 2020, 2019 and 2018, respectively. See Note 30 - Fee Income for disclosures of fee income by type of revenue.

Transfers of Financial Assets

Transfers of financial assets are accounted for as sales when control over the assets has been surrendered. Control over transferred assets is deemed to be surrendered when (i) the assets have been isolated from the Company, put presumptively beyond the reach of the entity, even in bankruptcy, (ii) the transferee (or if the transferee is an entity whose sole purpose is to engage in securitization and that entity is constrained from pledging or exchanging the assets it receives, each third-party holder of its beneficial interests) has the right to pledge or exchange the transferred financial assets, and (iii) the Company or its agents does not maintain effective control over the transferred financial assets or third-party beneficial interest related to those transferred assets through an agreement to repurchase them before their maturity.

When the Company determines that control over the transfer of financial assets has been surrendered, the transaction will be accounted for as a sale in which the underlying mortgage loans are derecognized, and a corresponding gain recorded equal to the proceeds of the cash and any other beneficial interest retained by the Company, less the carrying balance of the transferred mortgage loans. Upon completion of the sale, the recorded gains and losses are reflected in gain on mortgage loans in the Consolidated Statements of Operations and Comprehensive Income.


F-34


Table of Contents

Finance of America Equity Capital LLC and Subsidiaries

Notes to Consolidated Financial Statements


Whenever the requirements for sale treatment have not been met due to control over the transferred financial assets not being surrendered, the transferred loans will continue to be held as mortgage loans held for investment, subject to nonrecourse debt, and an associated liability is recorded in nonrecourse debt on the Consolidated Statements of Financial Position.

Share Based Compensation

The Company has entered into transactions with certain of its executive officers whereby the executive officer purchased equity units in UFG Management Holdings LLC in exchange for a combination of cash and a partial-recourse promissory note. The Company accounts for compensation cost related to the grant of parent company awards to its employees with a corresponding credit to member’s equity in the Consolidated Statements of Financial Condition. These equity units are legally issued to the officers; however, because the promissory note is only partial-recourse, the Company accounts for the transaction as a grant of an option award, in accordance with FASB ASC 718, Compensation-Stock Compensation. The Company records a charge to salaries, benefits, and related expenses in the Consolidated Statements of Operations and Comprehensive Income on the transaction date for the value of the “option” as determined using an option pricing model. These “options” are considered vested upon the initial grant date, as no requisite service period is required of these officers. See Note 28 - Shareholders’ Notes Receivable for additional discussion.

Advertising Costs

Advertising costs are expensed as incurred. For the years ended December 31, 2020, 2019 and 2018, the Company recorded $37.5 million, $27.2 million and $30.1 million, respectively, in advertising and related expenses which are included in general and administrative expenses in the Consolidated Statements of Operations and Comprehensive Income.

Income Taxes

As a limited liability company, the Company has elected to report as a partnership for federal and state income tax purposes at a consolidated level. However, certain of the Company’s consolidated subsidiaries are structured as C-Corporations and subject the Company to income taxes at the subsidiary level. The Company is also subject to foreign taxes at its international branch, which are not material.

The Company records income taxes in accordance with ASC 740, Income Taxes (“ASC 740”). The Company accounts for income taxes under the asset and liability approach that requires recognition of accounts for certain income and expense items differently for financial reporting purposes and income tax purposes. Further, the Company recognizes deferred income tax assets and liabilities for the differences between the financial reporting basis and the tax basis of assets and liabilities, as well as expected benefits of utilizing net operating loss and credit carryforwards, when applicable.

Periodic reviews of the carrying amount of deferred tax assets are made to determine if the establishment of a valuation allowance is necessary. A valuation allowance is required when it is more likely than not that all or a portion of a deferred tax asset will not be realized. All evidence, both positive and negative, is evaluated when making this determination. Items considered in this analysis include the ability to carry back losses to recoup taxes previously paid, the reversal of temporary differences, tax planning strategies, historical financial performance, expectations of future earnings, and the length of statutory carryforward periods. Significant judgment is required in assessing future earnings trends and the timing of reversals of temporary differences.

ASC 740 establishes rules for recognizing and measuring tax positions taken in an income tax return, including disclosures of uncertain tax positions (“UTPs”).


F-35


Table of Contents

Finance of America Equity Capital LLC and Subsidiaries

Notes to Consolidated Financial Statements


The Company evaluates all material income tax positions for periods that remain open under applicable statutes of limitation, as well as positions expected to be taken in future returns. The Company recognizes an income tax benefit only if the position has a “more likely than not” chance of being sustained on its technical merits.

Contingencies

The Company evaluates contingencies based on information currently available and will establish accruals for those matters when a loss contingency is considered probable and the related amount is reasonably estimable. For matters where a loss is believed to be reasonably possible but not probable, no accrual is established but the nature of the loss contingency and an estimate of the reasonably possible range of loss in excess of amounts accrued, when such estimate can be made, is disclosed. In deriving an estimate, the Company is required to make assumptions about matters that are, by their nature, highly uncertain. The assessment of loss contingencies, including legal contingencies, involves the use of critical estimates, assumptions and judgments. Whenever practicable, the Company consults with outside experts, including legal counsel and consultants, to assist with the gathering and evaluation of information related to contingent liabilities. It is not possible to predict or determine the outcome of all loss contingencies. Accruals are periodically reviewed and may be adjusted as circumstances change. See Note 26 - Commitments and Contingencies for further discussion.

Reclassifications

Certain amounts from the prior year consolidated financial statements have been reclassified to conform to the current year financial presentation.


F-36


Table of Contents

Finance of America Equity Capital LLC and Subsidiaries

Notes to Consolidated Financial Statements


Recently Adopted Accounting Guidance


Standard    Description    Effective Date   

Effect on Consolidated

Financial Statements

ASU 2016-02, Leases (Topic 842), ASU 2018-10, Codification Improvements to Topic 842, Leases , ASU 2018-11, Leases (Topic 842), Targeted Improvements, (collectively, ‘Topic 842 Updates’), ASU 2018-20, Leases (Topic 842), Narrow Scope Improvements for Lessors, ASU 2019-01, Leases (Topic 842): Codification Improvements, ASU 2019-10, Leases (Topic 842): Effective Dates, ASU 2020-03, Codification Improvements to Financial Instruments, ASU 2020-05, (Topic 842), Effective Dates for Certain Entities   

This guidance and subsequent clarifications and improvements sets out the principles for the recognition, measurement, presentation and disclosure of leases for both parties to a contract (i.e. lessees and lessors) and supersedes previous leasing standards.


•   Requires lessees to recognize all leases longer than twelve months on the Consolidated balance sheets as a lease liability with a corresponding right-of-use (“ROU”) asset


•   Requires lessees and lessors to classify most leases using principles similar to existing lease accounting, but eliminates the “bright line” classification tests


•   Expands qualitative and quantitative leasing disclosures

   January 2019   

The Company early adopted the guidance in the first quarter of 2019, using the modified retrospective method of adoption without restating prior periods.


The Company elected the package of practical expedients, which, among other items, permits the Company not to reassess under the new standard its prior conclusions about lease identification, lease classification and initial direct costs. The Company also elected the short-term lease recognition exemption for all leases that qualify. Under this election, the Company does not recognize right-of-use assets or lease liabilities, which includes not recognizing ROU assets or lease liabilities for leases with a term of 12 months or less of those assets in transition. The Company also elected to not separate lease and non-lease components for all leases. The Company did not elect the use-of hindsight practical expedient.


Upon adoption, a lease liability was recorded of $74,126 and right of use asset of $74,126 on January 1, 2019, with no impact on its consolidated statement of operations. The ROU assets and operating lease liabilities are recorded in other assets,


F-37


Table of Contents

Finance of America Equity Capital LLC and Subsidiaries

Notes to Consolidated Financial Statements


Standard    Description    Effective Date   

Effect on Consolidated

Financial Statements


net, and payables and other liabilities, respectively, in the consolidated balance sheets.


See Note 21, for additional information.

ASU 2016-13 , Financial Instruments —Credit Losses (Topic 326): Measurement of Credit Losses on Financial Instruments, ASU 2019-04, Codification Improvements to Topic 326, Financial Instruments - Credit Losses, ASU 2019-05, Financial Instruments-Credit Losses (Topic 326): Targeted Transition Relief, ASU 2019-10, Financial Instruments —Credit Losses (Topic 326), ASU 2019-11, Codification Improvements to Topic 326, Financial Instruments - Credit Losses, ASU 2020-03, Codification Improvements to Financial Instruments


Issued June 2016


Requires use of the current expected credit loss model that is based on expected losses (net of expected recoveries), rather than incurred losses, to determine the allowance for credit losses on financial assets measured at amortized cost, certain net investments in leases and certain off-balance sheet arrangements.


Replaces current accounting for purchased credit impaired (“PCI”) and impaired loans.


Amends the other-than-temporary impairment model for available for sale debt securities. The new guidance requires that credit losses be recorded through an allowance approach, rather than through permanent write-downs for credit losses and subsequent accretion of positive changes through interest income over time.

   January 2020    The Company determined that certain servicer advances and other receivables, net of reserves including in other assets are with the scope of ASU 2016-13. The Company determined that these receivables have limited expected credit-related losses due to the contractual servicing agreements with agencies and loan product guarantees. Furthermore, the Company determined that for outstanding servicer and other advances, that the majority of estimated losses are attributable to losses due to servicing operational errors and credit-related losses are not significant because of the contractual relationship with the agencies. The adoption of ASU 2016-13 did not have a material impact on the Company’s consolidated financial statements.
ASU No. 2017-04, Intangibles - Goodwill and Other (Topic 350): Simplifying the Test for Goodwill Impairment    Historical guidance for goodwill impairment testing prescribed that the Company must compare each reporting unit’s carrying    January 2020    The Company adopted this guidance using the prospective method of adoption.


F-38


Table of Contents

Finance of America Equity Capital LLC and Subsidiaries

Notes to Consolidated Financial Statements


Standard    Description    Effective Date   

Effect on Consolidated

Financial Statements


value to its fair value. If the carrying value exceeds fair value, an entity performs the second step, which assigns the reporting unit’s fair value to its assets and liabilities, including unrecognized assets and liabilities, in the same manner as required in purchase accounting and then records an impairment. This ASU eliminates the second step.


Under the new guidance, an impairment of a reporting unit’s goodwill is determined based on the amount by which the reporting unit’s carrying value exceeds its fair value, limited to the amount of goodwill allocated to the reporting unit.

      Adoption of this standard did not have a material impact on the consolidated financial statements.
ASU 2018-13 , Fair Value Measurement (Topic 820): Disclosure Framework - Changes to the Disclosure Requirements for Fair Value Measurement   

The amendments in this Update modify the disclosure requirements on fair value measurements in Topic 820, Fair Value Measurements, based on the concepts in the Concepts Statement, including the consideration of costs and benefits. Certain disclosure requirements were either removed, modified, or added.


This guidance removes the requirement to disclose the amount of and reasons for transfers between Level 1 and Level 2 fair value measurement methodologies, the policy for timing of transfers

   January 2020    The adoption of this standard did not have a material impact on the consolidated financial statements.


F-39


Table of Contents

Finance of America Equity Capital LLC and Subsidiaries

Notes to Consolidated Financial Statements


Standard    Description    Effective Date   

Effect on Consolidated

Financial Statements


between levels and the valuation processes for Level 3 fair value measurements. It also adds a requirement to disclose changes in unrealized gains and losses for the period included in other comprehensive income for recurring Level 3 fair value measurements held at the end of the reporting period and the range and weighted average of significant unobservable inputs used to develop Level 3 measurements. For certain unobservable inputs, entities may disclose other quantitative information in lieu of the weighted average if the other quantitative information would be a more reasonable and rational method to reflect the distribution of unobservable inputs used to develop Level 3 fair value measurements.


ASU 2018-15 , Intangibles - Goodwill and Other - Internal- Use Software (Subtopic 350-40): Customer’s Accounting for Implementation Costs Incurred in a Cloud Computing Arrangement That Is a Service Contract    The amendments in this Update align the requirements for capitalizing implementation costs incurred in a hosting arrangement that is a service contract with the requirements for capitalizing implementation costs incurred to develop or obtain internal-use software (and hosting arrangements that include an internal-use software license).    January 2020   

The Company adopted this guidance using the prospective method of adoption.


Adoption of this standard did not have a material impact on the consolidated financial statements.


F-40


Table of Contents

Finance of America Equity Capital LLC and Subsidiaries

Notes to Consolidated Financial Statements


Recently Issued Accounting Guidance, Not Yet Adopted


Standard    Description    Date of Planned
Adoption
  

Effect on Consolidated

Financial Statements

ASU 2020-04, Reference Rate Reform (Topic 848): Facilitation of the Effects of Reference Rate Reform on Financial Reporting


ASU 2021-01, Reference Rate Reform (Topic 848): Codification Clarification


The amendments in this Update provide temporary optional expedients and exceptions for applying GAAP to contract modifications and hedging relationships, subject to meeting certain criteria, that reference London Inter-Bank Offered Rate (“LIBOR”) or other interbank offered rates expected to be discontinued.


In January 2021, FASB issued an Update which refines the scope of ASU Topic 848 and clarifies the guidance issued to facilitate the effects of reference rate reform on financial reporting. The amendment permits entities to elect certain optional expedients and exceptions when accounting for derivative contracts and certain hedging relationships affected by changes in the interest rates used for discounting cash flows, computing variation margin settlements and calculating price alignment interest in connection with reference rate reform activities.

   TBD   

This ASU is effective from March 12, 2020 through December 31, 2022.


If LIBOR ceases to exist or if the methods of calculating LIBOR change from the current methods for any reasons, interest rates on our floating rate loans, obligation derivatives, and other financial instruments tied to LIBOR rates, may be affected and need renegotiation with its lenders.


The Company is in the process of reviewing the potential impact that the adoption of this ASU will have on the consolidated financial statements and related disclosures.


3.

Variable Interest Entities and Securitizations

The Company determined that the SPEs created in connection with its securitizations are VIEs. A VIE is an entity that has either a total equity investment that is insufficient to permit the entity to finance its activities without additional subordinated financial support or whose equity investors lack the characteristics of a controlling financial interest. A VIE is consolidated by its primary beneficiary, which is the entity that, through its variable interests has both the power to direct the activities that significantly impact the VIE’s economic


F-41


Table of Contents

Finance of America Equity Capital LLC and Subsidiaries

Notes to Consolidated Financial Statements


performance and the obligations to absorb losses of the VIE that could potentially be significant to the VIE or the right to receive benefits from the VIE that could potentially be significant to the VIE.

Finance of America Commercial

FACo securitizes certain of its interests in fix & flip mortgages. The transactions provide debt security holders the ability to invest in a pool of performing loans secured by investment real estate. The transactions provide the Company with access to liquidity for the loans and ongoing management fees. The principal and interest on the outstanding debt securities are paid using the cash flows from the underlying loans, which serve as collateral for the debt. The Company has determined that the securitization structure meets the definition of a VIE. In its capacity as servicer of the securitized loans, the Company retains the power to direct the VIE’s activities that most significantly impact the VIEs economic performance. The Company has also retained certain beneficial interests in these trusts which provide exposure to potential gains and losses on the performance of the trust. As the Company has both the power to direct the activities that significantly impact the VIE’s economic performance and the obligations to absorb losses of the VIE that could potentially be significant to the VIE or the right to receive benefits from the VIE that could potentially be significant to the VIE, the Company has determined it meets the definition of the primary beneficiary and consolidates the trusts.

Certain obligations may arise from the agreements associated with transfers of loans. Under these agreements, the Company may be obligated to repurchase the loans, or otherwise indemnify or reimburse the investor for losses incurred due to material breach of contractual representations and warranties.

The Company incurred $2.5 million of realized losses during the year ended December 31, 2020 associated with transferred loans related to the standard securitization representations and warranties obligations. No realized losses were incurred for the years ended December 31, 2019 and 2018.

Finance of America Reverse

Finance of America Reverse LLC (“FAR”) securitizes certain of its interests in non-performing reverse mortgages and non-agency reverse mortgage loans. The transactions provide investors with the ability to invest in a pool of reverse mortgage loans secured by one-to-four-family residential properties. The transactions provide FAR with access to liquidity for these assets, ongoing servicing fees, and potential residual returns. The principal and interest on the outstanding certificates are paid using the cash flows from the underlying reverse mortgage loans, which serve as collateral for the debt. The securitizations are callable at or following the optional redemption date as defined in the respective indenture agreements. FAR has determined that these securitization structures meet the definition of VIEs. In its capacity as servicer of the securitized loans, the Company retains the power to direct the VIE’s activities that most significantly impact the VIEs economic performance. The Company has also retained certain beneficial interests in these trusts which provide exposure to potential gains and losses on the performance of the trust. As the Company has both the power to direct the activities that significantly impact the VIE’s economic performance and the obligations to absorb losses or the right to receive benefits from the VIE that could potentially be significant to the VIE, the Company has determined it meets the definition of the primary beneficiary and consolidates the trusts.

In February 2020, the Company executed its optional redemption of outstanding securitized notes related to outstanding nonperforming HECM securitizations. As part of the optional redemption, the Company paid off notes with an outstanding principal balance of $218.0 million. The notes were paid off at par.

In July 2020, the Company executed its optional redemption of outstanding securitized notes related to outstanding nonperforming HECM securitizations. As part of the optional redemption, the Company paid off notes with an outstanding principal balance of $223.9 million. The notes were paid off at par.


F-42


Table of Contents

Finance of America Equity Capital LLC and Subsidiaries

Notes to Consolidated Financial Statements


In September 2020, the Company purchased the remaining outstanding securitized notes of $15.9 million and residual interest of $5.7 million from Blackstone Toro Operating Partnership (“TORO”) related to the Toro Mortgage Funding Transaction (“TMFT”) securitization. As part of the optional redemption, the Company paid off notes with an outstanding principal balance of $122.7 million. The notes were paid off at par and the outstanding loans with UPB in the amount of $116.0 million are reflected as assets in the Consolidated Statements of Financial Condition.

In December 2020, the Company executed its optional redemption of outstanding securitized notes related to outstanding performing HECM securitizations. As part of the optional redemption, the Company paid off notes with an outstanding principal balance of $136.7 million. The notes were paid off at par.

The following table presents the assets and liabilities of the Company’s consolidated VIEs, which are included in the Consolidated Statements of Financial Condition above and excludes intercompany balances, except for retained bonds (in thousands):


     December 31,  
     2020      2019  

ASSETS


Restricted cash

   $ 293,580      $ 226,408  

Mortgage loans held for investment, subject to nonrecourse debt, at fair value


2019 FASST JR2

     488,760        505,009  

2019 FASST JR3

     450,703        460,344  

2018 FASST JR1

     449,069        506,786  

2020 FASST HB2

     398,480        —    

2019 FASST JR4

     377,265        367,380  

2020 FASST JR3

     372,015        —    

2020 FASST JR2

     341,439        —    

2019 FASST JR1

     331,244           348,919  

2020 FASST S3

     316,774        —    

2020 FASST S2

     311,721        —    

2020 FASST HB1

        265,923        —    

2018 FASST JR2

     264,622        276,125  

2020 FASST JR1

     263,266        —    

2020 FASST-JR4

     237,100        —    

2020 FASST S1

     189,243        —    

2020 RTL1 ANTLR

     137,989        —    

2019 RTL1 ANTLR

     118,161        221,143  

2018 RTL1 ANTLR

     82,393        222,099  

2018 FASST HB1

     —          206,586  

2019 FASST HB1

     —          201,382  

2019 FAHB 19-1

     —          195,439  

Other assets

     79,528        75,115  


TOTAL ASSETS

   $ 5,769,275      $ 3,812,735  


F-43


Table of Contents

Finance of America Equity Capital LLC and Subsidiaries

Notes to Consolidated Financial Statements


     December 31,  
     2020      2019  

LIABILITIES


Nonrecourse debt, at fair value


2019 FASST JR2

   $ 487,966      $ 474,134  

2020 FASST HB2

     474,599        —    

2018 FASST JR1

     458,279        507,516  

2019 FASST JR3

     445,691        427,264  

2019 FASST JR4

     368,963        343,172  

2020 FASST JR3

     354,762        —    

2019 FASST JR1

     343,544        332,829  

2020 FASST S2

     314,144        —    

2020 FASST JR2

     313,057        —    

2020 FASST S3

     309,713        —    

2020 FASST HB1

     298,914        —    

2018 FASST JR2

     269,741        274,139  

2020 FASST JR1

     250,988        —    

2020 FASST JR4

     228,804        —    

2020 FASST S1

     191,189        —    

2020 RTL1 ANTLR

     140,839        —    

2019 RTL1 ANTLR

     127,981        206,176  

2018 RTL1 ANTLR

     80,767        210,738  

2018 FASST HB1

     —          224,053  

2019 FAHB 19-1

     —          253,449  

2019 FASST HB1

     —          236,726  

Payables and other liabilities

     291        13  


TOTAL LIABILITIES

   $ 5,460,232      $ 3,490,209  


The following table presents the carrying amounts of the Company’s assets and liabilities that relate to its variable interest in the VIEs that are not consolidated (in thousands):


Period

   Classification    Carrying Amount      Maximum Exposure to
Loss (1)
 

December 31, 2020

   Debt securities    $ —        $ —    

December 31, 2019

   Debt securities    $ 103,446      $ 103,446  


(1)

The Company’s maximum exposure to losses for VIEs equals the carrying value of assets recognized on the Consolidated Statements of Financial Condition.


4.

Acquisitions

Incenter Appraisal Management LLC

On April 1, 2019, Incenter, through one of its wholly-owned subsidiaries, acquired 100% of the outstanding LLC interests of Management Appraisal Services (“MAS”) pursuant to the Amended and Restated Stock Purchase Agreement (“SPA”) between the Company and the seller dated February 26, 2019. The name of MAS was subsequently changed to Incenter Appraisal Management, LLC (“IAM”). The Company acquired MAS to further diversify the services of the Company, adding the new revenue stream for appraisal management services.


F-44


Table of Contents

Finance of America Equity Capital LLC and Subsidiaries

Notes to Consolidated Financial Statements


In accordance with the SPA, the purchase price for IAM is paid out to the seller through a deferred purchase price liability. The liability is comprised of two parts: 1) The Company pays the seller 40 percent of net income of IAM before taxes, depreciation, and amortization not to exceed the Purchase Price Cap of $2.1 million. Net income before taxes is calculated on a monthly basis, and 2) Seller receives a marketing fee per appraisal during the period of the earn-out. The amount of the monthly earn-out payment is reduced by fifty percent until the cumulative amount withheld equals the liabilities assumed by the Company at the date of acquisition. The estimated fair value of purchase consideration was $1.7 million as of the acquisition date, which consists of a $0.6 million marketing fee and a $1.1 million deferred purchase price liability. Acquired goodwill of $2.3 million was allocated to the Lender Services segment.

The table below presents the purchase price allocation of the acquisition date fair values of the assets acquired and the liabilities assumed (in thousands):


     2019  

Tangible assets acquired


Other assets, net

   $ 123  


Total tangible assets acquired

     123  


Tangible liabilities assumed


Payables and other liabilities

   $ 734  


Total tangible liabilities assumed

     734  


Tangible net liabilities acquired

   $ (611


Purchase price allocation


Deferred purchase price liability

     1,673  

Tangible net liabilities acquired

     611  


Goodwill

   $ 2,284  


On March 16, 2020, the Company signed an agreement with Silvernest, Inc. to acquire all issued and outstanding capital stock. The Company gave upfront consideration of $0.3 million dollars and an earnout which is not to exceed $2.0 million dollars over a three-year period. The Company acquired tangible assets of $0.4 million and assumed tangible liabilities of $0.2 million. For the year ended December 31, 2020, acquired goodwill of $0.6 million was allocated to the Lender Services segment.


5.

Fair Value

ASC 820, Fair Value Measurement (“ASC 820”), defines fair value as the price that would be received to sell an asset or paid to transfer a liability in an orderly transaction between market participants at the measurement date.

Fair value is based on the assumptions market participants would use when pricing an asset or liability and follows a fair value hierarchy that prioritizes the information used to develop those assumptions. The fair value hierarchy gives the highest priority to quoted prices available in active markets (i.e., observable inputs) and the lowest priority to data lacking transparency (i.e., unobservable inputs). An instrument’s categorization within the fair value hierarchy is based on the lowest level of significant input to its valuation.

All aspects of nonperformance risk, including the Company’s own credit standing, are considered when measuring the fair value of a liability.


F-45


Table of Contents

Finance of America Equity Capital LLC and Subsidiaries

Notes to Consolidated Financial Statements


Following is a description of the three levels:

Level 1 Inputs: Quoted prices for identical instruments in active markets.

Level 2 Inputs: Quoted prices for similar instruments in active markets; quoted prices for identical or similar instruments in markets that are not active; and model-derived valuations whose inputs are observable or whose significant value drivers are observable.

Level 3 Inputs: Instruments with unobservable inputs that are significant to the fair value measurement.

The Company classifies assets in their entirety based on the lowest level of input that is significant to the fair value measurement. The Company recognizes transfers between levels of the fair value hierarchy as of the end of the reporting period. There were no transfers within the hierarchy for the years ended December 31, 2020, 2019 and 2018.

Following are descriptions of the valuation methodologies used to measure material assets and liabilities at fair value and the details of the valuation models, key inputs to those models and significant assumptions utilized.

Reverse Mortgage Loans Held for Investment, Subject to HMBS Related Obligations, at Fair Value

HECM loans securitized into GNMA HMBS are not actively traded in open markets with readily observable market prices.

The Company values HECM loans securitized into GNMA HMBS utilizing a present value methodology that discounts estimated projected cash flows over the life of the loan portfolio using prepayment, borrower mortality, borrower draw and discounts rate assumptions management believes a market participant would use in estimating fair value. The significant unobservable inputs used in the measurement include:

Conditional Repayment Rate - the Company projects borrower prepayment rates which considers borrower age and gender and is based on historical termination rates. The outputs of borrower prepayment rates, which include both voluntary and involuntary prepayments, are utilized to anticipate future terminations.

Loss Frequency/Severity - termination proceeds are adjusted for expected loss frequencies and severities to arrive at net proceeds that will be provided upon final resolution. Historical experience is utilized to estimate the loss rates resulting from scenarios where FHA insurance proceeds are not expected to cover all principal and interest outstanding and, as servicer, the Company is exposed to losses upon resolution of the loan. Loss frequency and severities are based upon the historical experience with specific loan resolution waterfalls.

Due and Payable Triggers - the input for terminations not attributable to an FHA assignment is based on historical foreclosure and liquidation experience.

Discount Rate - derived based upon reference to yields required by market participants for recent transactions in the HECM loan bulk market adjusted based upon weighted average life of the loan portfolio. This rate reflects what the Company believes to be a market participant’s required yield on HECM loans of similar weighted average lives. The yield spread is applied over interpolated benchmark curve or as a spread over collateral forward curve.

Borrower Draw Rates - the draw curve is estimated based upon the historical experience with the specific product type contemplating the borrower’s age and loan age.


F-46


Table of Contents

Finance of America Equity Capital LLC and Subsidiaries

Notes to Consolidated Financial Statements


Changes to any of these assumptions could result in significantly different valuation results. The Company classifies reverse mortgage loans held for investment as Level 3 assets within the GAAP hierarchy, as they are dependent on unobservable inputs.


The following table presents the weighted average significant unobservable inputs used in the fair value measurement of reverse mortgage loans held for investment, subject to HMBS related obligations, for the periods indicated:


     December 31, 2020     December 31, 2019  
     Range of Input     Weighted Average
of Input
    Range of Input     Weighted Average
of Input
 

Conditional repayment rate

     NM       20.0     NM       21.5

Loss frequency(1)

     NM       4.4     NM       4.6

Loss severity(1)

     5.1% - 13.3     5.4     4.2% - 14.0     4.8

Discount rate

     NM       1.6     NM       2.5

Average draw rate

     NM       1.1     NM       1.1

“NM” - these “Not Meaningful” inputs do not have an applicable range, as they are a single derived input.


(1) 

Loss frequency and severity represents the frequency of losses and the losses associated with loans that are liquidated through a foreclosure sale, net of claim proceeds.

The Company aggregates loan portfolios based upon the underlying securitization trust and values these loans using these aggregated pools. The range of inputs provided above are based upon the range of inputs utilized for each securitization trust.

Mortgage Loans Held for Investment, Subject to Nonrecourse Debt, at Fair Value

Reverse Mortgage Loans

Reverse mortgage loans held for investment, subject to nonrecourse debt, include HECM loans previously purchased out of GNMA HMBS pools and non FHA-insured jumbo reverse mortgages, which have been subsequently securitized and serve as collateral for the issued debt. These loans are not traded in active and open markets with readily observable market prices. The Company classifies reverse mortgage loans held for investment, subject to nonrecourse debt as Level 3 assets within the GAAP hierarchy.

HECM Buyouts - Securitized (Nonperforming)

The Company values HECM buyouts utilizing a present value methodology that discounts estimated projected cash flows over the life of the portfolio using conditional repayment, loss frequency and severity, borrower mortality, and discount rate assumptions management believes a market participant would use in estimating fair value.


F-47


Table of Contents

Finance of America Equity Capital LLC and Subsidiaries

Notes to Consolidated Financial Statements


The following table presents the weighted average significant unobservable inputs used in the fair value measurement of these assets and liabilities for the periods indicated:


     December 31, 2020     December 31, 2019  
     Range of Input     Weighted
Average of Input
    Range of Input     Weighted
Average of Input
 

Conditional repayment rate

     NM       42.9     NM       56.9

Loss frequency(1)

     25.0% - 100.0     54.8     25.0% - 100.0     56.7

Loss severity(1)

     5.1% - 13.3     7.5     4.2% - 14.0     6.3

Discount rate

     NM       4.1     NM       5.0

“NM” - these “Not Meaningful” inputs do not have an applicable range, as they are a single derived input.


(1) 

Loss frequency and severity represents the frequency of losses and the losses associated with loans that are liquidated through a foreclosure sale, net of claim proceeds.

The Company aggregates loan portfolios based upon the underlying securitization trust and values these loans using these aggregated pools. The range of inputs provided above are based upon the range of inputs utilized for each securitization trust.

HECM Buyouts - Securitized (Performing)

The Company values securitized HECM buyouts utilizing a present value methodology that discounts estimated projected cash flows over the life of the portfolio using conditional repayment, loss frequency and severity, borrower mortality, and discount rate assumptions management believes a market participant would use in estimating fair value.


The following table presents the weighted average significant unobservable inputs used in the fair value measurement of these assets and liabilities for the periods indicated:


     December 31, 2020     December 31, 2019  
     Range of Input     Weighted Average
of Input
    Range of Input     Weighted Average
of Input
 

Weighted-average remaining life in years

     NM       8.5       NM       9.2  

Conditional repayment rate

     NM       14.7     NM       13.7

Loss severity(1)

     5.1% - 13.3     7.7     4.2% - 14.0     5.9

Discount rate

     NM       3.5     NM       4.1

“NM” - these “Not Meaningful” inputs do not have an applicable range, as they are a single derived input.


(1) 

Loss severity represents the losses associated with loans that are liquidated through a foreclosure sale, net of claim proceeds.

The Company aggregates loan portfolios based upon the underlying securitization trust and values these loans using these aggregated pools. The range of inputs provided above are based upon the range of inputs utilized for each securitization trust.


F-48


Table of Contents

Finance of America Equity Capital LLC and Subsidiaries

Notes to Consolidated Financial Statements


Non-agency reverse mortgages - Securitized

The Company values securitized non-agency reverse mortgage loans utilizing a present value methodology that discounts estimated projected cash flows over the life of the loan portfolio using repayment, home price appreciation, pool-level losses, and discount rate assumptions. The following table presents the weighted average significant unobservable inputs used in the fair value measurements of non-agency reverse mortgage loans for the periods indicated:


     December 31, 2020     December 31, 2019  
     Range of Input     Weighted Average
of Input
    Range of Input     Weighted Average
of Input
 

Weighted-average remaining life in years

     NM       6.9       NM       10.1  

Loan to value

     9.0% - 73.1     48.2     NM       46.7

Conditional repayment rate

     NM       18.7     NM       12.1

Loss severity(1)

     NM       10.0     NM       10.0

Home price appreciation

     1.1% - 8.9     5.6     3.4% - 7.4     5.4

Discount rate

     NM       3.6     NM       4.5

“NM” - these “Not Meaningful” inputs do not have an applicable range, as they are a single derived input.


(1) 

Loss severity represents the losses associated with loans that are liquidated through a foreclosure sale, net of claim proceeds.


The Company aggregates loan portfolios based upon the underlying securitization trust and values these loans using these aggregated pools. The range of inputs provided above are based upon the range of inputs utilized for each securitization trust.

Commercial Mortgage Loans

Fix & Flip

The Fix & Flip loans are short-term loans for individual real estate investors, with terms ranging from 9-18 months. This product is valued using a discounted cash flow model. The Company classifies these mortgage loans as Level 3 assets within the GAAP hierarchy.

The Company utilized the following weighted average assumptions in estimating the fair value of fix & flip mortgage loans for the periods indicated:


     December 31, 2020     December 31, 2019  
     Range of Input     Weighted Average
of Input
    Range of Input     Weighted Average
of Input
 

Prepayment rate (SMM)

     NM       17.1     NM       14.4

Discount rate

     6.7% - 10.0     6.7     5.3% - 6.8     5.3

Default rate (MDR)(1)

     N/A       N/A (1)      0% - 0.5     0.5

Loss frequency(2)

     0.2% - 44.0     0.6     0.1% - 1.8     0.1

“NM” - these “Not Meaningful” inputs do not have an applicable range, as they are a single derived input.


(1) 

The Company determined that loss frequency is a significant input in the model. As such, the default rate is no longer considered a significant input for 2020.


F-49


Table of Contents

Finance of America Equity Capital LLC and Subsidiaries

Notes to Consolidated Financial Statements


(2) 

Loss frequency represents the frequency of losses associated with loans that are liquidated through a foreclosure sale, net of claim proceeds.

The Company aggregates loan portfolios based upon the underlying securitization trust and values these loans using these aggregated pools. The range of inputs provided above are based upon the range of inputs utilized for each securitization trust.

Mortgage Loans Held for Investment, at Fair Value

Reverse Mortgage Loans

Reverse mortgage loans held for investment, at fair value, consists of originated or purchased HECM and non-agency reverse mortgage loans not yet securitized, unsecuritized tails, and certain HECMs purchased out of GNMA HMBS (“Inventory Buyouts”) that the Company intends to securitize for purposes of serving as collateral for future securitization transfers.

Originated or purchased HECM loans held for investment are valued predominantly by utilizing forward HMBS prices for similar pool characteristics and based on observable market data. These amounts are further adjusted to include future cash flows that would be earned for servicing the HECM loan over the life of the asset.

Unsecuritized tails consists of performing and nonperforming repurchased loans. The fair value of performing unsecuritized tails are valued at current pricing levels for similar GNMA HMBS. The fair value of nonperforming unsecuritized tails is based on expected claim proceeds from HUD upon assignment of the loans.

The fair value of repurchased loans is based on expected cash proceeds of the liquidation of the underlying properties and expected claim proceeds from HUD. The primary assumptions utilized in valuing nonperforming repurchased loans include loss frequency and loss severity. Termination proceeds are adjusted for expected loss frequencies and severities to arrive at net proceeds that will be provided upon final resolution, including assignments to FHA. Historical experience is utilized to estimate the loss rates resulting from scenarios where FHA insurance proceeds are not expected to cover all principal and interest outstanding and as servicer, the Company is exposed to losses upon resolution of the loan.

The Company classifies reverse mortgage loans held for investment, at fair value as Level 3 assets within the GAAP hierarchy.


Inventory Buyouts

The fair value of Inventory Buyouts is based on the expected cash proceeds of the liquidation of the underlying properties and expected claim proceeds from HUD. The primary assumptions utilized in valuing Inventory Buyouts include loss frequency and loss severity. Termination proceeds are adjusted for expected loss frequencies and severities to arrive at net proceeds that will be provided upon final resolution, including assignments to FHA. Historical experience is utilized to estimate the loss rates resulting from scenarios where FHA insurance proceeds are not expected to cover all principal and interest outstanding and as servicer, the Company is exposed to losses upon resolution of the loan.

The Company values Inventory Buyouts utilizing a present value methodology that discounts estimated projected cash flows over the life of the portfolio using conditional repayment, loss frequency and severity, borrower mortality, and discount rate assumptions management believes a market participant would use in estimating fair value.


F-50


Table of Contents

Finance of America Equity Capital LLC and Subsidiaries

Notes to Consolidated Financial Statements


The following table presents the weighted average significant unobservable inputs used in the fair value measurement of HECM buyouts - inventory classified as reverse mortgage loans held for investment for the periods indicated:


     December 31, 2020     December 31, 2019  
     Range of Input      Weighted Average
of Input
    Range of Input      Weighted Average
of Input
 

Conditional repayment rate

     NM        44.0     NM        52.5

Loss frequency(1)

     NM        46.9     NM        56.7

Loss severity(1)

     NM        10.5     NM        6.3

Discount rate

     NM        4.1     NM        5.0

“NM” - these “Not Meaningful” inputs do not have an applicable range, as they are a single derived input.


(1) 

Loss frequency and severity represents the frequency of losses and the losses associated with loans that are liquidated through a foreclosure sale, net of claim proceeds.

Non-Agency Reverse Mortgage Loans

The fair value of non-agency reverse mortgage loans is based on values for investments with similar investment grade ratings and the value the Company would expect to receive if the whole loans were sold to an investor.

The Company values non-agency reverse mortgage loans utilizing a present value methodology that discounts estimated projected cash flows over the life of the loan portfolio using prepayment, home price appreciation, pool-level losses, cost to service, and discount rates.

The following table presents the weighted average significant unobservable inputs used in the fair value measurement of non-agency reverse mortgage loans classified as reverse mortgage loans held for investment for the periods indicated:


     December 31, 2020     December 31, 2019  
     Range of Input     Weighted Average
of Input
    Range of Input     Weighted Average
of Input
 

Weighted-average remaining life in years

     NM       8.0       NM       10.9  

Loan to value

     0.1% - 62.1     44.0     8.4% - 120.7     40.5

Conditional repayment rate

     NM       16.8     NM       11.7

Loss severity(1)

     NM       10.0     NM       10.0

Home price appreciation

     1.1% - 8.9     5.5     3.4% - 7.4     5.4

Discount rate

     NM       3.6     NM       4.4

“NM” - these “Not Meaningful” inputs do not have an applicable range, as they are a single derived input.


(1) 

Loss severity represents the losses associated with loans that are liquidated through a foreclosure sale, net of claim proceeds.


F-51


Table of Contents

Finance of America Equity Capital LLC and Subsidiaries

Notes to Consolidated Financial Statements


Commercial Mortgage Loans

Agricultural Loans

The agricultural loans are government-insured loans made to farmers to fund their inputs and operating expenses for the upcoming growing season with terms ranging from 7 - 17 months. The product is valued using a discounted cash flow model. The Company classifies these mortgage loans as Level 3 assets within the GAAP hierarchy.

The Company utilized the following weighted average assumptions in estimating the fair value of loans for the periods indicated:


     December 31, 2020     December 31, 2019  
     Range of Input     Weighted Average
of Input
    Range of Input     Weighted Average
of Input
 

Discount rate

     NM       6.4     NM       8.0

Prepayment rate (CPR)

     0% - 1.0     0.7     0% - 1.0     0.3 %

Default rate (CDR)

     0% - 2.0     0.4     0% - 2.0     1.4

“NM” - these “Not Meaningful” inputs do not have an applicable range, as they are a single derived input.

Fix & Flip

The Fix & Flip loans are short-term loans for individual real estate investors, with terms ranging from 9-18 months. This product is valued using a discounted cash flow model. The Company classifies these mortgage loans as Level 3 assets within the GAAP hierarchy.

The Company utilized the following weighted average assumptions in estimating the fair value of fix & flip mortgage loans for the periods indicated:


     December 31, 2019  
     Range of Input     Weighted Average
of Input
 

Prepayment rate (SMM)

     NM       11.4

Discount rate

     NM       5.5

Default rate (MDR)

     0% - 0.4     0.4

Loss frequency(1)

     0.1% - 0.4     0.1

“NM” - these “Not Meaningful” inputs do not have an applicable range, as they are a single derived input.


(1) 

Loss frequency represents the frequency of losses associated with loans that are liquidated through a foreclosure sale, net of claim proceeds.

As of December 2020, management made the decision to change the classification of fix & flip loans from mortgage loans held for investment, at fair value to mortgage loans held for sale, at fair value.


F-52


Table of Contents

Finance of America Equity Capital LLC and Subsidiaries

Notes to Consolidated Financial Statements


Mortgage Loans Held for Sale, at Fair Value

Reverse Mortgage Loans

Reverse mortgage loans held for sale, at fair value, consists of unpoolable loans that the Company intends to sell to third party investors. Reverse mortgage loans held for sale consists primarily of performing repurchased loans. The fair value of performing unpoolable loans is based on expected claim proceeds from HUD upon assignment of the loans. In certain instances the loan balance may exceed the MCA. In these instances, the fair value is based on expected proceeds from sale of the underlying property and any additional HUD claim proceeds. The Company classifies reverse mortgage loans held for sale as Level 3 assets within the GAAP hierarchy.

Residential and Commercial Mortgage Loans

Mortgage loans held for sale include residential and commercial mortgage loans originated by the Company and held until sold to secondary market investors. The Company primarily originates conventional GSEs and government (FHA and Department of Veteran Affairs) residential mortgage loans (collectively “residential mortgage loans held for sale”) and recourse and nonrecourse commercial mortgage loans to owners and investors of single and multi-family residential rental properties (“commercial loans held for sale”).


Residential Mortgage Loans

The Company originates or purchases mortgage loans in the U.S. that it intends to sell to FNMA, FHLMC, and GNMA (collectively “the Agencies”). Additionally, the Company originates or purchases mortgage loans in the U.S. that it intends to sell into the secondary markets via whole loan sales. Mortgage loans held for sale are typically pooled and sold into certain exit markets, depending upon underlying attributes of the loan, such as agency eligibility, product type, interest rate, and credit quality. In addition, the Company may originate loans that do not meet specific underwriting criteria and are not eligible to be sold to the Agencies. Two valuation methodologies are used to determine the fair value of mortgage loans held for sale. The methodology used depends on the exit market as described below:

Loans valued using observable market prices for identical or similar assets - This includes all mortgage loans that can be sold to the Agencies, which are valued predominantly by published forward agency prices. This will also include all non-agency loans where recently negotiated market prices for the loan pool exist with a counterparty (which approximates fair value), or quoted market prices for similar loans are available. As these valuations are derived from quoted market prices, the Company classified these valuations as Level 2 in the fair value disclosures. During periods of illiquidity of the mortgage marketplace, it may be necessary to look for alternative sources of value, including the whole loan purchase market for similar loans, and place more reliance on the valuations using internal models.

Loans valued using internal models – To the extent observable market prices are not available, the Company will determine the fair value of mortgage loans held for sale using a collateral based valuation model, which approximates expected cash proceeds on liquidation. For loans where bid prices or commitment prices are unavailable, these valuation models estimate the exit price the Company expects to receive in the loan’s principal market and are based on a combination of recent appraisal values, adjusted for certain loss factors. The Company classifies these valuations as Level 3 in the fair value disclosures.


F-53


Table of Contents

Finance of America Equity Capital LLC and Subsidiaries

Notes to Consolidated Financial Statements


Commercial Mortgage Loans

The Company primarily originates two separate commercial loan products that it classifies as held for sale: Single Rental Loan (“SRL”) and Portfolio Lending.

SRL

The SRL product is designed for small/individual real estate investors looking to purchase and then rent-out a single property. These are 30-year loans with fixed interest rates typically between 5.0% - 8.0%. This product is valued using a discounted cash flow model. The Company classifies these mortgage loans as Level 3 assets within the GAAP hierarchy.

The Company utilized the following weighted average assumptions in estimating the fair value of SRL mortgage loans held for sale for the periods indicated:


     December 31, 2020     December 31, 2019  
     Range of Input     Weighted Average
of Input
    Range of Input     Weighted Average
of Input
 

Prepayment rate (CPR)

     1.0% - 17.1     15.4     1.0% - 29.4     21.5

Discount rate

     NM       5.0     NM       4.7

Default rate (CDR)

     1.0% - 64.9     3.6     1.0% - 51.0     1.6

“NM” - these “Not Meaningful” inputs do not have an applicable range, as they are a single derived input.

Portfolio Lending

The Portfolio product is designed for larger investors with multiple properties. Specifically, these loans are useful for consolidating multiple rental property mortgages into a single loan. These loans have fixed coupons that typically range from 5.0% - 6.2%, with 5 and 10-year balloon structures, as well as a 30 year structure. This product is valued using a discounted cash flow model. The Company classifies these mortgage loans as Level 3 assets within the GAAP hierarchy.


The Company utilized the following weighted average assumptions in estimating the fair value of Portfolio mortgage loans held for sale for the periods indicated:


     December 31, 2020     December 31, 2019  
     Range of Input     Weighted Average
of Input
    Range of Input     Weighted Average
of Input
 

Prepayment rate (CPR)

     0% - 15.0     9.3     0% - 1.0     0.0

Discount rate

     NM       4.9     NM       5.0

Default rate (CDR)

     1.0% - 42.7     2.0     1.0% - 43.4%       1.0

“NM” - these “Not Meaningful” inputs do not have an applicable range, as they are a single derived input.

Due to limited sales activity and periodically unobservable prices in certain of the Company’s markets, certain mortgage loans held for sale portfolios may transfer from Level 2 to Level 3 in future periods.


F-54


Table of Contents

Finance of America Equity Capital LLC and Subsidiaries

Notes to Consolidated Financial Statements


Fix & Flip

The Fix & Flip loans are short-term loans for individual real estate investors, with terms ranging from 9-18 months. This product is valued using a discounted cash flow model. The Company classifies these mortgage loans as Level 3 assets within the GAAP hierarchy.

The Company utilized the following weighted average assumptions in estimating the fair value of fix & flip mortgage loans for the periods indicated:


     December 31, 2020  
     Range of Input     Weighted Average
of Input
 

Prepayment rate (SMM)

     NM       12.4

Discount rate

     6.7% - 10.0     7.2

Default rate (MDR)(1)

     NM       N/A (1) 

Loss frequency(1)(2)

     NM       0.8

“NM” - these “Not Meaningful” inputs do not have an applicable range, as they are a single derived input.


(1) 

The Company determined that loss frequency is a significant input in the model. As such, the default rate is no longer considered a significant input for 2020.

(2) 

Loss frequency represents the frequency of losses associated with loans that are liquidated through a foreclosure sale, net of claim proceeds.

As of December 2020, management made the decision to change the classification of fix & flip loans from mortgage loans held for investment, at fair value to mortgage loans held for sale, at fair value.

Mortgage Servicing Rights

As of December 31, 2020, the Company valued mortgage servicing rights internally. The Company used a third party to provide valuations of the mortgage servicing rights as of December 31, 2019. The significant assumptions utilized to determine fair value are projected prepayments using the Public Securities Association Standard Prepayment Model, discount rates, and projected servicing costs that vary based on the loan type and delinquency. The Company classifies these valuations as Level 3 since they are dependent on unobservable inputs.

Fair value is derived through a discounted cash flow analysis and calculated using a computer pricing model. This computer valuation is based on the objective characteristics of the portfolio (loan amount, note rate, etc.) and commonly used industry assumptions (PSAs, etc.). The assumptions taken into account by the pricing model are those which many active purchasers of servicing employ in their evaluations of portfolios for sale in the secondary market. The unique characteristics of the secondary servicing market often dictate adjustments to parameters over short periods of time.

Subjective factors are also considered in the derivation of fair values, including levels of supply and demand for servicing, interest rate trends, and perception of risk not incorporated into prepayment assumptions.

Fair value is defined as the estimated price at which the servicing would change hands in the marketplace between a willing buyer and seller. The valuation assumes that neither party would be under any compulsion to buy or sell and that each has reasonably complete and accurate knowledge of all relevant aspects of the offered servicing. The fair values represented in this analysis have been derived under the assumptions that sufficient time would be available to market the portfolio.


F-55


Table of Contents

Finance of America Equity Capital LLC and Subsidiaries

Notes to Consolidated Financial Statements


The following tables summarize certain information regarding the servicing portfolio of retained MSRs for the periods indicated:


     December 31, 2020     December 31, 2019  

Capitalization servicing rate

     0.8     0.9

Capitalization servicing multiple

     3.2       2.6  

Weighted-average servicing fee (in basis points)

     25       35  

The significant assumptions used in estimating the fair value of MSRs were as follows (in annual rates):


     December 31, 2020     December 31, 2019  
     Range of Input     Weighted Average
of Input
    Range of Input     Weighted Average
of Input
 

Weighted-average prepayment speed (CPR)

     6.6% - 24.9     12.1     11.3% - 18.4     13.8

Discount rate

     NM       12.1     NM       10.3

Weighted-average delinquency rate

     1.2% - 9.2     1.3     1.9% - 37.5     6.3

“NM” - these “Not Meaningful” inputs do not have an applicable range, as they are a single derived input.

The following table summarizes the estimated change in the fair value of MSRs from adverse changes in the significant assumptions (in thousands):


     December 31, 2020     


     Weighted
Average
Prepayment
Speed
     Discount
Rate
     Weighted
Average
Delinquency
Rate
 

Impact on fair value of 10% adverse change

   $ (7,355    $ (6,735    $ (119

Impact on fair value of 20% adverse change

     (14,139      (12,925      (237

These sensitivities are hypothetical and should be evaluated with care. The effect on fair value of a 10% variation in assumptions generally cannot be determined because the relationship of the change in assumptions to the fair value may not be linear. Additionally, the impact of a variation in a particular assumption on the fair value is calculated while holding other assumptions constant. In reality, changes in one factor may lead to changes in other factors, which could impact the above hypothetical effects.

Debt Securities, at Fair Value

Mortgage Backed Securities

The Company values mortgage backed securities utilizing a present value methodology that discounts estimated projected cash flows over the life of the investment using conditional prepayment rates, home price appreciation, expected loss severities and discount rates. The Company classifies mortgage backed securities as Level 3 assets within the GAAP hierarchy.


F-56


Table of Contents

Finance of America Equity Capital LLC and Subsidiaries

Notes to Consolidated Financial Statements


The following table presents the weighted average significant unobservable inputs used in the fair value measurement of these assets for the periods indicated:


     December 31, 2019  
     Range of Input      Weighted Average
of Input
 

Weighted-average remaining life in years

     NM        1.8  

Conditional repayment rate

     NM        45.0

Loss severity(1)

     NM        10.0

Discount rate

     NM        3.0

“NM” - these “Not Meaningful” inputs do not have an applicable range, as they are a single derived input.


(1) 

Loss severity represents the losses associated with loans that are liquidated through a foreclosure sale, net of claim proceeds.

Investments, at Fair Value

The Company invests in the equity of other companies in the form of common stock, preferred stock, or other in-substance equity interests. To the extent market prices are not observable, the Company engages third-party valuation experts to assist in determining the fair value of these investments. The values are determined utilizing a market approach which estimates fair value based on what other participants in the market have paid for reasonably similar assets that have been sold within a reasonable period from the valuation date. The Company classifies these valuations as Level 3 in the fair value disclosures.

Derivative Assets and Liabilities

Some of the derivatives held by the Company are exchange-traded or traded within highly active dealer markets. In order to determine the fair value of these instruments, the Company utilizes the exchange price or dealer market price for the particular derivative contract; therefore, these contracts are classified as Level 1. In addition, the Company enters into IRLCs with prospective borrowers. Commitments to fund residential mortgage loans with potential borrowers are a binding agreement to lend funds to these potential borrowers at a specified interest rate within a specified period of time. The fair value of IRLCs is derived from the fair value of similar mortgage loans or bonds, which is based on observable market data. Changes to the fair value of IRLCs are recognized based on changes in interest rates, changes in the probability that the commitment will be exercised (pull through factor), and the passage of time. The expected net future cash flows related to the associated servicing of the loan are included in the fair value measurement of IRLCs. The Company adjusts the outstanding IRLCs with prospective borrowers based on an expectation that it will be exercised and the loan will be funded. Given the unobservable nature of the pull through factor, IRLCs are classified as Level 3.

In addition, the Company executes derivative contracts, including forward commitments, TBAs, interest rate swaps, and interest rate swap futures, as part of its overall risk management strategy related to its reverse mortgage and commercial loan portfolios. The value of the forward commitments is estimated using current market prices for HMBS and are considered Level 3 in the fair value hierarchy. TBAs are valued based on forward dealer marks from the Company’s approved counterparties and are considered Level 2 in the fair value hierarchy. The value of interest rate swaps and interest rate swap futures is based on the exchange price or dealer market prices. The Company classifies interest rate swaps as Level 2 in the fair value hierarchy. The Company classifies interest rate swap futures as Level 1 in the fair value hierarchy. The value of the forward MBS is based


F-57


Table of Contents

Finance of America Equity Capital LLC and Subsidiaries

Notes to Consolidated Financial Statements


on forward prices with dealers in such securities or internally-developed third party models utilizing observable market inputs. The Company classifies forward MBS as Level 2 in the fair value hierarchy.

HMBS Related Obligations, at Fair Value

The HMBS related obligation valuation considers the obligation to pass FHA insured cash flows through to the beneficial interest holders (repayment of secured borrowing) of the HMBS securities and the servicer and issuer obligations of the Company.

The valuation of the obligation to repay the secured borrowing is estimated using Level 3 unobservable market inputs. The estimated fair value is based on the net present value of projected cash flows over the estimated life of the liability. The estimated fair value of the HMBS related obligations also includes the consideration required by a market participant to transfer the HECM and HMBS servicing obligations including exposure resulting from shortfalls in FHA insurance proceeds.

The Company’s valuation considers assumptions that it believes a market participant would consider in valuing the liability, including, but not limited to, assumptions for repayment, costs to transfer servicing obligations, shortfalls in FHA insurance proceeds, and discount rates. The significant unobservable inputs used in the measurement include:

Borrower Repayment Rates - the conditional repayment rate curve considers borrower age and gender is based on historical termination rates.

Discount Rate - derived based on an assessment of current market yields and spreads that a market participant would consider for entering into an obligation to pass FHA insured cash flows through to holders of the HMBS beneficial interests. Yield spread applied over interpolated benchmark curve or as a spread over collateral forward curve.

The following table presents the weighted average significant unobservable inputs used in the fair value measurement of HMBS related obligations:


     December 31, 2020     December 31, 2019  
     Range of Input      Weighted Average
of Input
    Range of Input      Weighted Average
of Input
 

Conditional repayment rate

     NM        19.9     NM        21.4

Discount rate

     NM        1.4     NM        2.5

“NM” - these “Not Meaningful” inputs do not have an applicable range, as they are a single derived input.

Nonrecourse Debt

Reverse Mortgage Loans

Outstanding notes issued that are securitized by nonrecourse debt are paid using the cash flows from the underlying reverse mortgage loans, which serve as collateral for the debt. Nonrecourse debt is estimated using Level 3 unobservable market inputs. The estimated fair value is based on the net present value of projected cash flows over the estimated life of the liability. The significant unobservable inputs used in the measurement include:

Weighted Average Remaining Life - the projected remaining life is based on the expected conditional prepayment rate, which is utilized to determine future terminations.


F-58


Table of Contents

Finance of America Equity Capital LLC and Subsidiaries

Notes to Consolidated Financial Statements


Borrower Repayment Rates - the conditional repayment rate curve considers borrower age and gender is based on historical termination rates.

Discount Rate - derived based on an assessment of current market yields and spreads that a market participant would consider for entering into an obligation to pass FHA insured cash flows through to holders of the HMBS beneficial interests. Yield spread applied over interpolated benchmark curve or as a spread over collateral forward curve.

The Company’s valuation considers assumptions that it believes a market participant would consider in valuing the liability, including, but not limited to, assumptions for prepayment and discount rates. The following table presents the weighted average significant unobservable inputs used in the fair value measurements of nonrecourse debt for the periods indicated:


     December 31, 2020     December 31, 2019  
     Range of Input     Weighted
Average of
Input
    Range of Input     Weighted
Average of
Input
 

Nonperforming HECM securitizations


Weighted-average remaining life (in years)

     0.2 -1.5       1.0       0.1 -0.4       0.2  

Conditional repayment rate

     34.3% - 56.3     42.8     48% - 100     73.1

Discount rate

     NM       3.1     NM       3.8

Performing HECM securitizations


Weighted-average remaining life (in years)

     NM       —         NM       2.8  

Conditional repayment rate

     NM       —       NM       11.3

Discount rate

     NM       —       NM       3.3

Securitized Non-Agency Reverse


Weighted-average remaining life (in years)

     0.3 -  2.7       2.1       3.5 - 4.3       3.9  

Conditional repayment rate

     19.6% - 35.8     23.9     7.4% - 8.5     7.9

Discount rate

     NM       2.2     NM       4.1

“NM” - these “Not Meaningful” inputs do not have an applicable range, as they are a single derived input.

Commercial Mortgage Loans

Outstanding nonrecourse notes issued that are securitized by loans held for investment, subject to nonrecourse debt, are paid using the cash flows from the underlying mortgage loans. The fair value of nonrecourse debt is estimated using Level 3 unobservable market inputs. The estimated fair value is based on the net present value of projected cash flows over the estimated life of the liability.


F-59


Table of Contents

Finance of America Equity Capital LLC and Subsidiaries

Notes to Consolidated Financial Statements


The Company’s valuation considers assumptions that it believes a market participant would consider in valuing the liability, including, but not limited to, assumptions for prepayment and discount rates. The Company estimates prepayment speeds giving consideration that the Company may in the future transfer additional loans to the trust, subject to the availability of funds provided for within the trust. The following table presents the significant unobservable inputs used in the fair value measurements of nonrecourse debt for the periods indicated:


     December 31, 2020     December 31, 2019  
     Range of Input     Weighted
Average of
Input
    Range of Input     Weighted
Average of
Input
 

Nonrecourse Debt


Weighted-average remaining life (in months)

     1.9 - 4.1       3.4       4.4 - 4.8       4.6  

Weighted-average prepayment speed (SMM)

     17.7% - 32.0     21.4     12.7% - 16.5     14.6

Discount rate

     NM       5.8     NM       4.3

“NM” - these “Not Meaningful” inputs do not have an applicable range, as they are a single derived input.

Deferred Purchase Price Liabilities

Deferred purchase price liabilities are measured using a present value of future payments which considers various assumptions, including future loan origination volumes, projected earnings and discount rates. As of December 31, 2020 and 2019, the Company utilized discount rates ranging from 12% to 21% to value the deferred purchase price liabilities. As this value is largely based on unobservable inputs, the Company classifies this liability as Level 3 in the fair value hierarchy.

In certain cases, the inputs used to measure fair value may fall into different levels of the fair value hierarchy. In such cases, the determination of which category within the fair value hierarchy is appropriate for any given asset or liability is based on the lowest level of input that is significant to the fair value measurement. The Company’s assessment of the significance of a particular input to the fair value measurement in its entirety requires judgment, and considers factors specific to the asset or liability.

Nonrecourse MSR Financing Liability, at Fair Value

In December 2020, the Company entered into agreements with third parties to sell beneficial interests in the servicing fees generated from its originated or acquired mortgage servicing rights. Under these agreements, the Company has agreed to sell to the third parties the right to receive all excess servicing and ancillary fees related to the identified mortgage servicing rights in exchange for an upfront payment equal to the entire purchase price of the acquired or originated mortgage servicing rights. For the year ended December 31, 2020, the Company had outstanding MSRs of $14.9 million pledged against this agreement.

Consistent with the underlying mortgage servicing rights, fair value is derived through a discounted cash flow analysis and calculated using a computer pricing model. This computer valuation is based on the objective characteristics of the portfolio (loan amount, note rate, etc.) and commonly used industry assumptions (PSAs, etc.). The assumptions taken into account by the pricing model are those which many active purchasers of servicing employ in their evaluations of portfolios for sale in the secondary market. The unique characteristics of the secondary servicing market often dictate adjustments to parameters over short periods of time.


F-60


Table of Contents

Finance of America Equity Capital LLC and Subsidiaries

Notes to Consolidated Financial Statements


Subjective factors are also considered in the derivation of fair values, including levels of supply and demand for servicing, interest rate trends, and perception of risk not incorporated into prepayment assumptions.

The Company classifies the valuations of the Nonrecourse MSR Financing Liability as Level 3 in the fair value disclosures.

The significant assumptions used in estimating the fair value of the outstanding nonrecourse MSR financing liability were as follows (in annual rates):


     December 31, 2020  
     Range of Input     Weighted Average
of Input
 

Weighted average prepayment speed (CPR)

     6.9% - 12.7     11.6

Discount rate

     11.7% - 12     12.0

Weighted average delinquency rate

     NM       1.8

“NM” - these “Not Meaningful” inputs do not have an applicable range, as they are a single derived input.

The following table summarizes the estimated change in the fair value of the nonrecourse MSR financing liability, at fair value from adverse changes in the significant assumptions (in thousands):


     December 31, 2020  
     Weighted
Average
Prepayment
Speed
     Discount
Rate
     Weighted
Average
Delinquency
Rate
 

Impact on fair value of 10% adverse change

   $ (701    $ (696    $ (8

Impact on fair value of 20% adverse change

     (1,348      (1,334      (15

These sensitivities are hypothetical and should be evaluated with care. The effect on fair value of a 10% variation in assumptions generally cannot be determined because the relationship of the change in assumptions to the fair value may not be linear. Additionally, the impact of a variation in a particular assumption on the fair value is calculated while holding other assumptions constant. In reality, changes in one factor may lead to changes in other factors, which could impact the above hypothetical effects.


F-61


Table of Contents

Finance of America Equity Capital LLC and Subsidiaries

Notes to Consolidated Financial Statements


The following table provides a summary of the recognized assets and liabilities that are measured at fair value on a recurring basis (in thousands):


     December 31, 2020  
     Total Fair
Value
     Level 1      Level 2      Level 3  

Assets


Reverse mortgage loans held for investment, subject to HMBS related obligations

   $ 9,929,163      $ —        $ —        $ 9,929,163  

Mortgage loans held for investment, subject to nonrecourse debt:


Reverse mortgage loans

     5,057,624        —          —          5,057,624  

Fix & flip mortgage loans

     338,543        —          —          338,543  

Mortgage loans held for investment:


Reverse mortgage loans

     661,790        —          —          661,790  

Agricultural loans

     69,031        —          —          69,031  

Mortgage loans held for sale:


Residential mortgage loans

     2,080,585        —          2,069,957        10,628  

SRL

     60,467        —          —          60,467  

Portfolio

     38,850        —          —          38,850  

Fix & flip mortgage loans

     42,909        —          —          42,909  

Mortgage servicing rights

     180,684        —          —          180,684  

Investments

     18,934        —          —          18,934  

Derivative assets:


Forward commitments and TBAs

     1,806        —          722        1,084  

IRLCs

     87,576        —          —          87,576  

Interest rate swaps and interest rate swap futures

     2,683        2,683        —          —    


Total assets

   $ 18,570,645      $ 2,683      $ 2,070,679      $ 16,497,283  


Liabilities


HMBS related obligation

   $ 9,788,668      $ —        $ —        $ 9,788,668  

Nonrecourse debt

     5,257,754        —          —          5,257,754  

Deferred purchase price liabilities

     3,842        —          —          3,842  

Nonrecourse MSR financing liability

     14,088        —          —          14,088  

Derivative liabilities:


Forward MBS

     18,634        —          18,634        —    

Forward commitments and TBAs

     1,332        —          248        1,084  

Interest rate swaps and interest rate swap futures

     755        711        44        —    


Total liabilities

   $ 15,085,073      $ 711      $ 18,926      $ 15,065,436  


F-62


Table of Contents

Finance of America Equity Capital LLC and Subsidiaries

Notes to Consolidated Financial Statements


     December 31, 2019  
     Total Fair
Value
     Level 1      Level 2      Level 3  

Assets


Reverse mortgage loans held for investment, subject to HMBS related obligations

   $ 9,480,504      $ —        $ —        $ 9,480,504  

Mortgage loans held for investment, subject to nonrecourse debt:


Reverse mortgage loans

     3,067,970        —          —          3,067,970  

Fix & flip mortgage loans

     443,242        —          —          443,242  

Mortgage loans held for investment:


Reverse mortgage loans

     1,083,586        —          —          1,083,586  

Fix & flip mortgage loans

     319,117        —          —          319,117  

Agricultural loans

     11,370        —          —          11,370  

Mortgage loans held for sale:


Reverse mortgage loans

     66,421        —          —          66,421  

Residential mortgage loans

     1,086,744        —          1,068,601        18,143  

SRL

     78,652        —          —          78,652  

Portfolio

     19,757        —          —          19,757  

Mortgage servicing rights

     2,600        —          —          2,600  

Debt securities

     102,110        —          —          102,110  

Investments

     20,508        —          —          20,508  

Derivative assets:


Forward commitments and TBAs

     838        —          838        —    

IRLCs

     14,008        —          —          14,008  

Forward MBS

     348        —          348        —    

Interest rate swaps and interest rate swap futures

     359        359        —          —    


Total assets

   $ 15,798,134      $ 359      $ 1,069,787      $ 14,727,988  


Liabilities


HMBS related obligation

   $ 9,320,209      $ —        $ —        $ 9,320,209  

Nonrecourse debt

     3,490,196        —          —          3,490,196  

Deferred purchase price liabilities

     4,300        —          —          4,300  

Derivative liabilities:


IRLCs

     68        —          —          68  

Forward MBS

     2,048        —          2,048        —    

Forward commitments and TBAs

     84        —          84        —    

Interest rate swaps and interest rate swap futures

     138        —          138        —    


Total liabilities

   $ 12,817,043      $ —        $ 2,270      $ 12,814,773  


F-63


Table of Contents

Finance of America Equity Capital LLC and Subsidiaries

Notes to Consolidated Financial Statements


Assets and liabilities measured at fair value on a recurring basis using significant unobservable inputs (Level 3, in thousands):


     Assets  
December 31, 2020    Mortgage
loans held
for
investment
    Mortgage
loans held
for
investment,
subject to
nonrecourse
debt
    Mortgage
loans held
for sale
    Derivative
assets
     Mortgage
servicing
rights
     Debt
securities
    Investments  

Beginning balance

   $ 10,894,577     $ 3,511,212     $ 182,973     $ 14,008      $ 2,600      $ 102,260     $ 20,508  

Total gain or losses included in earnings

     627,251       304,663       (2,158     74,470        4,562        2,288       (5,512

Purchases, settlements and transfers


Purchases and additions, net

     3,616,667       136,838       409,467       182        173,522        24,489       3,938  

Sales and settlements

     (1,536,977     (1,285,902     (605,018     —          —          (129,037     —    

Transfers in/(out) between categories

     (2,941,534     2,729,356       167,590       —          —          —         —    


Ending balance

   $ 10,659,984     $ 5,396,167     $ 152,854     $ 88,660      $ 180,684      $ —       $ 18,934  


     Liabilities  
December 31, 2020    HMBS related
obligations
    Derivative
liabilities
    Deferred purchase
price liability
    Nonrecourse debt     Nonrecourse MSR
Financing Liability
 

Beginning balance

   $ (9,320,209   $ (68   $ (4,300   $ (3,490,196   $ —    

Total gain or losses included in earnings

     (359,951     (834     (3,014     (294,802     798  

Purchases, settlements and transfers


Purchases and additions, net

     (2,051,953     (182     (138     (3,110,368     (15,101

Sales and settlements

     1,943,445       —         3,610       1,637,612       215  


Ending balance

   $ (9,788,668   $ (1,084   $ (3,842   $ (5,257,754   $ (14,088


F-64


Table of Contents

Finance of America Equity Capital LLC and Subsidiaries

Notes to Consolidated Financial Statements


     Assets  
December 31, 2019    Mortgage
loans held
for
investment
    Mortgage
loans held

for
investment,
subject to
nonrecourse
debt
    Mortgage
loans held

for sale
    Derivative
assets
     Mortgage
servicing
rights
    Debt
securities
    Investments  

Beginning balance

   $ 10,847,040     $ 1,560,867     $ 153,290     $ 10,551      $ 3,376     $ 2,793     $ —    

Total gain or losses included in earnings

     827,357       118,861       69       3,457        (1,357     (2,646     —    

Purchases, settlements and transfers


Purchases and additions, net

     3,547,545       45,782       287,121       —          3,702       120,581       2,063  

Sales and settlements

     (956,483     (747,124     (1,086,352     —          (3,121     (18,468     —    

Transfers in/(out) between categories

     (3,370,882     2,532,826       828,845       —          —         —         18,445  


Ending balance

   $ 10,894,577     $ 3,511,212     $ 182,973     $ 14,008      $ 2,600     $ 102,260     $ 20,508  


     Liabilities  
December 31, 2019    HMBS related
obligations
     Derivative liabilities      Deferred purchase
price liability
     Nonrecourse debt  

Beginning balance

   $ (9,438,791    $ (215    $ (5,325    $ (1,592,592

Total gain or losses included in earnings

     (545,758      147        1,804        (112,794

Purchases, settlements and transfers


Purchases and additions, net

     (1,310,343      —          (1,673      (2,343,618

Sales and settlements

     1,974,683        —          894        558,808  


Ending balance

   $ (9,320,209    $ (68    $ (4,300    $ (3,490,196


F-65


Table of Contents

Finance of America Equity Capital LLC and Subsidiaries

Notes to Consolidated Financial Statements


Fair Value Option

Presented in the tables below are the fair value and UPB at December 31, 2020 and December 31, 2019, of assets and liabilities for which the Company has elected the fair value option (in thousands):


December 31, 2020   Estimated Fair
Value
    Unpaid Principal
Balance
 

Assets at fair value under the fair value option


Reverse mortgage loans held for investment, subject to HMBS related obligations

  $ 9,929,163       9,045,104  

Mortgage loans held for investment, subject to nonrecourse debt:


Reverse mortgage loans

    5,057,624       4,457,805  

Commercial mortgage loans

    338,543       333,344  

Mortgage loans held for investment:


Reverse mortgage loans

    661,790       589,429  

Commercial mortgage loans

    69,031       69,127  

Mortgage loans held for sale:


Residential mortgage loans

    2,080,585       2,000,795  

Commercial mortgage loans

    142,226       140,693  

Liabilities at fair value under the fair value option


HMBS related obligations

    9,788,668       9,045,104  

Nonrecourse debt

    5,257,754       5,155,017  

Nonrecourse MSR financing liability

    14,088       14,088  


December 31, 2019   Estimated Fair
Value
    Unpaid Principal
Balance
 

Assets at fair value under the fair value option


Reverse mortgage loans held for investment, subject to HMBS related obligations

  $ 9,480,504     $ 8,685,134  

Mortgage loans held for investment, subject to nonrecourse debt:


Reverse mortgage loans

    3,067,970       2,773,017  

Commercial mortgage loans

    443,242       429,269  

Mortgage loans held for investment:


Reverse mortgage loans

    1,083,586       1,004,739  

Commercial mortgage loans

    319,117       308,170  

Agricultural loans

    11,370       11,370  

Mortgage loans held for sale:


Residential mortgage loans

    1,086,744       1,058,493  

Reverse mortgage loans

    66,421       66,890  

Commercial mortgage loans

    98,409       96,631  

Debt securities:


Mortgage backed securities

    102,110       101,786  

Liabilities at fair value under the fair value option


HMBS related obligations

  $ 9,320,209     $ 8,685,134  

Nonrecourse debt

    3,490,196       3,494,686  


F-66


Table of Contents

Finance of America Equity Capital LLC and Subsidiaries

Notes to Consolidated Financial Statements


Net Fair Value Gains on Mortgage Loans and Related Obligations

Provided in the table below is a summary of the components of net fair value gains on mortgage loans and related obligations (in thousands):


     For the year ended December 31,  
     2020      2019      2018  

Net fair value gains (losses) on mortgage loans and related obligations:


Interest income on mortgage loans

   $ 709,679      $ 749,240      $ 568,378  

Change in fair value of mortgage loans

     294,238        272,709        219,076  

Change in fair value of mortgage backed securities

     2,438        (153      —    


Net fair value gains on mortgage loans

     1,006,355        1,021,796        787,454  


Interest expense on related obligations

     (526,690      (527,646      (441,421

Change in fair value of derivatives

     (12,482      (15,068      (3,120

Change in fair value of related obligations

     (155,484      (149,556      (32,049


Net fair value losses on related obligations

     (694,656      (692,270      (476,590


Net fair value gains on mortgage loans and related obligations

   $ 311,699      $ 329,526      $ 310,864  


As the cash flows on the underlying mortgage loans will be utilized to settle the outstanding obligations, the Company’s own credit risk would not impact the fair value on the outstanding HMBS liabilities and nonrecourse debt.

Fair Value of Other Financial Instruments

As of December 31, 2020 and December 31, 2019, all financial instruments were either recorded at fair value or the carrying value approximated fair value. For financial instruments that were not recorded at fair value, such as cash and cash equivalents including restricted cash, servicer advances and other financing lines of credit, the carrying value approximates fair value due to the short-term nature of such instruments.


F-67


Table of Contents

Finance of America Equity Capital LLC and Subsidiaries

Notes to Consolidated Financial Statements


6.

Reverse Mortgages Portfolio Composition

The table below summarizes the Company’s serviced reverse mortgage portfolio composition and the remaining UPBs of the reverse mortgage loan portfolio (in thousands):


     December 31,  
     2020      2019  

Reverse mortgage loans:


Reverse mortgage loans held for investment, subject to HMBS related obligations

   $ 9,045,104      $ 8,685,134  

Reverse mortgage loans held for investment:


Non-agency reverse mortgages

     215,688        674,507  

Loans not securitized(1)

     168,292        152,928  

Unpoolable loans(2)

     197,395        166,742  

Unpoolable tails

     8,054        10,562  


Total reverse mortgage loans held for investment

     589,429        1,004,739  

Reverse mortgage loans held for sale:


Performing HECM buyouts

     —          66,890  


Total reverse mortgage loans held for sale

     —          66,890  

Reverse mortgage loans held for investment, subject to nonrecourse debt:


Performing HECM buyouts

     141,691        192,602  

Nonperforming HECM buyouts

     538,768        426,576  

Non-agency reverse mortgages

     3,777,346        2,153,839  


Total reverse mortgage loans held for investment, subject to nonrecourse debt

     4,457,805        2,773,017  


Total owned reverse mortgage portfolio

     14,092,338        12,529,780  

Loans reclassified as government guaranteed receivable

     49,255        78,788  

Loans serviced for others

     123,324        340,534  


Total reverse mortgage loans serviced

   $ 14,264,917      $ 12,949,102  


(1)

Loans not securitized represent primarily newly originated loans.

(2) 

Unpoolable loans represent primarily loans that have reached 98% of their MCA.


F-68


Table of Contents

Finance of America Equity Capital LLC and Subsidiaries

Notes to Consolidated Financial Statements


The table below summarizes the owned reverse mortgage portfolio by product type (in thousands):


     December 31,  
     2020      2019  

Fixed rate loans

   $ 5,010,659      $ 4,708,098  

Adjustable rate loans

     9,081,679        7,821,682  


Total owned reverse mortgage portfolio

   $ 14,092,338      $ 12,529,780  


7.

Reverse Mortgage Loans Held for Investment, Subject to HMBS Related Obligations, at Fair Value

Reverse mortgage loans held for investment, subject to HMBS related obligations, at fair value, consisted of the following for the dates indicated (in thousands):


     December 31,  
     2020      2019  

Reverse mortgage loans held for investment, subject to HMBS related obligations - UPB

   $ 9,045,104      $ 8,685,134  

Fair value adjustments

     884,059        795,370  


Total reverse mortgage loans held for investment, subject to HMBS related obligations, at fair value

   $ 9,929,163      $ 9,480,504  


8.

Mortgage Loans Held for Investment, Subject to Nonrecourse Debt, at Fair Value

Mortgage loans held for investment, subject to nonrecourse debt, at fair value, consisted of the following for the dates indicated (in thousands):


     December 31,  
     2020      2019  

Mortgage loans held for investment, subject to nonrecourse debt - UPB:


Reverse mortgage loans

   $ 4,457,805      $ 2,773,017  

Commercial mortgage loans

     333,344        429,269  

Fair value adjustments

     605,018        308,926  


Total mortgage loans held for investment, subject to nonrecourse debt, at fair value

   $ 5,396,167      $ 3,511,212  


F-69


Table of Contents

Finance of America Equity Capital LLC and Subsidiaries

Notes to Consolidated Financial Statements


The table below shows the total amount of mortgage loans held for investment, subject to nonrecourse debt that were greater than 90 days past due and on non-accrual status (in thousands):


     December 31,  
Loans 90 Days or More Past Due and on Non-Accrual Status    2020      2019  

Fair value:


Commercial mortgage loans

     32,377        9,069  


Total fair value

     32,377        9,069  


Aggregate UPB:


Commercial mortgage loans

     33,888        8,823  


Total aggregate UPB

     33,888        8,823  


Difference

   $ (1,511 )     $ 246  


9.

Mortgage Loans Held for Investment, at Fair Value

Mortgage loans held for investment, at fair value, consisted of the following for the dates indicated (in thousands):


     December 31,  
     2020      2019  

Mortgage loans held for investment - UPB:


Reverse mortgage loans

   $ 589,429      $ 1,004,739  

Commercial mortgage loans

     69,127        308,170  

Residential mortgage loans

     —          11,370  

Fair value adjustments

     72,265        89,794  


Total mortgage loans held for investment, at fair value

   $ 730,821      $ 1,414,073  


10.

Mortgage Loans Held for Sale, at Fair Value

Mortgage loans held for sale, at fair value, consisted of the following for the dates indicated (in thousands):


     December 31,  
     2020      2019  

Mortgage loans held for sale - UPB:


Residential mortgage loans

   $ 2,000,795      $ 1,058,493  

Reverse mortgage loans

     —          66,890  

Commercial mortgage loans

     140,693        96,631  

Fair value adjustments

     81,323        29,560  


Total mortgage loans held for sale, at fair value

   $ 2,222,811      $ 1,251,574  


F-70


Table of Contents

Finance of America Equity Capital LLC and Subsidiaries

Notes to Consolidated Financial Statements


The table below shows the total amount of mortgage loans held for sale that were greater than 90 days past due and on non-accrual status (in thousands):


     December 31,  
Loans 90 Days or More Past Due and on Non-Accrual Status    2020      2019  

Fair value:


Residential mortgage loans

   $ (2,608    $ (2,499

Commercial mortgage loans

     (5,051      (21,007


Total fair value

     (7,659      (23,506


Aggregate UPB:


Residential mortgage loans

     13,236        3,018  

Commercial mortgage loans

     5,317        20,871  


Total aggregate UPB

     18,553        23,889  


Difference

   $ 10,894      $ 383  


The Company originates or purchases and sells mortgage loans in the secondary mortgage market without recourse for credit losses. However, the Company at times maintains continuing involvement with the loans in the form of servicing arrangements and the liability under representations and warranties it makes to purchasers and insurers of the loans.

The following table summarizes cash flows between the Company and transferees as a result of the sale of mortgage loans in transactions where the Company maintains continuing involvement with the mortgage loans (in thousands):


     For the year ended December 31,  
     2020      2019      2018  

Cash flows:


Sales proceeds

   $ 21,410,022      $ 461,956      $ 154,665  

Fair value of retained beneficial interest(1)

     161,201        3,775        1,481  

Gross servicing fees received

     18,526        1,679        4,833  

Repurchases

     (3,679      (2,457      (19,122

Gain

     940,234        20,445        14,567  


(1) 

Fair value of retained beneficial interest includes retained servicing rights and other beneficial interests retained as of the balance sheet date.


11.

Mortgage Servicing Rights, at Fair Value

The servicing portfolio associated with capitalized servicing rights consists of the following (in thousands):


     December 31,  
     2020     2019  

Fannie Mae/Freddie Mac

   $ 20,501,504     $ 129,322  

Ginnie Mae

     1,727,831       104,527  

Private investors

     40,027       54,208  


Total UPB

   $ 22,269,362     $ 288,057  


Weighted average interest rate

     3.1     4.4


F-71


Table of Contents

Finance of America Equity Capital LLC and Subsidiaries

Notes to Consolidated Financial Statements


The activity in the loan servicing portfolio associated with capitalized servicing rights consisted of (in thousands):


     For the year ended December 31,  
     2020      2019  

Beginning balance

   $ 288,057      $ 283,229  

Originated MSR

     21,241,997        379,171  

Purchased MSR

     1,966,657        —    

Payoffs, sales and curtailments

     (1,227,349      (374,343


Total UPB

   $ 22,269,362      $ 288,057  


The activity in the mortgage servicing rights asset consisted of the following (in thousands):


     For the year ended December 31,  
     2020      2019      2018  

Beginning balance

   $ 2,600      $ 3,376      $ 17,747  

Originations

     159,434        3,702        1,066  

Purchases

     14,088        —          —    

Sale of servicing rights

     —          (3,121      (17,167

Changes in fair value due to:


Changes in market inputs or assumptions used in valuation model

     14,817        (328      3,635  

Changes in fair value due to portfolio runoff and other

     (10,255      (1,029      (1,905


Ending balance

   $ 180,684      $ 2,600      $ 3,376  


The value of MSRs is driven by the net positive cash flows associated with servicing activities. The cash flows include contractually specified servicing fees, late fees, and other ancillary servicing revenue. The fees were $18.1 million, $0.8 million, and $2.9 million for the years ended December 31, 2020, 2019 and 2018, respectively. These fees are recorded within fee income on the Consolidated Statements of Operations and Comprehensive Income. The following table provides a summary of non-performing loans:


     December 31, 2020     December 31, 2019  
     Number of
Loans
    Unpaid
Balance
    Number of
Loans
    Unpaid
Balance
 

Portfolio delinquency (1)


30 days

     0.5     0.5     3.8     3.7

60 days

     0.1     0.1     0.9     0.9

90 or more days

     0.2     0.1     1.6     1.9


Total

     0.8     0.7     6.3     6.5


Foreclosure/real estate owned

     0.0     0.0     1.5     1.4


(1) 

Represents the loan servicing portfolio delinquencies as a percentage of the total number of loans and the total unpaid balance of the portfolio.


F-72


Table of Contents

Finance of America Equity Capital LLC and Subsidiaries

Notes to Consolidated Financial Statements


12.

Derivatives and Risk Management Activities

The Company’s principal market exposure is to interest rate risk, specifically long-term U.S. Treasury and mortgage interest rates, due to their impact on mortgage-related assets and commitments. The Company is also subject to changes in short-term interest rates, such as LIBOR, due to their impact on certain variable rate asset-backed debt such as warehouse lines of credit. Various financial instruments are used to manage and reduce this risk, including forward delivery commitments on mortgage-backed securities or whole loans and interest rate swaps.

The Company did not have any derivative instruments designated as hedging instruments or subject to master netting and collateral agreements as of and for the years ended December 31, 2020, 2019 and 2018.

The following tables summarize the amounts recorded in derivative assets and payables and other liabilities related to derivative liabilities in the Consolidated Statements of Financial Condition for the periods indicated (in thousands):


     December 31, 2020  
     Derivative assets     Derivative liabilities  
     Fair
Value
     Notional
Amount
     Unrealized
gains
(losses)
    Fair
Value
     Notional
Amount
     Unrealized
gains
(losses)
 

Interest rate lock commitments

   $ 87,576      $ 2,897,479      $ 73,568     $ —        $ 13,822      $ 68  

Forward commitments and TBAs securities

     1,806        399,612        968       1,332        389,422        (1,248

Interest rate swaps and swap futures contracts

     2,683        1,386,400        2,324       755        744,500        (617

Forward MBS

     —          —          (348     18,635        3,187,000        (16,587


Net fair value of derivative financial instruments

   $ 92,065      $ 4,683,491      $ 76,512     $ 20,722      $ 4,334,744      $ (18,384


     December 31, 2019  
     Derivative assets      Derivative liabilities  
     Fair
Value
     Notional
Amount
     Unrealized
gains
     Fair
Value
     Notional
Amount
     Unrealized
gains
 

Interest rate lock commitments

   $ 14,008      $ 914,606      $ 3,457      $ 68      $ 20,630      $ 147  

Forward commitments and TBAs securities

     838        36,167        481        84        100,000        45  

Interest rate swaps and swap futures contracts

     359        43,500        35        138        185,600        291  

Forward MBS

     348        217,000        323        2,048        996,500        2,259  


Net fair value of derivative financial instruments

   $ 15,553      $ 1,211,273      $ 4,296      $ 2,338      $ 1,302,730      $ 2,742  


The Company is exposed to risk in the event of non-performance by counterparties in their derivative contracts. In general, the Company manages such risk by evaluating the financial position and creditworthiness of counterparties, monitoring the amount of exposure and/or dispersing the risk among multiple counterparties. While the Company does not presently have master netting arrangements with its derivative counterparties, it does either maintain or place cash as margin collateral with its clearing broker to the extent the relative value of its derivatives are above or below their initial strike price. The Company pledged initial deposits of $1.8 million


F-73


Table of Contents

Finance of America Equity Capital LLC and Subsidiaries

Notes to Consolidated Financial Statements


and $2.7 million as of December 31, 2020 and 2019, respectively. Additional deposits of $10.2 million were pledged as of December 31, 2020 as a result of changes in fair value of these derivatives subsequent to the trade date. Total margin collateral is included in other assets, net, in the Consolidated Statements of Financial Condition.


13.

Fixed Assets and Leasehold Improvements, Net

Fixed assets and leasehold improvements, net, consisted of the following (in thousands):


     December 31,         
     2020      2019      Estimated
Useful Life
 

Computer hardware and software

   $ 53,584      $ 44,538        3 - 5 years  

Furniture and fixtures

     5,039        4,698        5-7 years  

Leasehold improvements

     3,102        2,467        *  

Building under lease

     —          1,241        10 years  

Vehicles

     92        87        10 years  


Total fixed assets

     61,817        53,031     

Less: Accumulated depreciation

     (37,305      (26,345   


Total fixed assets and leasehold improvements, net

   $ 24,512      $ 26,686     


*

Shorter of life of lease or useful life of assets.

Depreciation expense was $11.3 million, $10.1 million, and $6.5 million for the years ended December 31, 2020, 2019, and 2018 respectively, which is included in general and administrative expenses in the Consolidated Statements of Operations and Comprehensive Income.


14.

Goodwill

During the annual qualitative assessment of goodwill for the year ended December 31, 2020, the Company determined that it is not more likely than not that the fair value of any reporting unit is less than their carrying amounts. For the year ended December 31, 2019, the Company determined that goodwill within one of the operating segments was impaired and recorded impairment expense of $0.4 million in general and administrative expenses in the Consolidated Statements of Operations and Comprehensive Income. The Company did not identify any impairment for the year ended December 31, 2018.

Goodwill consisted of the following (in thousands):


     December 31,  
     2020      2019  

Beginning balance

   $ 121,137      $ 119,275  

Additions from acquisitions

     96        2,284  

Impairment

     —          (422


Ending balance

   $ 121,233      $ 121,137  


The Company performs the annual goodwill impairment test as of October 1 and monitors for interim triggering events on an ongoing basis. Goodwill is reviewed for impairment utilizing either a qualitative assessment or a


F-74


Table of Contents

Finance of America Equity Capital LLC and Subsidiaries

Notes to Consolidated Financial Statements


quantitative goodwill impairment test. In connection with the review of our financial condition in light of the COVID-19 pandemic, management determined that one or more triggering events had occurred as a result of the effects the COVID-19 pandemic had on the national and global economy. As a result, the Company conducted a quantitative goodwill impairment test for its Commercial Originations and Portfolio Management reporting units as of June 30, 2020. Based upon management’s quantitative assessment of goodwill, the Company determined that the fair value of the reporting units continued to exceed the carrying value of the reporting units at June 30, 2020. In addition, the Company performed a qualitative assessment for all reporting units during the third quarter of 2020 and determined that it was more likely than not that no impairment of goodwill existed at December 31, 2020. During the year ended December 31, 2019, there was also no goodwill impairment recorded.

The amount of goodwill allocated to each reporting unit consisted of the following (in thousands):


     December 31,  
     2020      2019  

Reporting units:


Mortgage Originations

   $ 44,429      $ 44,429  

Commercial Originations

     43,113        43,113  

Lender Services

     25,247        25,151  

Portfolio Management

     8,444        8,444  


Total goodwill

   $ 121,233      $ 121,137  


F-75


Table of Contents

Finance of America Equity Capital LLC and Subsidiaries

Notes to Consolidated Financial Statements


15.

Intangible Assets, Net

Intangible assets, net, consisted of the following (in thousands):


December 31, 2020    Amortization
Period
(Years)
     Cost      Accumulated
Amortization
     Net  

Non-amortizing Intangibles


Domain name

     N/A      $ 5,422      $ —        $ 5,422  


Total non-amortizing intangibles

      $ 5,422      $ —        $ 5,422  


Amortizing Intangibles


Customer list

     5 - 12      $ 12,754      $ (5,100    $ 7,654  

Broker relationships

     10        7,627        (5,429      2,198  

Trade names

     5 - 20        2,495        (1,487      1,008  

Technology assets

     5        805        (156      649  


Total amortizing intangibles

      $ 23,681      $ (12,172    $ 11,509  


Total intangible assets, net

      $ 29,103      $ (12,172    $ 16,931  


December 31, 2019    Amortization
Period
(Years)
     Cost      Accumulated
Amortization
     Net  

Non-amortizing Intangibles


Domain name

     N/A      $ 5,422      $ —        $ 5,422  


Total non-amortizing intangibles

      $ 5,422      $ —        $ 5,422  


Amortizing Intangibles


Customer list

     5 - 12      $ 12,730      $ (3,843    $ 8,887  

Broker relationships

     10        7,717        (4,594      3,123  

Trade names

     5 - 20        2,386        (1,165      1,221  

Technology assets

     5        146        (56      90  


Total amortizing intangibles

      $ 22,979      $ (9,658    $ 13,321  


Total intangible assets, net

      $ 28,401      $ (9,658    $ 18,743  


Amortization expense was $2.5 million, $2.6 million and $3.1 million for the years ended December 31, 2020, 2019 and 2018, respectively.

The estimated amortization expense for each of the five succeeding fiscal years and thereafter as of December 31, 2020 is as follows (in thousands):


Year Ending December 31,

   Amount  

2021

   $ 2,478  

2022

     2,463  

2023

     1,638  

2024

     1,270  

2025

     999  

Thereafter

     2,661  


Total future amortization expense

   $ 11,509  


F-76


Table of Contents

Finance of America Equity Capital LLC and Subsidiaries

Notes to Consolidated Financial Statements


16.

Other Assets, Net

Other assets, net, consisted of the following (in thousands):


     December 31,  
     2020      2019  

Receivables, net of allowance of $788 and $795, respectively

   $ 67,011      $ 31,736  

ROU assets

     46,609        57,393  

Government guaranteed receivables, net

     46,481        75,080  

Loans subject to repurchase from GNMA

     42,148        5,663  

Investments, at fair value

     18,934        20,508  

Prepaid expenses

     17,536        10,173  

Deposits

     14,188        2,418  

Servicer advances, net of allowance of $1,661 and $1,299, respectively

     5,795        5,570  

Receivable from clearing organization

     2,043        1,018  

Other

     37,328        32,281  


Total other assets, net

   $ 298,073      $ 241,840  


As of December 31, 2020 and 2019, there were $380.3 million and $452.0 million, respectively, of foreclosure proceedings in process which are included in mortgage loans held for investment, at fair value, on the Consolidated Statements of Financial Condition.


17.

HMBS Related Obligations, at Fair Value

HMBS related obligations represent the issuance of pools of HMBS, which are guaranteed by GNMA, to third-party security holders. The Company accounts for the transfers of these advances in the related HECM loans as secured borrowings, retaining the initial HECM loans in its Consolidated Statements of Financial Condition as reverse mortgage loans held for investment, subject to HMBS related obligations, and recording the pooled HMBS as HMBS related obligations. Monthly cash flows generated from the HECM loans are used to service the outstanding HMBS.

HMBS related obligations, at fair value, consisted of the following as of December 31, 2020 and 2019 (in thousands):


     December 31,  
     2020     2019  

GNMA loan pools - UPB

   $ 9,045,104     $ 8,685,134  

Fair value adjustments

     743,564       635,075  


Total HMBS related obligations, at fair value

   $ 9,788,668     $ 9,320,209  


Weighted average remaining life

     4.5       3.4  

Weighted average interest rate

     3.0     4.4

The Company was servicing 1,693 and 1,573 GNMA loan pools at December 31, 2020 and 2019, respectively.


F-77


Table of Contents

Finance of America Equity Capital LLC and Subsidiaries

Notes to Consolidated Financial Statements


18.

Nonrecourse Debt, at Fair Value

Nonrecourse debt, at fair value, consisted of the following for the dates indicated (in thousands):


    Issue Date     Class of
Note
    Final Maturity
Date
    Interest
Rate
    Original
Issue
Amount
    December 31,  
    2020     2019  

Securitization of nonperforming HECM loans:


2020 FASST HB2

    July 2020      

A, M1,
M2, M3,
M4, M5


    July 2030       1.71% - 7.75   $ 594,171     $ 476,147     $ —    

2020 FASST HB1

    February 2020      

A, M1,
M2, M3,
M4, M5


    February 2030       2.0% - 6.0     373,912       298,883       —    

2019 FASST HB1

    April 2019      

A, M1,
M2, M3,
M4, M5


    April 2029       3.3% - 6.0     309,015       —         237,013  

2018 FASST HB1

    October 2018      

A, M1,
M2, M3,
M4, M5


    September 2028       2.3     399,031       —         223,147  

Securitization of performing HECM loans:


2019 FAHB 19-1

    December 2019      

A, M1,
M2, M3,
AM1, AM2


    December 2049       2.7% - 4.0     267,146       —         254,425  

Securitization of proprietary jumbo reverse loans:


2019 FASST JR2

    June 2019       A, A2       June 2069       2.0     499,000       440,141       469,828  

2018 FASST JR1

    May 2018       A       May 2068       4.3     559,197       428,671       501,145  

2019 FASST JR3

    September 2019       A       September 2069       2.0     450,104       404,057       428,335  

2020 FASST JR3

    August 2020       A, A2       August 2025       2.0% - 3.0     360,713       337,099       —    

2019 FASST JR4

    November 2019       A       November 2069       2.0     365,685       335,945       347,126  

2019 FASST JR1

    March 2019       A       March 2069       2.0     347,000       309,840       326,894  

2020 FASST S2

    June 2020       A1, A2       March 2025       2.0     320,460       299,401       —    

2020 FASST S3

    December 2020       A1, A2       December 2025       1.5% - 2.5     313,357       297,871       —    

2020 FASST JR2

    May 2020      
A1A, A1B,
A2
 
 
    May 2025       0.0% - 2.0     305,658       291,827       —    

2018 FASST JR2

    December 2018       A       December 2068       4.5     280,400       253,325       269,601  

2020 FASST JR1

    April 2020       A, A2       April 2023       2.0     254,805       240,563       —    

2020 FASST JR4

    October 2020       A, A2       August 2025       2.0% - 3.0     241,664       217,385       —    

2020 FASST S1

    March 2020       A1, A2       March 2025       2.0% - 3.7     199,000       181,059       —    

Securitization of Fix & Flip loans:


2020 RTL1 ANTLR

    May 2020       A1, A2      
May 2022 (A1,
A2)
 
 
    6.9% - 8.0     306,517       140,072       —    

2019 RTL1 ANTLR

    March 2019      
A1, A2,
A-VFN, M


June 2022
(A1, A2);
January
2023 (M)


    4.5% - 6.9     217,100       121,772       206,243  

2018 RTL1 ANTLR

    September 2018      
A1, A2,
A-VFN, M


July 2022
(A1, A2);
March 2023
(M)


    4.3% - 7.4     210,296       80,949       210,296  


Total nonrecourse debt


      5,155,007       3,474,053  

Fair value adjustments


      102,747       16,143  


Total nonrecourse debt, at fair value


    $ 5,257,754     $ 3,490,196  


F-78


Table of Contents

Finance of America Equity Capital LLC and Subsidiaries

Notes to Consolidated Financial Statements


19.

Other Financing Lines of Credit

Mortgage facilities

These facilities are generally structured as master repurchase agreements under which ownership of the related eligible loans is temporarily transferred to a lender or as participation arrangements pursuant to which the lender acquires a participation interest in the related eligible loans. The funds advanced are generally repaid using the proceeds from the sale or securitization of the loans to or pursuant to programs sponsored by FNMA, FHLMC, and GNMA or to private secondary market investors, although prior payment may be required based on, among other things, certain breaches of representations and warranties or other events of default.

When these facilities are drawn on, the Company generally must transfer and pledge eligible loans to the lender, and comply with various financial and other covenants. The facilities expire at various times during 2021. Under the facilities, loans are generally transferred at an advance rate less than the principal balance or fair value of the loans, which serves as the primary credit enhancement for the lender. One of the warehouse lines of credit is also guaranteed by FAH, a wholly-owned subsidiary and the parent holding company to the mortgage business. Since the advances are generally for less than 100% of the principal balance of the loans, working capital is required to fund the remaining portion of the principal balance of the loans. The amount of the advance that is provided under the various facilities ranges from 94% to 100% of the market value or principal balance of the loans. Upon expiration, management believes it will either renew its existing warehouse facilities or obtain sufficient additional lines of credit.

Reverse mortgage facilities

These facilities are generally structured as master repurchase agreements under which ownership of the related eligible loans is temporarily transferred to a lender or as participation arrangements pursuant to which the lender acquires a participation interest in the related eligible loans. The funds advanced are generally repaid using the proceeds from the sale or securitization of the loans to or pursuant to programs sponsored by GNMA or private secondary market investors, although prior payment may be required based on, among other things, certain breaches of representations and warranties or other events of default.

When the warehouse lines of credit are drawn on, the Company generally must transfer and pledge eligible loans, and comply with various financial and other covenants. The facilities expire at various times during 2021 and 2022. Under the facilities, loans are transferred at an advance rate less than the principal balance or fair value of the loans, which serves as the primary credit enhancement for the lender. Since the advances are generally for less than 100% of the principal balance of the loans, working capital is required to fund the remaining portion of the principal balance of the loan. The amount of the advance that is provided under the various facilities ranges from 90 to 100% of the market value or principal balance of the loans. Upon expiration, management believes it will either renew its existing facilities or obtain sufficient additional lines of credit.

Commercial loan facilities

These facilities are either structured as master repurchase agreements under which ownership of the related eligible loans is temporarily transferred to a lender or are collateralized by first lien loans or crop loans. The funds advanced are generally repaid using the proceeds from the sale or securitization of the loans to private secondary market investors, although prior payment may be required based on, among other things, certain breaches of representations and warranties or other events of default.


F-79


Table of Contents

Finance of America Equity Capital LLC and Subsidiaries

Notes to Consolidated Financial Statements


When these facilities are drawn on, the Company must transfer and pledge eligible loan collateral, and comply with various financial and other covenants. The facilities expire at various times during 2021. Under the facilities, loans are transferred at an advance rate less than the principal balance or fair value of the loans, which serves as the primary credit enhancement for the lender. Two of the warehouse lines of credit are guaranteed, one fully and one limited, by FAH, a wholly-owned subsidiary and the parent holding company to the commercial lending business. Since the advances are generally for less than 100% of the principal balance of the loans, working capital is required to fund the remaining portion of the principal balance of the loans. The amount of the advance that is provided under the various facilities generally ranges from 70 to 85% of the principal balance of the loans. Upon expiration, management believes it will either renew its existing facilities or obtain sufficient additional lines of credit.


                            Outstanding Borrowings at
December 31,
 

Facility

  Maturity
Date
    Interest Rate     Collateral
Pledged
    Total
Capacity(1)
    2020     2019  

Mortgage Lines:


March 2021 $350M Facility(2)

    March 2021      
LIBOR + applicable
margin


First Lien
Mortgages
 
 
  $ 350,000     $ 302,877     $ 250,745  

April 2021 $350M Facility

    April 2021      
LIBOR + applicable
margin


First Lien
Mortgages
 
 
    350,000       283,821       —    

May 2021 $250M Facility

    May 2021      
LIBOR + applicable
margin


First Lien
Mortgages
 
 
    250,000       225,837       156,629  

March 2021 $200M Facility(2)

    March 2021      
LIBOR + applicable
margin


First Lien
Mortgages
 
 
    200,000       182,015       123,855  

October 2021 $250M Facility

    October 2021      
LIBOR + applicable
margin


First Lien
Mortgages
 
 
    250,000       170,174       846  

January 2021 $250M Facility(2)

    January 2021      
LIBOR + applicable
margin


First Lien
Mortgages
 
 
    250,000       158,114       164,729  

March 2021 $225M Facility(2)

    March 2021      
LIBOR + applicable
margin


First Lien
Mortgages
 
 
    225,000       154,097       33,814  

August 2021 $200M Facility

    August 2021      
LIBOR + applicable
margin


First Lien
Mortgages
 
 
    200,000       126,047       121,525  

July 2021 $150M Facility

    July 2021      
LIBOR + applicable
margin


First Lien
Mortgages
 
 
    150,000       122,075       —    

November 2021 $150M Facility

    November 2021      
LIBOR + applicable
margin


First Lien
Mortgages
 
 
    150,000       109,463       103,993  

March 2021 $125M Facility(2)

    March 2021      
LIBOR + applicable
margin


First Lien
Mortgages
 
 
    125,000       97,225       82,683  

February 2021 $50M Facility - MSR(2)

    February 2021      

Prime + applicable
margin; 5.00%
floor


    MSRs       50,000       50,000       407  

August 2021 $300M Facility

    August 2021      
LIBOR + applicable
margin


First Lien
Mortgages
 
 
    300,000       15,719       —    

February 2021 $10M Facility - LOC(3)

    February 2021      

Prime + applicable
margin; 5.00%
floor


    N/A       —         —         10,000  


Subtotal mortgage lines of credit


      $ 2,850,000     $ 1,997,464     $ 1,049,226  


F-80


Table of Contents

Finance of America Equity Capital LLC and Subsidiaries

Notes to Consolidated Financial Statements


                            Outstanding Borrowings at
December 31,
 

Facility

  Maturity
Date
    Interest Rate     Collateral
Pledged
    Total
Capacity(1)
          2020                 2019        

Reverse Lines:


$200M Repo Facility

    N/A      
Bond accrual rate +
applicable margin


Mortgage
Related
Assets


  $ 200,000     $ 174,578     $ 82,793  

April 2021 $250M Facility

   
April
2021


LIBOR + applicable
margin


First Lien
Mortgages
 
 
    250,000       173,484       196,054  

April 2021 $200M Facility

   
April
2021


LIBOR + applicable
margin


First Lien
Mortgages
 
 
    200,000       128,723       136,084  

October 2021 $400M Facility

   
October
2021


LIBOR + applicable
margin


First Lien
Mortgages
 
 
    400,000       84,124       288,175  

December 2021 $100M Facility

   
December
2021


LIBOR + applicable
margin


First Lien
Mortgages
 
 
    100,000       61,220       —    

April 2022 $52.5M Facility

   
April
2022


LIBOR + applicable
margin


Mortgage
Related
Assets


    52,500       50,239       30,212  

April 2021 $50M Facility

   
April
2021


Prime + applicable
margin; 6.00%
floor


Unsecuritized
Tails
 
 
    50,000       37,442       38,256  

April 2022 $45M Facility(2)

   
April
2022
 
 
    9.00%      

Mortgage
Related
Assets


    45,000       26,875       80,000  

January 2021 $200M Facility(2)

   
January
2021


LIBOR + applicable
margin


First Lien
Mortgages
 
 
    200,000       15,803       129,123  

June 2021 $75M Facility

    June 2021      
LIBOR + applicable
margin


First Lien
Mortgages
 
 
    75,000       11,423       74,420  

August 2021 $50M Facility

   
August
2021


LIBOR + applicable
margin


First Lien
Mortgages
 
 
    50,000       2,860       540  

$1.2M Repo Facility

    N/A      
LIBOR + applicable
margin


Mortgage
Related
Assets


    1,188       1,188       5,953  

October 2020 $75M Facility(3)

   
October
2020


LIBOR + applicable
margin


First Lien
Mortgages
 
 
    —         —         74,979  

September 2020 $114.6M Facility(3)

   
September
2020


Bond accrual rate +
applicable margin


Mortgage
Related
Assets


    —         —         96,084  

February 2020 $50M Facility(3)

   
February
2020


LIBOR + applicable
margin


First Lien
Mortgages
 
 
    —         —         2,923  

May 2020 $20M Facility(3)

    May 2020       11.00%      

Mortgage
Related
Assets


    —         —         11,500  


Subtotal reverse lines of credit


      $ 1,623,688     $ 767,959     $ 1,247,096  


F-81


Table of Contents

Finance of America Equity Capital LLC and Subsidiaries

Notes to Consolidated Financial Statements


                            Outstanding Borrowings at
December 31,
 

Facility

  Maturity
Date
    Interest Rate     Collateral
Pledged
    Total
Capacity(1)
    2020     2019  

Commercial Lines:


April 2021 $145M Facility

   
April
2021


LIBOR + applicable
margin


First Lien
Mortgages
 
 
  $ 145,000     $ 100,070     $ 123,050  

September 2021 $150M Facility

   
September
2021


LIBOR + applicable
margin


Encumbered
Agricultural
Loans


    150,000       52,300       —    

November 2021 $50M Facility

   
November
2021


LIBOR + applicable
margin


First Lien
Mortgages
 
 
    50,000       28,064       17,399  

August 2021 $45M Facility

   
August
2021
 
 
    10.00%      
Second Lien
Mortgages
 
 
    45,000       21,475       38,397  

$6.4M Securities Repo Line

    N/A      
Distributed Bond
Interest + 50 bps


Mortgage
Related Assets
 
 
    6,411       6,411       10,857  

February 2021 $150M Facility(2)

   
February
2021


LIBOR + applicable
margin


First Lien
Mortgages
 
 
    —         —         151,840  

January 2021 $150M Facility(2)

   
January
2021


LIBOR + applicable
margin


First Lien
Mortgages
 
 
    150,000       —         60,007  

May 2021 $18.6M Facility

    May 2021       12.00%      
Second Lien
Mortgages
 
 
    18,623       —         —    

Securities Repo Line $12.8M

    N/A      
LIBOR + applicable
margin


Mortgage
Related Assets
 
 
    —         —         13,924  


Subtotal commercial lines of credit


    $ 565,034     $ 208,320     $ 415,474  


Incenter Lines:


FHLB Line

    N/A       0.29% - 3.11%       Bank bond     $ —       $ —       $ 2,616  


Subtotal Incenter lines


    $ —       $ —       $ 2,616  


Revolving Working Capital Lines:            

June 2020 $20M Facility(3)

    June 2020      

LIBOR + applicable
margin; 6.00%
floor


Unencumbered
Assets
 
 
  $  —       $  —       $  20,000  

June 2020 $24M Line(3)

    June 2020       10.00%      
Tangible
Assets
 
 
    —         —         10,185  

June 2020 $11M Line(3)

    June 2020       10.00%      
Tangible
Assets
 
 
    —         —         4,815  


Subtotal revolving working capital lines of credit


    $ —       $ —       $ 35,000  


Total other financing lines of credit


    $ 5,038,722     $ 2,973,743     $ 2,749,412  


(1) 

Capacity is dependent upon maintaining compliance with, or obtaining waivers of, the terms, conditions and covenants of the respective agreements, including asset-eligibility requirements. Capacity amounts presented are as of December 31, 2020.


F-82


Table of Contents

Finance of America Equity Capital LLC and Subsidiaries

Notes to Consolidated Financial Statements


(2) 

See Note 39 - Subsequent Events for additional information on facility amendments.

(3) 

Financing facility matured during the year ended December 31, 2020 and was not renewed.

As of December 31, 2020 and 2019, the weighted average outstanding interest rates on outstanding debt of the Company were 3.15% and 4.65%, respectively.

The Company’s borrowing arrangements and credit facilities contain various financial covenants which primarily relate to required tangible net worth amounts, liquidity reserves, leverage requirements, and profitability requirements. As a result of market disruptions and fair value accounting adjustments taken in March 2020 resulting from the COVID-19 pandemic, FACo was in violation of its first, second, and third quarter 2020 profitability covenants with two of its warehouse lenders. The Company received waivers of these covenants violations from both lenders as well as amendments to profitability covenants for the remaining quarter of 2020. As of December 31, 2020, the Company was in compliance with its financial covenants.

The terms of the Company’s financing arrangements and credit facilities contain covenants, and the terms of the Company’s GSE/seller servicer contracts contain requirements that may restrict the Company and its subsidiaries from paying distributions to its members. These restrictions include restrictions on paying distributions, whenever the payment of such distributions would cause FoA to no longer be in compliance with any of its financial covenants or GSE requirements. Further, the Company is generally prohibited under Delaware law from making a distribution to a member to the extent that, at the time of the distribution, after giving effect to the distribution, liabilities of the Company (with certain exceptions) exceed the fair value of its assets. Subsidiaries of the Company are generally subject to similar legal limitations on their ability to make distributions to FoA.

As of December 31, 2020, the maximum allowable distributions available to the Company based on the most restrictive of such financial covenant ratios is presented in the table below (in thousands, except for ratios):


Financial Covenants

   Requirement      December 31, 2020      Maximum Allowable
Distribution (1)
 

FAM


Adjusted Tangible Net Worth

   $ 125,000      $ 289,163      $ 164,163  

Liquidity

     40,000        56,775        16,775  

Leverage Ratio

     15:1        9:3:1        110,267  

Material Decline in Lender Adjusted Net Worth:


Lender Adjusted Tangible Net Worth (Quarterly requirement)

   $ 210,428      $ 282,062      $ 71,634  

Lender Adjusted Tangible Net Worth (Two-Consecutive Quarterly requirement)

     93,763        282,062        188,299  

FACo


Adjusted Tangible Net Worth

   $ 85,000      $ 126,672      $ 41,672  

Liquidity

     20,000        46,385        26,385  

Leverage Ratio

     6:1        1:7:1        90,782  


F-83


Table of Contents

Finance of America Equity Capital LLC and Subsidiaries

Notes to Consolidated Financial Statements


Financial Covenants

   Requirement      December 31, 2020      Maximum Allowable
Distribution (1)
 

FAR


Adjusted Tangible Net Worth

   $ 300,000      $ 474,128      $ 174,128  

Liquidity

     20,000        36,425        16,425  

Leverage Ratio

     5:5:1        2:5:1        258,615  

Material Decline in Lender Adjusted Net Worth:


Lender Adjusted Tangible Net Worth (Quarterly requirement)

   $ 314,091      $ 472,458      $ 158,367  

Lender Adjusted Tangible Net Worth (Two-Consecutive Quarterly requirement)

     205,619        472,458        266,839  


(1)

The Maximum Allowable Distribution for any of the originations subsidiaries is the lowest of the amounts shown for the particular originations subsidiary.

As of December 31, 2019, the maximum allowable distributions available to the Company based on the most restrictive of such financial covenant ratios is presented in the table below (in thousands, except for ratios):


Financial Covenants

   Minimum
Requirement
     December 31, 2019      Maximum Allowable
Distribution (1)
 

FAM


Adjusted Tangible Net Worth

   $ 70,000      $ 76,110      $ 6,110  

Liquidity

     25,000        31,560        6,560  

Leverage Ratio

     15:1        14.7:1        1,776  

Material Decline in Lender Adjusted Net Worth:


Lender Adjusted Tangible Net Worth (Quarterly requirement)

   $ 78,405      $ 92,132      $ 13,727  

Lender Adjusted Tangible Net Worth (Two-Consecutive Quarterly requirement)

     55,028        92,132        37,104  

FACo


Adjusted Tangible Net Worth

   $ 85,000      $ 91,960      $ 6,960  

Liquidity

     20,000        22,000        2,000  

Leverage Ratio

     6:1        4.6:1        21,457  


F-84


Table of Contents

Finance of America Equity Capital LLC and Subsidiaries

Notes to Consolidated Financial Statements


Financial Covenants

   Minimum
Requirement
     December 31, 2019      Maximum Allowable
Distribution (1)
 

FAR


Adjusted Tangible Net Worth

   $ 257,000      $ 395,850      $ 138,850  

Liquidity

     20,000        43,830        23,830  

Leverage Ratio

     10:1        4.0:1        206,322  

Material Decline in Lender Adjusted Net Worth:


Lender Adjusted Tangible Net Worth (Quarterly requirement)

   $ 248,124      $ 379,970      $ 131,846  

Lender Adjusted Tangible Net Worth (Two-Consecutive Quarterly requirement)

     203,583        379,970        176,387  


(1) 

The Maximum Allowable Distribution for any of the originations subsidiaries is the lowest of the amounts shown for the particular originations subsidiary.


20.

Payables and Other Liabilities

Payables and other liabilities consisted of the following (in thousands):


     December 31,  
     2020      2019  

Accrued compensation expense

   $ 150,214      $ 49,244  

Accrued liabilities

     82,779        88,248  

Lease liabilities

     48,250        61,215  

Liability for loans eligible for repurchase from GNMA

     42,148        5,663  

GNMA reverse mortgage buy-out payable

     32,317        79,091  

Derivative liabilities

     20,722        2,338  

Nonrecourse MSR financing liability, at fair value

     14,088        —    

Repurchase reserves

     10,529        3,118  

Estimate of claim losses

     8,609        5,762  

Deferred purchase price liabilities

     3,842        4,300  

Due to investors

     648        27,197  


Total payables and other liabilities

   $ 414,146      $ 326,176  


21.

Leases

The Company’s lease portfolio is comprised primarily of real estate and equipment agreements. Operating leases in which the Company is the lessee are recorded as operating lease ROU assets and operating lease liabilities, included in other assets, net, and payables and other liabilities, respectively, on the Consolidated Statements of Financial Condition, as of December 31, 2020. The Company does not currently have any finance leases in


F-85


Table of Contents

Finance of America Equity Capital LLC and Subsidiaries

Notes to Consolidated Financial Statements


which it is the lessee. Operating lease ROU assets represent the Company’s right to use an underlying asset during the lease term and operating lease liabilities represent the Company’s obligation to make lease payments arising from the lease.

For operating leases, the lease liabilities are initially recognized based on the present value of the remaining lease payments using a discount rate that represents the Company’s incremental borrowing rate at the lease commencement date. As most of the Company’s leases do not provide an implicit rate, the Company uses its incremental borrowing rate based on the information available at the lease commencement date in determining the present value of the lease payments. This incremental borrowing rate is the rate of interest that the Company would have to pay to borrow on a collateralized basis over a similar term an amount equal to the lease payments in a similar economic environment and given similar credit risk. The lease term for all of the Company’s leases includes the noncancellable period of the lease plus any additional periods covered by either a Company option to extend (or not to terminate) the lease. The Company includes these options in the lease term when it is reasonably certain of exercising them.

ROU assets are further adjusted for lease incentives. Operating lease expense is recognized on a straight-line basis over the lease term and is recorded in general and administrative expenses in the Consolidated Statements of Operations and Comprehensive Income. The Company recognizes variable lease payments associated with the Company’s leases when the variability is resolved. Variable lease payments are recorded in general and administrative expenses in the Consolidated Statements of Operations and Comprehensive Income along with expenses arising from fixed lease payments.

Rent expense for the year ended December 31, 2018 was $34.3 million.

The table below summarizes the Company’s operating lease portfolio (in thousands):


     December 31,  
     2020     2019  

Right-of-use assets

   $ 46,609     $ 60,055  

Lease liabilities

     48,250       61,215  

Weighted-average remaining lease term

     3.61 years       3.87 years  

Weighted-average discount rate

     7.42     7.27

The table below summarizes the Company’s net operating lease cost (in thousands):    


     December 31,  
     2020      2019  

Operating lease cost

   $ 21,734      $ 25,577  

Short-term lease cost

     5,167        4,062  


Total operating and short term lease cost

     26,901        29,639  


Variable lease cost

     3,734        1,581  

Sublease income

     (2,769      (1,685


Net lease cost

   $ 27,866      $ 29,535  


F-86


Table of Contents

Finance of America Equity Capital LLC and Subsidiaries

Notes to Consolidated Financial Statements


The table below summarizes other information related to the Company’s operating leases (in thousands):


     December 31,  
     2020      2019  

Cash paid for amounts included in the measurement of lease liabilities:


Operating cash flows from operating leases

   $ 24,042      $ 23,877  

Leased assets obtained in exchange for new operating lease liabilities

     7,271        11,111  

The following table presents a maturity analysis of the Company’s operating leases and a reconciliation of the undiscounted cash flows to the lease liabilities as of December 31, 2020:


Year Ending December 31, 2020


2021

   $ 19,601  

2022

     13,931  

2023

     9,237  

2024

     6,372  

2025

     3,465  

Thereafter

     2,406  


Total undiscounted lease payments

     55,012  

Less: Imputed interest

     (6,762


Total lease liabilities

   $ 48,250  


22.

Repurchase Reserves    

The activity of the outstanding repurchase reserves was as follows (in thousands):    


     December 31,  
     2020      2019  

Repurchase reserves, beginning of period

   $ 3,118      $ 3,161  

Additions

     24,186        5,435  

Charge-offs

     (16,775      (5,478)  


Repurchase reserves, end of period

   $ 10,529      $ 3,118  


23.

Notes Payable

In November 2020, FOAF issued $350.0 million aggregate principal amount of senior unsecured notes (the “Notes”). Interest is payable semi-annually in arrears on May 15 and November 15 beginning on May 15, 2021. The Notes are fully and unconditionally guaranteed, jointly and severally, on a senior unsecured basis by FoA and each of FoA’s material existing and future wholly-owned domestic subsidiaries, excluding FOAF and subsidiaries.

At any time prior to November 15, 2022, FOAF may redeem some or all of the Notes at a redemption price equal to 100% of the principal amount thereof, plus the applicable premium as of the redemption date under the terms of the indenture and accrued and unpaid interest. The redemption price during each of the twelve-month periods


F-87


Table of Contents

Finance of America Equity Capital LLC and Subsidiaries

Notes to Consolidated Financial Statements


following November 15, 2022, November 15, 2023 and at any time after November 15, 2024 is 103.938%, 101.969% and 100.000%, respectively, of the principal amount plus accrued and unpaid interest thereon. At any time prior to November 15, 2022, FOAF may also redeem up to 40% of the aggregate principal amount of the notes at a redemption price equal to 107.875% of the aggregate principal amount of the senior unsecured notes redeemed, with an amount equal to or less than the net cash proceeds from certain equity offerings, plus accrued and unpaid interest.

Upon the occurrence of a change of control, the holders of the Notes will have the right to require FOAF to make an offer to repurchase each holder’s Notes at a price equal to 101% of their principal amount, plus accrued and unpaid interest.

The Notes contain covenants limiting, among other things, FOAF and its restricted subsidiaries’ ability to incur additional debt or issue certain preferred shares, incur liens, make certain distributions, investments and other restricted payments, engage in certain transactions with affiliates, and merge or consolidate or sell, transfer, lease or otherwise dispose of all or substantially all of FOAF’s assets. These incurrence based covenants are subject to exceptions and qualifications. Many of these covenants will cease to apply during any time that the Notes have investment grade ratings and no default has occurred and continuing. The Company was in compliance with all required covenants related to the Notes as of December 31, 2020.

As a part of the Company’s acquisitions of certain subsidiaries, the Company entered into note agreements with the sellers. In addition, in 2017, the Company entered into an agreement for the purchase of computer hardware and equipment which was financed by notes payable to the seller with monthly payments through January 2021.

A summary of the outstanding notes payable is presented in the table below (in thousands):


                December 31,  

Description

   Maturity Date    Interest Rate     2020      2019  

Senior Unsecured Notes

   November 2025      7.875   $ 350,000      $ —    

Financing Agreement

   January 2021      5.5     9        542  

Seller Note 1

   May 2020      5.0     —          5,950  

Seller Note 2

   May 2020      5.0     —          4,050  

Seller Note

   June 2020      5.5     —          16,771  


Total aggregate principle amount

          350,009        27,313  

Less: Debt issuance costs

          (13,436      —    


Total notes payable

        $ 336,573      $ 27,313  


The interest expense on the notes was $4.3 million, $1.5 million, and $1.5 million for the years ended December 31, 2020, 2019, and 2018, respectively.


24.

Estimate of Claim Losses

The Company is occasionally named as a defendant in claims concerning title insurance policies, closing protection letters, and alleged errors or omissions pertaining to the issuance of title policies or the performance of escrow services. The Company assesses pending and threatened claims to determine whether losses are probable and reasonably estimable in accordance with ASC 450, Contingencies. To the extent losses are deemed to meet the probable and estimable criteria, the Company will establish an accrual for those losses based on historical experience and analysis of specific claim attributes.


F-88


Table of Contents

Finance of America Equity Capital LLC and Subsidiaries

Notes to Consolidated Financial Statements


The activity related to the outstanding estimate of claim losses consisted of the following (in thousands):


     December 31,  
     2020      2019  

Beginning balance

   $ 5,762      $ 5,051  

Provision charged to income from operations

     3,520        1,417  

Estimate of claim losses payments

     (673      (706


Ending balance

   $ 8,609      $ 5,762  


Activity in the liability for loss and loss adjustment expense of the Company’s insurance subsidiary consisted of the following (in thousands):


     December 31,  
     2020      2019  

Beginning balance, net of reinsurance recoverable of $99 as of January 1, 2020 and 2019

   $ 4,487      $ 4,050  

Incurred related to:


Current year

     3,238        1,376  

Prior years

     (931      (509


Total incurred

     2,307        867  

Paid related to:


Current year

     55        19  

Prior years, net of reinsurance and other receivables of $99 as of December 31, 2020 and 2019

     405        411  


Total paid

     460        430  


Ending balance, net of reinsurance recoverable of $99 as of December 31, 2020 and 2019

   $ 6,334      $ 4,487  


A known claim reserve is an amount estimated by the Company to be sufficient to cover all unpaid losses, claims, and allocated loss adjustment expenses arising under title insurance policies for which the Company may be liable, and for which they have discovered or received notice by or on behalf of the insured or escrow or security depositor.

The Company’s insurance subsidiary has paid cumulative gross loss and loss adjustment expenses of $7.5 million, $7.1 million, $6.7 million and have recovered $0.2 million from ceded reinsured losses for the years ended December 31, 2020, 2019, and 2018, respectively. No unsecured aggregate recoverable for losses, paid and unpaid, loss adjustment expenses, and unearned premiums existed at December 31, 2020, 2019, 2018 or respectively.


F-89


Table of Contents

Finance of America Equity Capital LLC and Subsidiaries

Notes to Consolidated Financial Statements


The effects of reinsurance on premiums written by the Company’s insurance subsidiary consisted of the following (in thousands):


     December 31,  
     2020      2019  

Title premiums written:


Direct

   $ 63,826      $     17,607  

Ceded

     (509      (323


Net title premiums written

   $     63,317      $ 17,284  


25.

Litigation

The Company’s business is subject to legal proceedings, examinations, investigations and reviews by various federal, state and local regulatory and enforcement agencies as well as private litigants such as the Company’s borrowers or former employees. At any point in time the Company may have open investigations with regulators or enforcement agencies, including examinations and inquiries related to its loan servicing and origination practices. These matters and other pending or potential future investigations, examinations, inquiries or lawsuits may lead to administrative or legal proceedings, and possibly result in remedies, including fines, penalties, restitution, or alterations in business practices, and in additional expenses and collateral costs.

As a litigation or regulatory matter develops, the Company, in conjunction with any outside counsel handling the matter, evaluates on an ongoing basis whether such matter presents a loss contingency that is probable and estimable. If, at the time of evaluation, the loss contingency is not both probable and reasonably estimable, the matter will continue to be monitored for further developments that would make such loss contingency both probable and reasonably estimable. Once the matter is deemed to be both probable and reasonably estimable, the Company will establish an accrued liability and record a corresponding amount to litigation related expense. The Company will continue to monitor the matter for further developments that could affect the amount of the accrued liability that has been previously established. Legal expenses, which includes, among other things, settlements and the fees paid to external legal service providers, of $19.5 million, $9.0 million and $8.2 million for the years ended December 31, 2020, 2019 and 2018, respectively, were included in general and administrative expenses in the Consolidated Statements of Operations and Comprehensive Income.

For certain matters, the Company may consider a loss to be probable or reasonably possible but cannot provide a precise estimate of losses. For these matters, the Company may be able to estimate a range of possible loss. In determining whether it is possible to provide an estimate of loss or range of possible loss, the Company reviews and evaluates its material litigation and regulatory matters on an ongoing basis, in conjunction with any outside counsel handling the matter. As of December 31, 2020, there were no matters that the Company considered to be probable or reasonably possible for which they could provide a reasonable range of estimated losses.

On March 29, 2019, the Company’s operating subsidiary, Finance of America Mortgage LLC (“FAM”) entered into an agreement (“Settlement Agreement”) with the California Department of Business Oversight (“DBO”) to resolve certain accusations filed by the DBO in August 2018 (“DBO’s Accusation”). The DBO’s Accusation alleges that FAM incurred repeat findings in 2012 and 2016 supervisory examinations regarding per diem interest charges and escrow trust account reconciliations. FAM agreed to conduct two separate audits pursuant to the Settlement Agreement. FAM is not aware of any outstanding requirements or concerns related to the completed self-audit or the independent third-party auditor review. All refunds and penalties as a result of the Settlement Agreement were timely remitted in 2020 and 2019.


F-90


Table of Contents

Finance of America Equity Capital LLC and Subsidiaries

Notes to Consolidated Financial Statements


On March 31, 2020, FAR executed a settlement agreement with the U.S. Department of Justice (“DOJ”) and a settlement agreement with HUD in which FAR agreed to make a payment of $2.0 million to the DOJ and $0.5 million to HUD to cover loans containing a controversial Appraisal Order Form that set forth a loan amount alleged to have been in violation of FHA requirements. The form in question was in use during 2008 to 2009 and ceased to be used in 2010. FAR made no admission of liability or fault, but chose to resolve the matter rather than engage in potentially time-consuming and costly litigation. All payments as a result of this agreement were timely remitted in 2020.


26.

Commitments and Contingencies

Servicing of Mortgage Loans

Sub-Servicing

The Company has contracted with third-party providers to perform specified servicing functions on its behalf. These services include maintaining borrower contact, facilitating borrower advances, generating borrower statements, and facilitating loss-mitigation strategies in an attempt to keep defaulted borrowers in their homes. Defaults on reverse mortgages leading to foreclosures may occur if borrowers fail to meet maintenance obligations, such as payment of taxes or home insurance premiums. When a default cannot be cured, the sub-servicers manage the foreclosure process and the filing of any insurance claims with HUD. The sub-servicers have responsibility for remitting timely advances and statements to borrowers and timely and accurate claims to HUD, including compliance with local, state and federal regulatory requirements.

Additionally, the sub-servicers are also responsible for remitting payments to investors, including interest accrued and interest shortfalls and funding advances such as taxes and home insurance premiums. Advances are typically remitted by the Company to the sub-servicers on a daily basis. Although the Company has outsourced its servicing function, as the issuer the Company has responsibility for all aspects of servicing of the HECM loans and related HMBS beneficial interests under the terms of the servicing contracts, state laws and regulations.

Contractual sub-servicing fees related to sub-servicer arrangements are generally based on a fixed dollar amount per loan and are included in general and administrative expenses in the Consolidated Statements of Operations and Comprehensive Income.

Unfunded Commitments

The Company is required to fund further borrower advances (where the borrower has not fully drawn down the HECM or fix & flip loan proceeds available to them), and to additionally fund the payment of the borrower’s obligation to pay the FHA their monthly insurance premium.

The outstanding unfunded commitments available to borrowers related to HECM loans were approximately $2.1 billion as of December 31, 2020. The outstanding unfunded commitments available to borrowers related to fix & flop loans were approximately $19.8 million as of December 31, 2020. This additional borrowing capacity is primarily in the form of undrawn lines of credit.

The Company also has commitments to purchase and sell loans totaling $10.2 million and $54.3 million, respectively, at December 31, 2020.


F-91


Table of Contents

Finance of America Equity Capital LLC and Subsidiaries

Notes to Consolidated Financial Statements


Mandatory Repurchase Obligation

The Company is required to repurchase reverse loans out of the GNMA securitization pools once the outstanding principal balance of the related HECM is equal to or greater than 98% of the MCA. Performing repurchased loans are conveyed to HUD and nonperforming repurchased loans are generally liquidated in accordance with program requirements. Loans are considered nonperforming upon events such as, but not limited to, the death of the mortgagor, the mortgagor no longer occupying the property as their principal residence, or the property taxes or insurance not being paid.

As an issuer of HMBS, the Company also has the option to repurchase reverse loans out of the GNMA securitization pools without GNMA prior approval in certain instances. These situations include the borrower requesting an additional advance that causes the outstanding principal balance to be equal or greater than 98% of the MCA; the borrower’s loan becoming due and payable under certain circumstances; the borrower not occupying the home for greater than twelve consecutive months for physical or mental illness and the home is not the residence of another borrower; or the borrower failing to perform in accordance with the terms of the loan.

For each HECM loan that the Company securitizes into Agency HMBS, the Company is required to covenant and warrant to GNMA, among other things, that the HECM loans related to each participation included in the Agency HMBS are eligible under the requirements of the National Housing Act and the GNMA Mortgage-backed Securities Guide, and that the Company will take all actions necessary to ensure the HECM loan’s continued eligibility. The GNMA HMBS program requires that the Company removes the participation related to any HECM loan that does not meet the requirements of the GNMA Mortgage-backed Securities Guide. In addition to securitizing HECM loans into Agency HMBS, the Company may sell HECM loans to third parties and the agreements with such third parties include standard representations and warranties related to such loans, which if breached, may require the Company to repurchase the HECM loan and/or indemnify the purchaser for losses related to such HECM loans. In the case where the Company repurchases the loan, the Company bears any subsequent credit loss on the loan. To the extent that the Company is required to remove a loan from an Agency HMBS, purchase a loan from a third party or indemnify a third party, the potential losses suffered by the Company may be reduced by any recourse the Company has to the originating broker and/or correspondent lender, if applicable, to the extent such entity breached similar or other representations and warranties. Under most circumstances, the Company has the right to require the originating broker/correspondent to repurchase the related loan from the Company and/or indemnify the Company for losses incurred. The Company seeks to manage the risk of repurchase and associated credit exposure through the Company’s underwriting and quality assurance practices.

See Note 21 - Leases for a listing of the Company’s current lease obligations under ASC 842 and Note 25 -Litigation for information regarding current litigation matters.


27.

Long-Term Incentive Plan

The Company participates in UFG’s sponsored long-term incentive plan (the “LTIP”) to compensate key employees. Any distributions are based on distributions received by equity holders of the Company in excess of the contributed equity capital, plus a designated return on contributed equity capital (the “Hurdle”).

Payments to holders of the issued phantom stock units (“Phantom Units”) will be made from eligible distributions in excess of the Hurdle and will be paid over three years. Rights to future Phantom Unit payments are generally forfeited upon termination by an employee.


F-92


Table of Contents

Finance of America Equity Capital LLC and Subsidiaries

Notes to Consolidated Financial Statements


A total of 1,250 Phantom Units were approved under the LTIP, with 1,074 and 858 units issued and outstanding as of December 31, 2020 and 2019, respectively. As of December 31, 2020 and 2019, no triggering events for an eligible distribution had occurred and the Phantom Units have no measurable intrinsic value. No accrued liability or compensation expense have been recorded in the consolidated financial statements as of or for the years ended December 31, 2020, 2019 and 2018.


28.

Shareholders’ Notes Receivable

Certain officers of the Company have purchased equity units using a combination of cash and the issuance of shareholder notes receivable. These have been reflected as members’ contributions, net of the unpaid notes receivable balances, in the Consolidated Statements of Changes in Members’ Equity. There were no units purchased through the issuance of notes receivable for the year ended December 31, 2020. For the years ended December 31, 2019 and 2018, a total of $14.7 million and $11.3 million in equity units had been purchased through the issuance of notes receivable.

The related equity units are legally issued to the officers, however, to the extent that the notes receivable are determined to be nonrecourse, the Company accounts for the transaction as a grant of an option award, in accordance with ASC 718, Compensation-Stock Compensation. On the transaction date of issuance, the Company records a charge to compensation expense for the fair value of the “option” as determined using a Black-Scholes option-pricing model. The full amount of the fair value of the option is recognized as compensation expense on the date of the transaction given that there is no requirement for future service. For the year ended December 31, 2020, no compensation expense was recorded as no additional equity units were issued. The Company recorded $2.4 million and $0.5 million of compensation expense for the year ended December 31, 2019 and 2018, respectively, which is included in salaries, benefits and related expenses in the Consolidated Statements of Operations and Comprehensive Income.

The weighted-average assumptions used in the Black-Scholes option pricing model were as follows:


     For the year ended December 31,  
     2019     2018  

Expected volatility

     30.9     38.1

Risk-free interest rate

     2.5     2.8

Expected term

     4.0       4.0  


29.

Changes in Contingently Redeemable Noncontrolling Interest

The Company has determined that the Class B interests of FACo Holdings issued to Buy to Rent Platform Holdings, L.P. (“B2R”) meet the definition of CRNCI. Under the FACo Holdings Agreement, the Class B Units may be redeemed upon sale of FACo by FACo Holdings, sale of FAH, or sale of UFG Holdings LLC, which would require FAH to purchase the outstanding Class B Units. The Company has determined that the legal provisions in the FACo Holdings Agreement in which there is a noncontrolling interest represent a substantive profit-sharing arrangement, where the allocation to the members differs from the stated ownership percentages. The Company utilizes the hypothetical liquidation at book value, or HLBV, method for the allocation of profits and losses each period. Under the HLBV method, the amounts of income and loss attributed to the noncontrolling interests in the Consolidated Statements of Operations and Comprehensive Income reflects changes in the amounts each member would hypothetically receive at each Statement of Financial Condition date under the liquidation provisions of the FACo Holdings Agreement, assuming the net assets of the FACo Holdings were liquidated at their respective recorded amounts. Allocations of profits and losses in the Consolidated Statements


F-93


Table of Contents

Finance of America Equity Capital LLC and Subsidiaries

Notes to Consolidated Financial Statements


of Operations and Comprehensive Income is determined based on the hypothetical amounts that would be distributed to members after taking into account any capital transactions between FACo Holdings and its members as follows:


Distributions up to Hurdle Amount of $202.0 million (subject to certain adjustments defined in the FACo Holdings Agreement) - 100% to Class B Members


Distributions of the next $150.0 million - 95% to Class A Members and 5% to Class B Members, and


Thereafter - 75% to Class A Members and 25% to Class B Members

The changes in CRNCI are as follows (in thousands):


     December 31,  
     2020      2019      2018  

Balance, beginning of period

   $ 187,981      $ 166,274      $ 151,030  

Net (loss) income

     (21,750      21,707        15,244  


Balance, end of period

   $ 166,231      $ 187,981      $ 166,274  


30.

Fee Income

Fee income consisted of the following (in thousands):


     For the year ended December 31,  
     2020      2019      2018  

Service fee income

   $ 192,281      $ 76,366      $ 44,885  

Loan origination fees

     151,700        104,538        75,576  

Loan servicing fees, net

     31,153        14,646        15,126  

Capital markets advisory fee income

     6,245        4,223        12,813  

Change in fair value of mortgage servicing rights

     4,562        (1,357      1,730  

Other fee income

     811        3,212        1,472  


Total fee income

   $ 386,752      $ 201,628      $ 151,602  


F-94


Table of Contents

Finance of America Equity Capital LLC and Subsidiaries

Notes to Consolidated Financial Statements


31.

General and Administrative Expenses

General and administrative expenses consisted of the following (in thousands):


     For the year ended December 31,  
     2020      2019      2018  

Professional fees

   $ 72,874      $ 26,860      $ 23,409  

Title and closing

     64,252        26,217        14,065  

Loan origination expenses

     60,980        43,928        21,569  

Loan portfolio expenses

     43,599        34,096        23,801  

Business development

     37,456        27,177        30,057  

Communications and data processing

     34,254        26,227        29,859  

Securitization expenses

     31,216        12,850        21,478  

Depreciation and amortization

     13,871        13,108        9,582  

Office expense

     10,309        8,959        10,497  

Travel and entertainment

     9,733        12,575        14,034  

Licensing and insurance

     6,321        6,542        7,634  

Other expenses

     14,020        15,875        12,326  


Total general and administrative expenses

   $ 398,885      $ 254,414      $ 218,311  


32.

Income Taxes

Provision for income taxes consists of the following (in thousands):


     For the year ended December 31,  
     2020      2019      2018  

Current expense:


Federal

   $ 2,197      $ 860      $ 168  

State

     378        185        136  


Subtotal

     2,575        1,045        304  


Deferred expense (benefit):


Federal

   $ 22      $ (79    $ (45

State

     (253      (17      27  


Subtotal

     (231      (96      (18


Net provision for income taxes

   $ 2,344      $ 949      $ 286  


Deferred income taxes reflect the net tax effects of temporary differences between the carrying value of assets and liabilities for financial reporting purposes and the amounts reported for income tax purposes.


F-95


Table of Contents

Finance of America Equity Capital LLC and Subsidiaries

Notes to Consolidated Financial Statements


Significant components of the Company’s deferred income tax assets (liabilities) are as follows (in thousands):


     December 31,  
     2020      2019  

Deferred tax assets


Loss carryforwards

   $ 483      $ 278  

Research and development tax credits

     —          477  

Capital lease amortization

     438        508  

Payroll and employee benefits

     121        104  

Estimate of claim losses

     142        104  

Other

     25        —    


Total deferred tax assets

     1,209        1,471  


Deferred tax liabilities


Depreciation and amortization

     843        881  

Loss reserves

     186        126  

Other

     307        —    


Total deferred tax liabilities

     1,336        1,007  


Valuation allowance

     (160      (675


Net deferred tax liability

   $ (287    $ (211


The federal and state net operating loss (“NOL”) carryforwards amount to approximately $2.9 million and $2.8 million at December 31, 2020 and 2019, respectively. It is expected that these NOL’s will begin to expire in 2036, if unused.

In assessing the realizability of deferred tax assets, management considers whether it is more likely than not that some portion or all of the deferred tax assets will not be realized. The ultimate realization of deferred tax assets is dependent upon the generation of future taxable income during the period in which those temporary differences become deductible. Management considers the scheduled reversal of deferred tax liabilities, projected future taxable income, and tax planning strategies in making this assessment. Deferred tax liabilities are included in payables and other liabilities in the Consolidated Statements of Financial Condition.

The Company had no uncertain tax positions for the year ended December 31, 2020. The Company had uncertain tax positions of approximately $0.6 million for the years ended December 31, 2019 and 2018, for which the deductibility is uncertain or for which there was uncertainty regarding the timing of such deductibility.


F-96


Table of Contents

Finance of America Equity Capital LLC and Subsidiaries

Notes to Consolidated Financial Statements


Income tax expense differs from the amounts computed by applying the U.S. federal corporate tax rate of 21% as follows for the years indicated (dollars in thousands):


     For the year ended December 31,  
     2020     2019     2018  

Tax expense at federal statutory rate

   $ 105,054       21.0   $ 16,292       21.0   $ 9,982       21.0

Effect of:


Benefit of flowthrough entities

     (103,819     (20.8 )%      (13,933     (18.0 )%      (9,391     (19.8 )% 

Permanent differences

     540       0.1     (356     (0.4 )%      81       0.2

Timing differences


State taxes

     (367     (0.1 )%      230       0.3     116       0.2

Other tax adjustments

     936       0.3     (1,284     (1.7 )%      (502     (1.0 )% 


Net provision for income taxes

   $ 2,344       0.5   $ 949       1.2   $ 286       0.6


33.

Defined Contribution Plan

The Company participates in UFG’s sponsored qualified defined contribution plan (“the Plan”) and matches certain employee contributions on a discretionary basis. The Company’s expense for matching contributions to the Plan was $10.3 million, $7.0 million and $6.9 million for the years ended December 31, 2020, 2019 and 2018, respectively, which is included in salaries, benefits and related expenses in the Consolidated Statements of Operations and Comprehensive Income.


34.

Business Segment Reporting

The Company has identified six reportable segments: Portfolio Management, Mortgage Originations, Reverse Originations, Commercial Originations, Lender Services and Corporate/Other.

Portfolio Management

The Portfolio Management segment provides product development, loan securitization, loan sales, risk management, asset management and servicing oversight services to the enterprise and third-party funds.

Mortgage Originations

The Mortgage Originations segment originates mortgage loans through FAM. This segment generates revenue through fee-based mortgage loan origination services and the origination and sale of mortgage loans into the secondary market. The Mortgage Originations segment includes three channels: distributed retail lending, direct-to-consumer lending, and third-party-originator lending.

Reverse Originations

The Reverse Originations segment originates or acquires reverse mortgage loans through FAR. This segment originates HECMs which are insured by the FHA, and proprietary jumbo reverse mortgages. The segment originates reverse mortgage loans through the following channels: retail and third-party-originator. Reverse mortgage lending activities primarily consist of the origination and securitization of mortgage loans to GNMA and other private investors.


F-97


Table of Contents

Finance of America Equity Capital LLC and Subsidiaries

Notes to Consolidated Financial Statements


Commercial Originations

The Commerical Originations segment originates or acquires commercial mortgage loans through FACo. The segment provides business purpose lending solutions for residential real estate investors in two principal ways: short-term loans to provide rehab and construction of investment properties meant to be sold upon completion, and investor rental loans collateralized by either a single asset or portfolio of properties. The segment originates commercial mortgage loans through the following channels: retail and third-party-originator. Commercial mortgage lending activities primarily consist of the origination and securitization of commercial mortgages to private investors.

Lender Services

The Lender Services segment provides ancillary business services, title agency and title insurance services, MSR valuation and trade brokerage, and appraisal management services to customers in the residential mortgage, student lending, and commercial lending industries. The segment also operates a foreign branch in the Philippines for fulfillment transactional and administrative support.

Corporate and Other

Corporate and other consists of the Business Excellence Office (“BXO”) and other corporate services groups.

The Company’s segments are based upon the Company’s organizational structure which focuses primarily on the services offered. Corporate functional expenses are allocated to individual segments based on actual cost of services performed based on a direct resource utilization, estimate of percentage use for shared services or headcount percentage for certain functions. Non-allocated corporate expenses include administrative costs of executive management and other corporate functions that are not directly attributable to the Company’s operating segments. Revenues generated on inter-segment services performed are valued based on similar services provided to external parties. To reconcile the Company’s consolidated results, certain inter-segment revenues and expenses are eliminated in the “Eliminations” column in the following tables.

The following tables are a presentation of financial information by segment for the periods indicated (in thousands):


    For the year ended December 31, 2020  
    Mortgage
Originations
    Reverse
Originations
    Commercial
Originations
    Portfolio
Management
    Lender
Services
    Operating
Segments
    Corporate
and Other
    Elim     Total  

REVENUES


Gain on sale of loans, net

  $ 1,171,368     $ —       $ —       $ 10,192     $ —       $ 1,181,560     $ —       $ (2,565   $ 1,178,995  

Net fair value gains

    —         192,257       13,350       103,872       —         309,479       —         2,219       311,698  

Fee income

    118,237       1,837       23,862       28,002       205,197       377,135       —         9,617       386,752  

Net interest expense

    1,896       —         —         (73,163     (81     (71,348     (8,937     (132     (80,417


Total revenues

    1,291,501       194,094       37,212       68,903       205,116       1,796,826       (8,937     9,139       1,797,028  

Total expenses

    831,563       87,219       41,341       90,854       185,361       1,236,338       51,294       9,139       1,296,771  


Net income (loss) before taxes

  $ 459,938     $ 106,875     $ (4,129   $ (21,951   $ 19,755     $ 560,488     $ (60,231   $ —       $ 500,257  


Depreciation and amortization

  $ 5,951     $ 897     $ 568     $ 130     $ 4,810     $ 12,356     $ 1,515     $ —       $ 13,871  

Total assets

  $ 2,362,159     $ 25,841     $ 82,436     $ 16,895,820     $ 117,254     $ 19,483,510     $ 81,645     $ —       $ 19,565,155  


F-98


Table of Contents

Finance of America Equity Capital LLC and Subsidiaries

Notes to Consolidated Financial Statements


    For the year ended December 31, 2019  
    Mortgage
Originations
    Reverse
Originations
    Commercial
Originations
    Portfolio
Management
    Lender
Services
    Operating
Segments
    Corporate
and Other
    Elim     Total  

REVENUES


Gain on sale of loans, net

  $ 462,700     $ —       $ —       $ 9,303     $ —       $ 472,003     $ —       $ (7,695   $ 464,308  

Net fair value gains

    —         141,022       30,512       151,679       —         323,213       —         6,313       329,526  

Fee income

    64,372       3,478       36,094       7,923       110,046       221,913       —         (20,285     201,628  

Net interest expense

    (403     —         —         (95,694     30       (96,067     (5,144     (197     (101,408


Total revenues

    526,669       144,500       66,606       73,211       110,076       921,062       (5,144     (21,864     894,054  

Total expenses

    506,894       79,522       51,882       63,907       105,203       807,408       33,334       (24,267     816,475  


Net income (loss) before taxes

  $ 19,775     $ 64,978     $ 14,724     $ 9,304     $ 4,873     $ 113,654     $ (38,478   $ 2,403     $ 77,579  


Depreciation and amortization

  $ 5,954     $ 481     $ 616     $ 170     $ 4,169     $ 11,390     $ 1,718     $     $ 13,108  

Total assets

  $ 1,321,342     $ 91,892     $ 114,943     $ 15,102,567     $ 86,070     $ 16,716,814     $ 504,882     $ (637,595   $ 16,584,101  


    For the year ended December 31, 2018  
    Mortgage
Originations
    Reverse
Originations
    Commercial
Originations
    Portfolio
Management
    Lender
Services
    Operating
Segments
    Corporate
and Other
    Elim     Total  

REVENUES


Gain on sale of loans, net

  $ 397,648     $ —       $ —       $ 7,725     $ —       $ 405,373     $ —       $ (5,071   $ 400,302  

Net fair value gains

    —         148,925       22,981       135,182       —         307,088       —         3,776       310,864  

Fee income

    48,547       7,588       19,382       14,151       78,831       168,499       —         (16,897     151,602  

Net interest expense

    2,884       —         —         (74,037     (489     (71,642     (1,717     (147     (73,506


Total revenues

    449,079       156,513       42,363       83,021       78,342       809,318       (1,717     (18,339     789,262  

Total expenses

    481,381       68,802       35,753       52,089       79,181       717,206       43,157       (18,632     741,731  


Net income (loss) before taxes

  $ (32,302   $ 87,711     $ 6,610     $ 30,932     $ (839   $ 92,112     $ (44,874   $ 293     $ 47,531  


Depreciation and amortization

  $ 2,830     $ 947     $ 923     $ 282     $ 3,292     $ 8,274     $ 1,601     $ (293   $ 9,582  

Total assets

  $ 706,412     $ 76,199     $ 94,418     $ 12,856,289     $ 86,756     $ 13,820,074     $ 491,355     $ (585,321   $ 13,726,108  


F-99


Table of Contents

Finance of America Equity Capital LLC and Subsidiaries

Notes to Consolidated Financial Statements


35.

Liquidity and Capital Requirements

FAM

In addition to the covenant requirements of FAM mentioned in Note 19 - Other Financing Lines of Credit, FAM is subject to various regulatory capital requirements administered by HUD as a result of their mortgage origination and servicing activities. HUD governs non-supervised, direct endorsement mortgagees, and GNMA, FNMA and FHLMC, which sponsor programs that govern a significant portion of FAM’s mortgage loans sold and servicing activities. Additionally, FAM is required to maintain minimum net worth requirements for many of the states in which it sells and services loans. Each state has its own minimum net worth requirement; however, none of the state requirements are material to the Company’s Consolidated Financial Statements.

Failure to meet minimum capital requirements can result in certain mandatory and possibly additional discretionary remedial actions by regulators that, if undertaken, could: (i) remove FAM’s ability to sell and service loans to or on behalf of the Agencies; and (ii) have a direct material effect on FAM’s financial statements, results of operations and cash flows.

In accordance with the regulatory capital guidelines, FAM must meet specific quantitative measures of cash, assets, liabilities, profitability and certain off-balance sheet items calculated under regulatory accounting practices. Further, changes in regulatory and accounting standards, as well as the impact of future events on FAM’s results, may significantly affect the FAM’s net worth adequacy.

Among FAM’s various capital requirements related to its outstanding mortgage origination and servicing agreements, the most restrictive of these requires FAM to maintain a minimum adjusted net worth balance of $155.4 million as of December 31, 2020 and $77.6 million as of December 31, 2019. As of December 31, 2020 and 2019, FAM’s adjusted net worth was $289.2 million and $94.9 million, respectively. The Company was therefore in compliance with all net worth requirements.

In addition, FAM is required to maintain both fidelity bond and errors and omissions insurance coverage at tiered levels based on the aggregate UPB of the loans serviced by FAM throughout the year. FAM is required to conduct compliance testing at least quarterly to ensure compliance with the foregoing requirements. As of December 31, 2020, FAM was in compliance with applicable requirements.

FAR

As an issuer of HMBS, FAR is required by GNMA to maintain minimum net worth, liquidity and capitalization levels as well as minimum insurance levels.

The net worth required is $5.0 million plus 1% of FAR’s commitment authority from GNMA. The liquidity requirement is for 20% of FAR’s required net worth be in the form of cash or cash equivalent assets. FAR is required to maintain a ratio of 6% of net worth to total assets.

In addition, FAR is required to maintain both fidelity bond and errors and omissions insurance coverage at tiered levels based on the aggregate UPB of the loans serviced by FAR throughout the year. FAR is required to conduct compliance testing at least quarterly to ensure compliance with the foregoing requirements. As of December 31, 2020, FAR was in compliance with applicable requirements.

At December 31, 2020 and 2019, FAR was in compliance with the minimum net worth, liquidity and insurance requirements of GNMA and had received a permanent waiver for its capital requirement. The minimum tangible


F-100


Table of Contents

Finance of America Equity Capital LLC and Subsidiaries

Notes to Consolidated Financial Statements


net worth required of FAR by GNMA at December 31, 2020 and 2019 was $96.7 million and $92.8 million, respectively, and FAR’s actual net worth calculated based on GNMA guidance at December 31, 2020 and 2019 was $458.8 million and $382.5 million, respectively.

Incenter

Incenter Securities Group LLC (“ISG”), one of the operating subsidiaries of Incenter, operates in a highly regulated environment and is subject to federal and state laws, SEC rules and Financial Industry Regulatory Authority (“FINRA”) rules and guidance. Applicable laws and regulations, among other things, restrict permissible activities and require compliance with a wide range of financial and customer-related protections. The consequences of noncompliance can include substantial monetary and nonmonetary sanctions. In addition, ISG is subject to comprehensive examination by its regulators. These regulators have broad discretion to impose restrictions and limitations on the operations of the Company and to impose sanctions for noncompliance. ISG is subject to the SEC’s Uniform Net Capital Rule (SEC Rule 15c3-1) (“the Rule”), which requires the maintenance of minimum net capital. ISG computes net capital under the alternative method. Under this method, the required minimum net capital is equal to $0.3 million. At December 31, 2020, ISG had met the minimum net capital requirement amounts.

Additionally, ISG claims the exemption provision of SEC Rule 15c3-3(k)(2)(ii). ISG does not hold customer funds or safekeep customer securities. The Company introduces and clears its customers’ transactions through a third-party on a fully-disclosed basis.

Agents National Title Insurance Company, an operating subsidiary of Incenter, has additional capital requirements. The State of Missouri and State of Alabama require domestic title insurance underwriters maintain minimum capital and surplus of $1.6 million and $0.2 million, respectively. Failure to comply with these provision may result in various actions up to and including surrender of the certificate of authority. Additionally, in October 2019, Agents entered into a capital maintenance agreement in conjunction with the approval for the certificate of authority for California. This agreement requires Agents to maintain a minimum of $8.0 million in policyholder surplus. If Agents falls below this requirement in any given quarter, Incenter must contribute cash, cash equivalents securities or other instruments to bring Agents to compliance. The Company’s insurance company subsidiaries met the existing minimum statutory capital and surplus requirements as of December 31, 2020.

The Company is also required to maintain bonds, certificates of deposit and interest bearing accounts in accordance with applicable state regulatory requirements. The total requirement was $3.7 million and $3.4 million across all states as of December 31, 2020 and 2019, respectively. The Company was in compliance with these requirements as of December 31, 2020 and 2019.


36.

Concentrations of Risk

The Company’s activities are subject to significant risks and uncertainties, including the ability of management to adequately develop its service lines, acquire adequate customer and revenue bases, and overall market demand for its services. In addition, the Company engages in various trading and brokerage activities in which counterparties primarily include broker-dealers, banks and other financial institutions. In the event counterparties do not fulfill their obligations, the Company may be exposed to risk. The risk of default depends on the creditworthiness of the counterparty or issuer of the instrument. It is the Company’s policy to review, as necessary, the credit standing of each counterparty.


F-101


Table of Contents

Finance of America Equity Capital LLC and Subsidiaries

Notes to Consolidated Financial Statements


Financial instruments, which potentially subject the Company to credit risk, consist of cash and cash equivalents, derivatives, loans held for sale, and loans held for investment.

The Company invests its excess cash balances that may exceed federal insured limits with financial institutions evaluated as being creditworthy, primarily in money market accounts which are exposed to minimal interest rate and credit risk. The balances of these accounts are insured by the Federal Deposit Insurance Corporation, subject to certain limitations.

Credit risk is reduced by the Company’s underwriting standards, monitoring pledged collateral and other in-house monitoring procedures performed by management. The Company’s credit exposure for amounts due from investors and derivative related receivables is minimized since its policy is to sell mortgages only to highly reputable and financially sound financial institutions.

Mortgage loans are sold or financed through one of the following methods: (i) sales or financing securitizations to or pursuant to programs sponsored by FNMA, FHLMC, and GNMA, or (ii) sales or financing securitizations issued to private investors. The Company sold $27,229.1 million, $12,448.6 million, and $11,600.5 million in mortgage loans to FNMA, FHLMC and GNMA for the years ended December 31, 2020, 2019 and 2018, respectively. The Company sold to or securitized with private investors $5,855.2 million, $6,471.2 million, and $5,817.9 million in mortgage loans for the years ended December 31, 2020, 2019 and 2018, respectively. For the year ended December 31, 2020, the sales or financing securitizations issued to private investors consisted of 34.1% non-agency reverse mortgage loans, 16.1% nonperforming repurchased loans, 4.0% third-party financial institutions, 7.6% commercial mortgage loans and 38.2% other. For the year ended December 31, 2019, the sales or financing securitizations issued to private investors consisted of 23.1% non-agency reverse mortgage loans, 8.7% nonperforming repurchased loans, 13.0% third-party financial institutions, 5.7% commercial mortgage loans and 49.5% other. For the year ended December 31, 2018, the sales or securitizations to private investors consisted of 12.8% non-agency reverse mortgage loans, 6.9% nonperforming repurchased loans, 10.3% commercial mortgage loans, and 70.0% other.

Through FoA’s parent, the Company is owned by Libman Family Holdings, LLC, certain investment funds affiliated with Blackstone and other co-investors. In the ordinary course of conducting business, a portion of these mortgage loans sold or financed relate to certain commercial transactions that the Company enters into with a counterparty that is a non-affiliated company separately owned by certain other investment funds affiliated with Blackstone. The nature of its business interactions with this counterparty may allow the Company to negotiate preferential terms of commercial transactions that may not be available for other parties on an arm’s-length basis. These commercial transactions include the transfer of certain residential mortgage loans, in which the Company receives an ongoing service fee. The Company sold $168.7 million, $85.8 million, and $245.7 million in mortgage loans to non-affiliated Blackstone portfolio companies for the years ended December 31, 2020, 2019 and 2018, respectively. In addition, the Company is also contracted by certain non-affiliated Blackstone portfolio companies to provide sub-advisor services in areas such as asset management and administrative oversight, in which the Company receives an advisory fee. The Company has recognized gains on the sale of mortgages related to transactions with non-affiliated Blackstone portfolio companies of $7.9 million, $3.0 million, and $6.3 million for the years ended December 31, 2020, 2019 and 2018, respectively.

In May 2020, the Company entered into an uncommitted Master Repurchase Agreement with a non-affiliated company, separately owned by other investment funds affiliated with Blackstone, with no stated maturity with a financial institution, under which the Company may enter into transactions, for an aggregate amount of $18.6 million, in which the Company agrees to transfer to the non-affiliated company certain mortgage-backed securities against the transfer of funds by the non-affiliated company, with a simultaneous agreement by the


F-102


Table of Contents

Finance of America Equity Capital LLC and Subsidiaries

Notes to Consolidated Financial Statements


non-affiliated company to transfer such mortgage-backed securities to the Company at a certain date, or on demand, against the transfer of funds by the Company. As of December 31, 2020, the Company had no outstanding borrowings.

In May 2019 the Company entered into a $20.0 million financing agreement with a non-affiliated company, separately owned by other investment funds affiliated with Blackstone, secured by, among other things, eligible asset-backed securities, HECM tails and mezzanine securities backed by warehouse equity. This facility was structured as a master repurchase agreement. The funds advanced are generally repaid using the proceeds from the sale or securitization of the underlying assets or distribution from underlying securities, although prior payment may be required based on, among other things, certain breaches of representations and warranties or other events of default. As of December 31, 2019, the Company had outstanding borrowings of $11.5 million. The facility matured on June 30, 2020.

In July 2017, the Company entered into a $45.0 million mezzanine financing agreement with a non-affiliated company, separately owned by other investment funds affiliated with Blackstone, secured by a junior lien in mortgage assets pledged to certain senior secured warehouse facilities. This facility was structured as a loan and security agreement. The funds advanced are generally repaid using collections from the underlying assets to the extent remaining after the payment of any senior debt or the proceeds from the sale or securitization of the underlying assets or distribution from underlying securities, although prior payment may be required based on, among other things, certain breaches of representations and warranties or other events of default. As of December 31, 2020 and 2019, the Company had outstanding borrowings of $21.5 million and $38.4 million, respectively.

Residential Mortgages

The mortgaged properties securing the residential loans that we service are geographically dispersed throughout the United States. Certain states may experience future weakened economic conditions or greater rates of decline in real estate values than the United States in general. In addition, certain states may change their licensing or other regulatory requirement to make servicing loans in these states cost-prohibitive.

The table below provides the percentage of residential mortgage loans serviced by the location in which the home securing the loan is located and is based on the outstanding UPB. “Other” consists of loans in states in which concentration individually represents less than 5% of total remaining UPB.


     December 31,  
     2020     2019  

California

     37     14

Washington

     8       1  

Oregon

     7       2  

Arizona

     6       —    

New Jersey

     5       21  

Florida

     4       6  

Pennsylvania

     2       17  

Other

     31       39  


     100     100


F-103


Table of Contents

Finance of America Equity Capital LLC and Subsidiaries

Notes to Consolidated Financial Statements


Reverse Mortgages

FAR originates, buys and sells HECMs, commonly referred to as reverse mortgages, and securitizes and sells the HECMs as HMBS. FAR is subject to approval of, and is heavily regulated by, federal and state regulatory agencies as a mortgage lender, GNMA issuer, broker and servicer.

The secondary market for the FHA insured HECM loans is not assured; to the extent the program requires Congressional appropriations in future years, which are not forthcoming, the program could be jeopardized; and/or, consumer demand could be reduced if FHA actions result in a reduction of initial principal limit available to borrowers.

FAR depends on its ability to securitize reverse mortgages, subsequent draws, mortgage insurance premiums and servicing fees, and would be adversely affected if the ability to access the secondary market were to be limited.

Concentrations of credit risk associated with reverse mortgage loans are limited due to the large number of customers and their dispersion across many geographic areas. The table below provides the percentage of reverse loans in the Company’s Consolidated Statements of Financial Condition by the location in which the home securing the loan is located and is based on their remaining UPBs. “Other” consists of loans in states in which concentration individually represents less than 5% of total remaining UPB.


     December 31,  
     2020     2019  

California

     44     41

New York

     8       7  

Texas

     5       6  

Florida

     5       5  

Other

     38       41  


     100     100


A significant portion of the Company’s proprietary Jumbo products are originated within the state of California. The Company’s non-agency reverse mortgage production is concentrated by location is presented in the following table. The Company’s total origination volume in any other states did not exceed 5% of the total origination volume, and were included in the “Other” balance.


     December 31,  
     2020     2019  

California

     84     85

Other

     16       15  


     100     100


Loans previously repurchased out of a HMBS pool that were subsequently securitized also contain concentrations of credit risk as they are limited due to the dispersion across of many geographic areas. The table below provides the percentage of securitized nonperforming HECM buyouts in the Company’s Consolidated Statements of Financial Condition by the location in which the home securing the loan is located and is based on their remaining UPBs. “Other” consists of loans in states in which concentration individually represents less than 5% of total remaining UPB.


F-104


Table of Contents

Finance of America Equity Capital LLC and Subsidiaries

Notes to Consolidated Financial Statements


     December 31,  
     2020     2019  

Puerto Rico

     21     24

New York

     15       13  

Texas

     9       9  

California

     9       8  

Other

     46       46  


     100 %      100


Puerto Rico’s economy has been in a serious recession since the second quarter of 2006, and its economic downturn has been generally much worse than that of the United States. Further, Hurricane Maria in 2017 has further stressed the economy and infrastructure in Puerto Rico, resulting in extensive loss of water supplies and electricity.

Regulatory agencies require all properties in affected areas to be inspected for “acceptable” condition prior to any transaction occurring with or on behalf of the GSEs or HUD (including foreclosure sale, property conveyance, sale/ funding/transfers of originated loans to third parties, etc.). This required inspection may cause delays in foreclosures and settlement of claims. Additionally, in certain circumstances when there are uninsured losses, the Company may be responsible for repairs to the properties if not done by the homeowner.

In its determination of fair value amounts for loans that are in disaster impacted areas, the Company has provided for increased expectations of loss severities due to delays in processing claims and uninsured losses. These estimates are based on management’s best estimates of anticipated losses. Actual results may differ from the estimates due to external factors.

Commercial Mortgages

The economies of states where mortgage properties are concentrated may be adversely affected to a greater degree than the economies of other areas of the country. In recent years, certain regions of the United States have experienced significant downturns in the market value of real estate. The table below provides the percentage of loans on the Company’s Consolidated Statements of Financial Condition by the location in which the home securing the loan is located and is based on their remaining UPBs. “Other” consists of loans in states in which concentration individually represents less than 5% of total remaining UPB.


     December 31,  
     2020     2019  

New Jersey

     9     13

California

     9       11  

Florida

     6       9  

New York

     7       7  

Illinois

     7       7  

Texas

     5       5  

Connecticut

     5       4  

Minnesota

     5       1  

Pennsylvania

     4       6  

Other

     43       37  


     100     100


F-105


Table of Contents

Finance of America Equity Capital LLC and Subsidiaries

Notes to Consolidated Financial Statements


Incenter

The Company had two major referral partners accounting for approximately 23%, 24%, and 34%of the Company’s title and closing revenue for the years ended December 31, 2020, 2019 and 2018, respectively.

Ratings have always been an important factor in establishing the competitive position of insurance companies. Ratings reflect the opinion of a rating agency with regard to an insurance company’s or insurance holding company’s financial strength, operating performance and ability to meet its obligations to policyholders and are not evaluations directed to investors. The Company’s insurance subsidiary is rated by Demotech and as of December 31, 2020 the rating assigned was A (Exceptional). The Company is subject to continued periodic review by the rating agency and the continued retention of the rating cannot be assured. If the rating is reduced from the current level or the ratings of the Company’s insurance title underwriter are downgraded, the results of operations could be adversely affected.


37.

Related Party Transactions

The Company transacts with various related parties as a part of normal day-to-day operations. The Company has advanced funds to UFG Global, LLC to fund operations.

Total amounts due were as follows:


     December 31,  
     2020      2019  

UFG Global, LLC

   $ —        $ 1,458  

Other related parties

     2,559        1,356  


Due from related parties

   $ 2,559      $ 2,814  


Promissory Notes

In June 2019, the Company executed two Revolving Working Capital Promissory Note Agreements (the “2019 Promissory Notes”) with BTO Urban Holdings and Libman Family Holdings, LLC, which are deemed affiliates of the Company. Under the terms of the 2019 Promissory Notes, the Company borrowed $35.0 million, which was secured by certain tangible assets. The 2019 Promissory Notes accrued interest monthly at a rate of 10.0% per annum and matured in June 2020. For the year ended December 31, 2020 and 2019, the Company paid interest of $3.1 million and $3.8 million related to the 2019 Promissory Notes, respectively. The principal balance of the 2019 Promissory Notes has been paid in full as of December 31, 2020.

Agricultural Loans

In 2019, the Company entered into an Amended and Restated Limited Liability Company Agreement with FarmOp Capital Holdings, LLC (“FarmOps”) in which the Company acquired an equity investment in FarmOps. Subsequent to this agreement, the Company agreed to purchase originated agricultural loans from FarmOps. For the years ended December 31, 2020 and 2019, the Company purchased $146.2 million and $19.9 million of agricultural loans for a total purchase price of $126.4 million and $13.0 million, respectively.

In November 2020, the Company and FarmOps executed a promissory note for $0.3 million that matures in January 2021. The promissory note was amended to $0.8 million in December 2020, with all other terms remaining the consistent with the original note.


F-106


Table of Contents

Finance of America Equity Capital LLC and Subsidiaries

Notes to Consolidated Financial Statements


Cloudvirga

In 2017, certain subsidiaries of the Company entered into a Series B deferred stock purchase agreement with Cloudvirga, Inc. (“Cloudvirga”), in which the company acquired an equity investment in Cloudvirga. Subsequent to this acquisition, the Company entered into a software development arrangement in which Cloudvirga agreed to develop software in addition to providing certain technology services for the Company. As of December 31, 2020, $1.8 million was capitalized related to the development of the software and will be amortized over a 36 month period from the date placed in service. For the years ended December 31, 2020, 2019, and 2018, $2.4 million, $3.0 million, and $2.9 million, respectively, in professional fees were paid to Cloudvirga in exchange for the technology services provided.

Office Lease

In 2016, the Company entered into a lease agreement for office space with a related party. The Company paid total rent expense of $0.1 million for each of the years ended December 31, 2020, 2019, and 2018, respectively.

Nonrecourse MSR Financing Liability, at Fair Value

In 2020, the Company entered into a nonrevolving facility commitment with various investors of UFG, the parent company of FoA, to sell beneficial interests in the servicing fees generated from its originated or acquired MSRs. Under these agreements, the Company has agreed to sell to these parties the right to receive all excess servicing and ancillary fees related to the identified MSRs in exchange for an upfront payment equal to the entire purchase price of the acquired or originated MSRs. These transactions are accounted for as financings under ASC 470, Debt.

As of December 31, 2020, the Company had an outstanding advance of $14.9 million against this commitment for the purchase of MSRs with a fair value of $14.1 million. The Company has accrued for excess servicing and ancillary fees against the outstanding advances in the amount of $0.5 million to these investors for the year ended December 31, 2020.

The Company has also entered into Investment Management Agreements with these third parties to serve as the investment manager, in which the Company performs various advisory services to the investors in exchange for a management fee.

Senior Notes

Related parties of FoA purchased notes in the high-yield debt offering in November 2020 in an aggregate principal amount of $135.0 million.


F-107


Table of Contents

Finance of America Equity Capital LLC and Subsidiaries

Notes to Consolidated Financial Statements


38.

Condensed Financial Information of Registrant (Parent Company Only)

Finance of America Equity Capital LLC

(Parent company only)

Condensed Statements of Financial Condition

(Dollars in thousands)


     December 31,  
     2020      2019  

ASSETS


Fixed assets and leasehold improvements, net

   $ 23      $ 29  

Investment in subsidiaries

     1,177,527        755,130  

Other assets, net

     2,184        1,950  


TOTAL ASSETS

   $ 1,179,734      $ 757,109  


LIABILITIES AND MEMBERS’ EQUITY


Notes payable, net

   $ 336,573      $ 42,313  

Payables and other liabilities

     48,890        44,002  


TOTAL LIABILITIES

     385,463        86,315  


CRNCI

     166,231        187,981  


TOTAL MEMBERS’ EQUITY

     628,040        482,813  


TOTAL LIABILITIES, CRNCI, AND MEMBERS’ EQUITY

   $ 1,179,734      $ 757,109  


Finance of America Equity Capital LLC

(Parent Company Only)

Condensed Statements of Operations and Comprehensive Income

(Dollars in thousands)


     For the years ended December 31,  
     2020     2019     2018  

REVENUES


Equity income from subsidiaries

   $ 511,217     $ 88,101     $ 53,006  

Interest expense

     (3,669     (3,084     (1,522


TOTAL REVENUES

     507,548       85,017       51,484  


EXPENSES


Salaries and benefits

     7,710       6,134       2,929  

Occupancy and equipment rentals

     632       475       154  

General and administrative

     1,293       1,778       1,156  


TOTAL EXPENSES

     9,635       8,387       4,239  


NET INCOME BEFORE TAXES

     497,913       76,630       47,245  


NET INCOME

     497,913       76,630       47,245  


COMPREHENSIVE INCOME

   $ 497,913     $ 76,630     $ 47,245  


F-108


Table of Contents

Finance of America Equity Capital LLC and Subsidiaries

Notes to Consolidated Financial Statements


As disclosed in Note 2, FoA is a holding company and wholly owned subsidiary of UFG that was formed in July 2020. As such, FoA did not have any cash as of December 31, 2020, 2019 or 2018, accordingly a Statement of Cash Flows has not been presented. Management determined which assets and liabilities were to be used by the operating subsidiaries and these amounts have been appropriately reflected within the Statement of Financial Position of FoA Equity. Changes in these balances are reflected as additional contributions and distributions from UFG in the period in which they occur, and had no impact on any cash balances that may have otherwise been maintained at FoA.

Basis of Presentation

The parent company financial statements should be read in conjunction with the Company’s Consolidated Financial Statements and the accompanying notes thereto. The parent company follows the same accounting policies as disclosed in Note 2 to the Company’s Consolidated Financial Statements. For purposes of this condensed financial information, the Company’s wholly owned and majority owned subsidiaries are recorded based upon its proportionate share of the subsidiaries net assets (similar to presenting them on the equity method).

Since restricted net assets of FoA and its subsidiaries exceed 25% of the consolidated net assets of the Company and its subsidiaries, the accompanying condensed parent company financial statements have been prepared in accordance with Rule 12-04 Schedule 1 of Regulation S-X. this information should be read in conjunction with the accompanying Consolidated Financial Statements.

Dividends from Subsidiaries

There were $380.4 million cash dividends paid to FoA from the Company’s consolidated subsidiaries for the year ended December 31, 2020. There were no cash dividends paid for both of the years ended December 31, 2019 and 2018.


39.

Subsequent Events

The Company has evaluated subsequent events from the date of the Consolidated Financial Statements of December 31, 2020 through March 26, 2021, the date these Consolidated Financial Statements were issued. No events or transactions were identified that would have an impact on the financial position or results of operations of the Company as of December 31, 2020 as reported herein. However, management of the Company believes disclosure of the following events is appropriate.

Securitizations

FAR

In February 2021, the Company securitized approximately $571.4 million of its HECMs which have generally been repurchased from GNMA securitizations, through the issuance of approximately $571.4 million of mortgage backed notes, which accrue interest at an annual rate of 1.74% on a weighted average based on the principal balance of the notes and have a scheduled final maturity date of February 2031. The principal and interest on the outstanding notes are paid using the cash flows from the HECMs, which serve as collateral for the debt. The securitization is callable by the Company with the first optional redemption date in February 2022. Certain of the HECMs included in the February 2021 securitization were from the Company’s optional redemption of two prior securitizations. One of the optional redemptions was exercised by the Company in


F-109


Table of Contents

Finance of America Equity Capital LLC and Subsidiaries

Notes to Consolidated Financial Statements


February 2021 and the other was previously exercised in December 2020. In connection with its optional redemption in February 2021, the Company paid off notes secured by HECMs with an outstanding principal balance of $294.2 million. The notes were paid off at par.

Financing Lines of Credit

Mortgage Lines

The January 2021 $250.0 million facility was amended in February 2021. Under the terms of the new amended agreement, the borrowing capacity was reduced from $250.0 million to $200.0 million and the maturity date was extended to March 2021.

The March 2021 $350.0 million facility was amended in February 2021. Under the terms of the new amended agreement, the borrowing capacity was reduced from $350.0 million to $200 million and the maturity date was extended to April 2021.

In February 2021, a new facility agreement of $300.0 million was executed with a maturity date of February 2022.

The March 2021 $225.0 million facility was amended in March 2021. Under the terms of the new amended agreement, the maturity date was extended to March 2022.

In March 2021, a new MSR facility agreement of $150.0 million was executed with a maturity date of March 2026.

Reverse Lines

The January 2021 $200.0 million facility was amended in March 2021. Under the terms of the new amended agreement, the borrowing capacity was reduced from $200.0 million to $100 million and the maturity date was extended to March 2022.

In January 2021 and March 2021, margin calls totaling $0.3 million and $4.7 million, respectively, were paid in relation to the April 2022 $52.5 million facility.

Commercial Lines

The February 2021 $200.0 million facility was amended in February 2021. Under the terms of the new amended agreement, the borrowing capacity was reduced from $200.0 million to $150.0 million and the maturity date was extended to February 2022.

The January 2021 $150.0 million facility was amended in February 2021. Under the terms of the new amended agreement, the maturity date was extended to February 2022.

In February 2021, a new facility for the financing of agricultural loans was executed for $75.0 million with a maturity date of July 2022.

The September 2021 $150.0 million facility was amended in March 2021. Under the terms of the new amended agreement, the maturity date was extended to September 2022.


F-110


Table of Contents

Finance of America Equity Capital LLC and Subsidiaries

Notes to Consolidated Financial Statements


Other Secured

The March 2021 $50.0 million facility was paid in full in March 2021.

In February 2021, a new facility for the financing of HECM MSR was executed for $90.0 million with a maturity date of February 2024.

Related Party Transactions

Agricultural Loans

Subsequent to the amended and restated promissory note dated December 8, 2020, the Company and FarmOps executed an amended and restated promissory note on January 20, 2021 to extend the maturity date of January 8, 2021 to February 8, 2021, all other terms remaining the same.

Subsequent to the amended and restated promissory note dated February 12, 2021, the Company and FarmOps executed an amended and restated promissory note to extend the maturity date of February 8, 2021 to February 26, 2021. As of the due date of February 26, 2021 the promissory note was converted to a convertible promissory note in the amount of $3.3 million, in accordance with the amended and restated promissory note.

FAM Third Party MSR Fund

In February 2021, FAM entered into a $350.0 million nonrevolving facility commitment with unaffiliated third party investors. Repayment of amounts drawn from the facility are repaid from excess servicing fees as well as net operating cash flows from certain identified MSRs. As of March 26, 2021, no amounts have been borrowed or advanced from this facility.


F-111


Table of Contents

Finance of America Equity Capital LLC and Subsidiaries

Consolidated Statements of Financial Condition

(Dollars in thousands)


     March 31, 2021     December 31, 2020  
     (unaudited)        

ASSETS


Cash and cash equivalents

   $ 347,755     $ 233,101  

Restricted cash

     305,292       306,262  

Reverse mortgage loans held for investment, subject to HMBS related obligations, at fair value

     10,071,192       9,929,163  

Mortgage loans held for investment, subject to nonrecourse debt, at fair value

     5,291,444       5,396,167  

Mortgage loans held for investment, at fair value

     1,100,544       730,821  

Mortgage loans held for sale, at fair value

     2,140,361       2,222,811  

Debt securities

     9,230       10,773  

Mortgage servicing rights, at fair value, $22,051 and $14,088, subject to nonrecourse MSR financing liability, respectively

     267,364       180,684  

Derivative assets

     116,480       92,065  

Fixed assets and leasehold improvements, net

     26,079       24,512  

Goodwill

     128,750       121,233  

Intangible assets, net

     16,302       16,931  

Due from related parties

     1,463       2,559  

Other assets, net

     278,163       298,073  


TOTAL ASSETS

   $ 20,100,419     $ 19,565,155  


LIABILITIES, CONTINGENTLY REDEEMABLE NONCONTROLLING INTEREST (“CRNCI”) AND MEMBER’S EQUITY


HMBS related obligations, at fair value

   $ 9,926,132     $ 9,788,668  

Nonrecourse debt, at fair value

     5,227,943       5,271,842  

Other financing lines of credit

     3,340,345       2,973,743  

Payables and other liabilities

     425,317       400,058  

Notes payable, net

     336,296       336,573  


TOTAL LIABILITIES

     19,256,033       18,770,884  


Commitments and contingencies (Note 23)


CRNCI

     203,216       166,231  

MEMBER’S EQUITY


FoA Equity Capital LLC member’s equity

     641,736       628,176  

Accumulated other comprehensive (loss) income

     (2     9  

Noncontrolling interest

     (564     (145


TOTAL MEMBER’S EQUITY

     641,170       628,040  


TOTAL LIABILITIES, CRNCI AND MEMBER’S EQUITY

   $ 20,100,419     $ 19,565,155  


See accompanying notes to unaudited consolidated financial statements


F-112


Table of Contents

Finance of America Equity Capital LLC and Subsidiaries

Consolidated Statements of Financial Condition

(Dollars in thousands)


The following table presents the assets and liabilities of the Company’s consolidated variable interest entities, which are included on the Consolidated Statements of Financial Condition above, and excludes intercompany balances and other retained beneficial interests that eliminate in consolidation.


     March 31, 2021      December 31, 2020  
     (unaudited)         

ASSETS


Restricted cash

   $ 287,238      $ 293,580  

Mortgage loans held for investment, subject to nonrecourse debt, at fair value


2021 FASST HB1

     520,850        —    

2019 FASST JR2

     462,022        488,760  

2018 FASST JR1

     421,710        449,069  

2019 FASST JR3

     420,389        450,703  

2020 FASST HB2

     394,767        398,480  

2020 FASST JR3

     359,678        372,015  

2019 FASST JR4

     347,459        377,265  

2020 FASST JR2

     324,100        341,439  

2020 FASST S3

     317,752        316,774  

2019 FASST JR1

     312,802        331,244  

2020 FASST S2

     306,426        311,721  

2018 FASST JR2

     249,180        264,622  

2020 FASST JR1

     244,019        263,266  

2020 FASST JR4

     223,090        237,100  

2020 FASST S1

     185,224        189,243  

2020 RTL1 ANTLR

     95,217        137,989  

2018 RTL1 ANTLR

     54,496        82,393  

2019 RTL1 ANTLR

     52,263        118,161  

2020 FASST HB1

     —          265,923  

Other assets

     59,438        79,528  


TOTAL ASSETS

   $ 5,638,120      $ 5,769,275  


LIABILITIES


Nonrecourse debt, at fair value


2021 FASST HB1

   $ 563,751      $ —    

2020 FASST HB2

     454,449        472,074  

2019 FASST JR2

     446,893        463,568  

2018 FASST JR1

     440,459        450,268  

2019 FASST JR3

     401,826        423,406  

2019 FASST JR4

     333,823        350,514  

2020 FASST JR3

     333,291        337,024  

2019 FASST JR1

     310,208        326,367  

2020 FASST S2

     294,213        298,435  

2020 FASST JR2

     293,121        297,046  

2020 FASST S3

     289,328        294,226  

2018 FASST JR2

     260,163        265,695  

2020 FASST JR1

     229,794        238,438  

2020 FASST JR4

     203,063        217,362  

2020 FASST S1

     178,532        181,630  

2020 RTL1 ANTLR

     90,438        140,441  

2018 RTL1 ANTLR

     43,648        80,767  

2019 RTL1 ANTLR

     38,892        121,580  

2020 FASST HB1

     —          298,913  

Payables and other liabilities

     171        291  


TOTAL LIABILITIES

   $ 5,206,063      $ 5,258,045  


Net fair value of assets subject to nonrecourse debt

   $ 432,057      $ 511,230  


See accompanying notes to unaudited consolidated financial statements


F-113


Table of Contents

Finance of America Equity Capital LLC and Subsidiaries

Consolidated Statements of Operations and Comprehensive Income

(Dollars in thousands)

(Unaudited)


     For the three months ended March 31,  
             2021                     2020          

REVENUES


Gain on sale and other income from mortgage loans held for sale, net

   $ 291,334     $ 130,684  

Net fair value gains on mortgage loans and related obligations

     76,663       13,380  

Fee income

     152,509       69,956  

Net interest expense:


Interest income

     12,661       8,171  

Interest expense

     (34,366     (33,932


Net interest expense

     (21,705     (25,761


TOTAL REVENUES

     498,801       188,259  


EXPENSES


Salaries, benefits and related expenses

     238,530       144,378  

Occupancy, equipment rentals and other office related expenses

     7,597       7,403  

General and administrative expenses

     127,217       78,566  


TOTAL EXPENSES

     373,344       230,347  


NET INCOME (LOSS) BEFORE INCOME TAXES

     125,457       (42,088

Provision for income taxes

     1,137       318  


NET INCOME (LOSS)

     124,320       (42,406

CRNCI

     4,260       (15,386

Noncontrolling interest

     201       229  


NET INCOME (LOSS) ATTRIBUTABLE TO FOA EQUITY CAPITAL LLC

     119,859       (27,249

COMPREHENSIVE LOSS ITEM:


Impact of foreign currency translation adjustment

     (11     (7


COMPREHENSIVE INCOME (LOSS) ATTRIBUTABLE TO FOA EQUITY CAPITAL LLC

   $ 119,848     $ (27,256


See accompanying notes to unaudited consolidated financial statements


F-114


Table of Contents

Finance of America Equity Capital LLC and Subsidiaries

Consolidated Statements of Changes in Member’s Equity

(Dollars in thousands)

(Unaudited)


     FoA Equity
Capital LLC
Member’s
Equity
    Accumulated
Other
Comprehensive
(Loss) Income
    Noncontrolling
Interest
    Total  

Balance at December 31, 2019

   $ 482,719     $ (51   $ 145     $ 482,813  

Contributions from members

     1,042       —         —         1,042  

Net (loss) income attributable to FoA Equity Capital LLC

     (27,249     —         229       (27,020

Foreign currency translation adjustment

     —         (8     —         (8


Balance at March 31, 2020

   $ 456,512     $ (59   $ 374     $ 456,827  


Balance at December 31, 2020

   $ 628,176     $ 9     $ (145   $ 628,040  

Contributions from members

     1,426       —         —         1,426  

Distributions to members

     (75,000     —         —         (75,000

Noncontrolling interest distributions

     —         —         (620     (620

Net income attributable to FoA Equity Capital LLC

     119,859       —         201       120,060  

Accretion of CRNCI to redemption price

     (32,725     —         —         (32,725

Foreign currency translation adjustment

     —         (11     —         (11


Balance at March 31, 2021

   $ 641,736     $ (2   $ (564   $ 641,170  


See accompanying notes to unaudited consolidated financial statements


F-115


Table of Contents

Finance of America Equity Capital LLC and Subsidiaries

Consolidated Statements of Cash Flows

(Dollars in thousands)

(Unaudited)


     For the three months ended March 31,  
               2021                         2020            

Operating Activities


Net income (loss)

   $ 124,320     $ (42,406

Adjustments to reconcile net income (loss) to net cash provided by (used in) operating activities:


Gain on sale and other income from mortgage loans held for sale, net

     (291,334     (130,684

Unrealized changes in fair value on mortgage loans, related obligations and derivatives

     (69,283     (5,003

Change in fair value of mortgage servicing rights

     (20,349     775  

Depreciation and amortization

     5,366       5,202  

Change in fair value of nonrecourse MSR financing liability

     (390     —    

Loss on investments

     9,464       —    

Non-cash expense related to leases

     1,411       335  

Interest rate swap settlements

     38,555       (2,776

Originations/purchases of mortgage loans held for sale

     (8,569,575     (4,385,710

Proceeds from sale of mortgage loans held for sale

     8,878,131       4,408,162  

Changes in operating assets and liabilities:


Other assets

     111,423       (19,758

Payables and accrued expenses

     (99,696     38,486  


Net cash provided by (used in) operating activities

     118,043       (133,377


Investing Activities


Purchases and originations of mortgage loans held for investment

     (1,151,925     (948,843

Proceeds/payments received on mortgage loans held for investment

     677,777       385,270  

Purchases and originations of mortgage loans held for investment, subject to nonrecourse debt

     (12,247     (10,352

Proceeds/payments on mortgage loans held for investment, subject to nonrecourse debt

     217,452       114,954  

Purchases of debt securities

     (557     (5,010

Proceeds/payments on debt securities

     2,096       14,699  

Proceeds on sale of mortgage servicing rights

     7,765       —    

Purchases of mortgage servicing rights

     (9,014     —    

Acquisition of fixed assets

     (4,178     (1,534

Purchase of investments

     —         (563

Payments on deferred purchase price liability

     (657     (493

Issuance of convertible notes receivable

     (2,550     —    

Note receivable from Renovate America

     (35,260     —    

Acquisition of subsidiaries, net of cash acquired

     (749     (197


Net cash used in investing activities

     (312,047     (452,069


F-116


Table of Contents

Finance of America Equity Capital LLC and Subsidiaries

Consolidated Statements of Cash Flows

(Dollars in thousands)


     For the three months ended March 31,  
               2021                         2020            

Financing Activities


Proceeds from securitizations of mortgage loans, subject to HMBS related obligations

     602,172       446,488  

Payments on HMBS related obligations

     (506,142     (480,418

Proceeds from issuance of nonrecourse debt, net

     579,518       515,835  

Payments on nonrecourse debt

     (658,300     (400,498

Proceeds from other financing lines of credit

     10,027,696       6,113,558  

Payments on other financing lines of credit

     (9,660,588     (5,647,276

Debt issuance costs

     (2,467     (1,377

Noncontrolling interest distributions

     (620     —    

Member distributions

     (75,000     —    

Member contributions

     1,426       1,042  


Net cash provided by financing activities

     307,695       547,354  


Foreign currency translation adjustment

     (7     (4


Net increase (decrease) in cash and restricted cash

     113,684       (38,096

Cash and restricted cash, beginning of period

     539,363       382,664  


Cash and restricted cash, end of period

   $ 653,047     $ 344,568  


Supplementary Cash Flows Information


Cash paid for interest

   $ 50,071     $ 45,214  

Cash paid for taxes, net

     63       15  

Loans transferred to mortgage loans held for investment, at fair value, from mortgage loans held for investment, subject to nonrecourse debt, at fair value

     283,428       234,596  

Loans transferred to mortgage loans held for sale, at fair value, from mortgage loans held for investment, at fair value

     —         170,158  

Loans transferred to government guaranteed receivables from mortgage loans held for investment, at fair value, and mortgage loans held for investment, subject to nonrecourse debt, at fair value

     71       6,142  

Loans transferred to mortgage loans held for investment, subject to nonrecourse debt, at fair value, from mortgage loans held for investment, at fair value

     272,098       416,110  

Loans transferred to mortgage loans held for investment, at fair value, from mortgage loans held for sale, at fair value

     42,909       —    

See accompanying notes to unaudited consolidated financial statements


F-117


Table of Contents

Notes to Unaudited Consolidated Financial Statements


F-118


Table of Contents

Finance of America Equity Capital LLC and Subsidiaries

Notes to Unaudited Consolidated Financial Statements


1.

Organization and Description of Business

Finance of America Equity Capital LLC (“FoA” or the “Company”) is a limited liability company that was formed in July 2020. FoA is a wholly-owned subsidiary of UFG Holdings LLC (“UFG” or “Parent”). FoA is a financial services holding company which, through its operating subsidiaries, is a leading originator and servicer of residential mortgage loans and provider of complementary financial services.

FoA owns all of the outstanding equity interests or has a controlling financial interest in Finance of America Funding LLC (“FOAF”) and Finance of America Holdings LLC (“FAH”) and Incenter LLC (“Incenter”), which are wholly owned subsidiaries of FOAF (collectively known as “operating subsidiaries”).

The Company, through its primary operating subsidiary FAH, originates, purchases, sells and securitizes conventional (conforming to the underwriting standards of Fannie Mae or Freddie Mac; collectively referred to as government sponsored entities (“GSEs”), government-insured (Federal Housing Administration (“FHA”)), government guaranteed (Department of Veteran Affairs), and proprietary non-Agency residential and reverse mortgages. In addition, FAH also serves as a specialty finance company which originates a variety of commercial mortgage loans to owners and investors of single and multi-family residential rental properties. The Company, through its other operating subsidiary, Incenter, also provides lender services, title services, secondary markets advisory, mortgage trade brokerage, appraisal and capital management services to customers in the residential mortgage, student lending, and commercial lending industries. Incenter operates a foreign branch in the Philippines for fulfillment transactional support.

Business Combination

On October 12, 2020, the Company and Replay Acquisition Corp. (“Replay Acquisition”), a publicly traded special purpose acquisition company, agreed to a business combination that will result in Finance of America becoming a publicly listed company. The Company; Replay Acquisition; Finance of America Companies Inc., a Delaware corporation and wholly owned subsidiary of Replay (“New Pubco”); RPLY Merger Sub LLC, a Delaware limited liability company and wholly owned subsidiary of New Pubco (“Replay Merger Sub”); RPLY BLKR Merger Sub LLC, a Delaware limited liability company and wholly owned subsidiary of New Pubco (“Blocker Merger Sub”); Blackstone Tactical Opportunities Fund (Urban Feeder) – NQ L.P., a Delaware limited partnership (“Blocker”); Blackstone Tactical Opportunities Associates – NQ L.L.C., a Delaware limited liability company (“Blocker GP”); BTO Urban Holdings L.L.C., a Delaware limited liability company (“BTO Urban”), Blackstone Family Tactical Opportunities Investment Partnership – NQ – ESC L.P., a Delaware limited partnership (“ESC”), Libman Family Holdings LLC, a Connecticut limited liability company (“Family Holdings”), The Mortgage Opportunity Group LLC, a Connecticut limited liability company (“TMO”), L and TF, LLC, a North Carolina limited liability company (“L&TF”), UFG Management Holdings LLC, a Delaware limited liability company (“Management Holdings”), and Joe Cayre (each of BTO Urban, ESC, Family Holdings, TMO, L&TF, Management Holdings and Joe Cayre, a “Seller” and, collectively, the “Sellers” or the “Continuing Unitholders”); and BTO Urban and Family Holdings, solely in their joint capacity as the representative of the Sellers pursuant to Section 12.18 of the Transaction Agreement (as defined below) (the “Seller Representative”), entered into a Transaction Agreement (the “Transaction Agreement”) pursuant to which Replay agreed to combine with FoA in a series of transactions (collectively, the “Business Combination”) that will result in New Pubco becoming a publicly-traded company on the New York Stock Exchange (the “NYSE”) and controlling FoA in an “UP-C” structure.

Concurrently with the execution of the Transaction Agreement, (i) the Company entered into subscription agreements with various investors, including an affiliate of our Sponsor, pursuant to which such investors agreed to purchase our ordinary shares (which ordinary shares will be converted into Replay LLC Units pursuant to the


F-119


Table of Contents

Finance of America Equity Capital LLC and Subsidiaries

Notes to Unaudited Consolidated Financial Statements


Domestication and then will be converted into the right to receive shares of Class A Common Stock pursuant to the Replay Merger) (each such subscription agreement, a “Replay PIPE Agreement”), and (ii) New Pubco entered into subscription agreements with certain funds affiliated with related parties (collectively, the “Principal Stockholders”, and together with the investors party to the Replay PIPE Agreements, the “PIPE Investors”) pursuant to which the Principal Stockholders agreed to purchase shares of Class A Common Stock (together with the ordinary shares being purchased pursuant to the Replay PIPE Agreements, the “PIPE Shares”). In the aggregate, the PIPE Investors have committed to purchase $250.0 million of PIPE Shares, at a purchase price of $10.00 per PIPE Share, including $10.0 million of PIPE Shares to be purchased by an affiliate of our Sponsor.

The Proposed Business Combination will close on April 1, 2021. Refer to Note 32 - Subsequent Events for additional information.

Ongoing Risks

On January 30, 2020, the World Health Organization (“WHO”) announced a global health emergency because of a new strain of coronavirus (the “COVID-19 outbreak”) and the risks to the international community as the virus spreads globally beyond its point of origin. In March 2020, the WHO classified the COVID-19 outbreak as a pandemic, based on the rapid increase in exposure globally.

The COVID-19 pandemic has adversely impacted global financial markets and contributed to significant volatility in market liquidity and yields required by market investors in the type of financial instruments originated by the Company’s primary operating subsidiaries. In the U.S., significant fiscal stimulus measures, monetary policy actions and other relief measures have helped to moderate the negative economic impacts of COVID-19, and have supported the economic recovery which began in 2020 and continues into 2021. On March 27, 2020, the Coronavirus Aid, Relief, and Economic Security Act (the “CARES Act”) was enacted into law. In March 2021, the U.S. federal government passed a $1.9 trillion American Rescue Plan Act or ARPA, which together with the CARES Act and other fiscal stimulus measures put in place in 2020, provide for, among other things, funding to state and local governments, direct payments to households, support for small businesses, renter assistance and funding for transport, airlines, healthcare and education. Monetary policy decisions have included quantitative easing and the provision of liquidity to financial institutions and credit markets. In addition, housing measures, such as forbearance on mortgages and suspension of foreclosures and evictions, and various executive orders have helped to provide relief.

The full impact of the COVID-19 pandemic continues to evolve as of the date of this report. The Company’s management is actively monitoring the global situation and its effect on the Company’s financial condition, liquidity, operations, industry, and workforce. Further, the Company cannot estimate the length or gravity of the impact that the COVID-19 pandemic on the residential mortgage and commercial lending industries. As of March 31, 2021, the COVID-19 pandemic remains in place and impacts the economic environment in which the Company conducts business but has not had a material impact to the Company’s consolidated financial statements for three months ended March 31, 2021. However, as the pandemic continues, it may have an adverse effect on the Company’s results of future operations, financial position, intangible assets and liquidity in fiscal year 2021.


2.

Summary of Significant Accounting Policies

Basis of Presentation

FoA is a holding company formed under the laws of the State of Delaware in July 2020. Through its Parent, the Company is owned by Libman Family Holdings, LLC, certain investment funds affiliated with The Blackstone


F-120


Table of Contents

Finance of America Equity Capital LLC and Subsidiaries

Notes to Unaudited Consolidated Financial Statements


Group Inc. (“Blackstone”) and other co-investors (collectively, the “Initial Investors”). There are no historical operating results as, contemporaneous with the formation of FoA, UFG contributed all of its operating subsidiaries into FoA in a common control reorganization. The reorganization was accounted for as a reorganization under common control and, accordingly, the historical basis of accounting was retained as if the entities had always been combined for financial reporting purposes. The Company conducts substantially all of its business operations through its operating subsidiaries. In October 2020, UFG and FoA entered into a transaction agreement with a special purpose acquisition company (“SPAC”), pursuant to which, the SPAC will acquire an equity interest in FoA from its Initial Investors.

The consolidated financial statements of the Company have been prepared in accordance with U.S. generally accepted accounting principles (“GAAP”). The significant accounting policies described below, together with the other notes that follow, are an integral part of the consolidated financial statements.

Principles of Consolidation

The consolidated financial statements include the accounts of the Company and its wholly-owned subsidiaries and certain variable interest entities (“VIEs”) where the Company is the primary beneficiary. The Company is deemed to be the primary beneficiary of a VIE when it has both (1) the power to direct the activities of the VIE that most significantly impact the entity’s economic performance, and (2) exposure to benefits and/or losses that could potentially be significant to the entity. Assets and liabilities of VIEs and their respective results of operations are consolidated from the date that the Company became the primary beneficiary through the date that the Company ceases to be the primary beneficiary.

The company consolidates the accounts of Finance of America Commercial Holdings LLC (“FACo Holdings”), the noncontrolling interests of which meet the definition of contingently redeemable financial instruments for which the ability to redeem is outside the control of the consolidating entity. The Contingently Redeemable Noncontrolling Interest (“CRNCI”) in this subsidiary is shown as a separate caption between liabilities and equity. Any income or losses attributable to the CRNCI are shown as an addition to or deduction from CRNCI in the Consolidated Statements of Financial Condition. All significant intercompany balances and transactions have been eliminated. See Note 25 - Changes in CRNCI for further discussion of the CRNCI and additions to or deductions from the CRNCI balance.

Net Income Per Unit

FoA’s capital structure consists of a single class of outstanding membership units which are held by one member, UFG. Therefore, the Company has omitted earnings per unit due to the limited number of LLC unit holders for the periods presented.

Reclassifications

Certain amounts from the prior year consolidated financial statements have been reclassified to conform to the current year financial presentation.

Recently Adopted Accounting Guidance


Standard    Description    Effective Date    Effect on Consolidated
Financial Statements
ASU 2016-13 , Financial Instruments—Credit Losses (Topic    Requires use of the current expected credit loss model that is based on expected losses (net of expected    January 2020    The Company determined that certain servicer advances and


F-121


Table of Contents

Finance of America Equity Capital LLC and Subsidiaries

Notes to Unaudited Consolidated Financial Statements


Standard    Description    Effective Date    Effect on Consolidated
Financial Statements
326): Measurement of Credit Losses on Financial Instruments, ASU 2019-04, Codification Improvements to Topic 326, Financial Instruments - Credit Losses, ASU 2019-05, Financial Instruments-Credit Losses (Topic 326): Targeted Transition Relief, ASU 2019-10, Financial Instruments—Credit Losses (Topic 326), ASU 2019-11, Codification Improvements to Topic 326, Financial Instruments - Credit Losses, ASU 2020-03, Codification Improvements to Financial Instruments   

recoveries), rather than incurred losses, to determine our allowance for credit losses on financial assets measured at amortized cost, certain net investments in leases and certain off-balance sheet arrangements.


Replaces current accounting for purchased credit impaired (“PCI”) and impaired loans.


Amends the other-than-temporary impairment model for available for sale debt securities. The new guidance requires that credit losses be recorded through an allowance approach, rather than through permanent write-downs for credit losses and subsequent accretion of positive changes through interest income over time.

      other receivables, net of reserves including in other assets are with the scope of ASU 2016-13. The Company determined that these receivables have limited expected credit-related losses due to the contractual servicing agreements with agencies and loan product guarantees. Furthermore, the Company determined that for outstanding servicer and other advances, that the majority of estimated losses are attributable to losses due to servicing operational errors and credit-related losses are not significant because of the contractual relationship with the agencies. The adoption of ASU 2016-13 did not have a material impact on the Company’s consolidated financial statements.
ASU 2018-17 , Consolidation (Topic 810): Targeted Improvements to Related Party Guidance for Variable Interest Entities    The amendments in this Update require that indirect interests held through related parties under common control be considered on a proportional basis when determining whether fees paid to decision makers or service providers are variable interests. These amendments align with the determination of whether a reporting entity within a related party group is the primary beneficiary of a VIE.    January 2020   

The Company adopted this guidance using the prospective method of adoption.


Adoption of this standard did not have a material impact on the consolidated financial statements.

ASU No. 2017-04, Intangibles - Goodwill    Historical guidance for goodwill impairment testing prescribed that the    January 2020    The Company adopted this guidance using the


F-122


Table of Contents

Finance of America Equity Capital LLC and Subsidiaries

Notes to Unaudited Consolidated Financial Statements


Standard    Description    Effective Date    Effect on Consolidated
Financial Statements
and Other (Topic 350): Simplifying the Test for Goodwill Impairment   

Company must compare each reporting unit’s carrying value to its fair value. If the carrying value exceeds fair value, an entity performs the second step, which assigns the reporting unit’s fair value to its assets and liabilities, including unrecognized assets and liabilities, in the same manner as required in purchase accounting and then records an impairment. This ASU eliminates the second step.


Under the new guidance, an impairment of a reporting unit’s goodwill is determined based on the amount by which the reporting unit’s carrying value exceeds its fair value, limited to the amount of goodwill allocated to the reporting unit.


prospective method of adoption.


Adoption of this standard did not have a material impact on the Company’s consolidated financial statements.

ASU 2018-13 , Fair Value Measurement (Topic 820): Disclosure Framework - Changes to the Disclosure Requirements for Fair Value Measurement   

The amendments in this Update modify the disclosure requirements on fair value measurements in Topic 820, Fair Value Measurements, based on the concepts in the Concepts Statement, including the consideration of costs and benefits. Certain disclosure requirements were either removed, modified, or added.


This guidance removes the requirement to disclose the amount of and reasons for transfers between Level 1 and Level 2 fair value measurement methodologies, the policy for timing of transfers between levels and the valuation processes for Level 3 fair value measurements. It also adds a requirement to disclose changes in unrealized gains and losses for the period included in other comprehensive income for recurring Level 3 fair value measurements held at the end of the reporting period and the range and weighted average of significant unobservable inputs used to develop Level 3 measurements. For certain unobservable inputs, entities

   January 2020    The adoption of this standard did not have a material impact on the Company’s consolidated financial statements.


F-123


Table of Contents

Finance of America Equity Capital LLC and Subsidiaries

Notes to Unaudited Consolidated Financial Statements


Standard    Description    Effective Date    Effect on Consolidated
Financial Statements
   may disclose other quantitative information in lieu of the weighted average if the other quantitative information would be a more reasonable and rational method to reflect the distribution of unobservable inputs used to develop Level 3 fair value measurements.      
ASU 2018-15 , Intangibles - Goodwill and Other - Internal-Use Software (Subtopic 350-40): Customer’s Accounting for Implementation Costs Incurred in a Cloud Computing Arrangement That Is a Service Contract    The amendments in this Update align the requirements for capitalizing implementation costs incurred in a hosting arrangement that is a service contract with the requirements for capitalizing implementation costs incurred to develop or obtain internal-use software (and hosting arrangements that include an internal-use software license).    January 2020   

The Company adopted this guidance using the prospective method of adoption.


Adoption of this standard did not have a material impact on the Company’s consolidated financial statements.

Recently Issued Accounting Guidance, Not Yet Adopted as of March 31, 2021


Standard    Description    Date of Planned
Adoption
   Effect on Consolidated
Financial Statements

ASU 2020-04, Reference Rate Reform (Topic 848): Facilitation of the Effects of Reference Rate Reform on Financial Reporting


ASU 2021-01, Reference Rate Reform (Topic 848): Codification Clarification


The amendments in this Update provide temporary optional expedients and exceptions for applying GAAP to contract modifications and hedging relationships, subject to meeting certain criteria, that reference London Inter-Bank Offered Rate (“LIBOR”) or other interbank offered rates expected to be discontinued.


In January 2021, FASB issued an Update which refines the scope of ASU Topic 848 and clarifies the guidance issued to facilitate the effects of reference rate reform on financial reporting. The amendment permits entities to elect certain optional expedients and exceptions when accounting for derivative contracts and certain hedging relationships affected by changes in the interest rates used for discounting cash flows, computing variation margin settlements and

   TBD   

This ASU is effective from March 12, 2020 through December 31, 2022.


If LIBOR ceases to exist or if the methods of calculating LIBOR change from the current methods for any reasons, interest rates on our floating rate loans, obligation derivatives, and other financial instruments tied to LIBOR rates, may be affected and need renegotiation with its lenders.


The Company is in the process of reviewing the potential impact that the adoption of this ASU


F-124


Table of Contents

Finance of America Equity Capital LLC and Subsidiaries

Notes to Unaudited Consolidated Financial Statements


Standard    Description    Date of Planned
Adoption
   Effect on Consolidated
Financial Statements
   calculating price alignment interest in connection with reference rate reform activities.       will have on the Company’s consolidated financial statements and related disclosures.


3.

Variable Interest Entities and Securitizations

The Company determined that the SPEs created in connection with its securitizations are VIEs. A VIE is an entity that has either a total equity investment that is insufficient to permit the entity to finance its activities without additional subordinated financial support or whose equity investors lack the characteristics of a controlling financial interest. A VIE is consolidated by its primary beneficiary, which is the entity that, through its variable interests has both the power to direct the activities that significantly impact the VIE’s economic performance and the obligations to absorb losses of the VIE that could potentially be significant to the VIE or the right to receive benefits from the VIE that could potentially be significant to the VIE.

Finance of America Commercial

Finance of America Commercial LLC (“FACo”) securitizes certain of its interests in fix & flip mortgages. The transactions provide debt security holders the ability to invest in a pool of performing loans secured by investment real estate. The transactions provide the Company with access to liquidity for the loans and ongoing management fees. The principal and interest on the outstanding debt securities are paid using the cash flows from the underlying loans, which serve as collateral for the debt. The Company has determined that the securitization structure meets the definition of a VIE. In its capacity as servicer of the securitized loans, the Company retains the power to direct the VIE’s activities that most significantly impact the VIEs economic performance. The Company has also retained certain beneficial interests in these trusts which provide exposure to potential gains and losses on the performance of the trust. As the Company has both the power to direct the activities that significantly impact the VIE’s economic performance and the obligations to absorb losses of the VIE that could potentially be significant to the VIE or the right to receive benefits from the VIE that could potentially be significant to the VIE, the Company has determined it meets the definition of the primary beneficiary and consolidates the trusts.

Certain obligations may arise from the agreements associated with transfers of loans. Under these agreements, the Company may be obligated to repurchase the loans, or otherwise indemnify or reimburse the investor for losses incurred due to material breach of contractual representations and warranties.

For the three months ended March 31, 2021 and 2020, there were no charge-offs associated with these transferred mortgage loans related to the standard securitization representations and warranties obligations.

Finance of America Reverse

Finance of America Reverse LLC (“FAR”) securitizes certain of its interests in non-performing reverse mortgages and non-agency reverse mortgage loans. The transactions provide investors with the ability to invest in a pool of reverse mortgage loans secured by one-to-four-family residential properties. The transactions provide FAR with access to liquidity for these assets, ongoing servicing fees, and potential residual returns. The principal and interest on the outstanding certificates are paid using the cash flows from the underlying reverse mortgage loans, which serve as collateral for the debt. The securitizations are callable at or following the optional redemption date as defined in the respective indenture agreements. FAR has determined that these securitization structures meet the definition of VIEs. In its capacity as servicer of the securitized loans, the Company retains the


F-125


Table of Contents

Finance of America Equity Capital LLC and Subsidiaries

Notes to Unaudited Consolidated Financial Statements


power to direct the VIE’s activities that most significantly impact the VIEs economic performance. The Company has also retained certain beneficial interests in these trusts which provide exposure to potential gains and losses on the performance of the trust. As the Company has both the power to direct the activities that significantly impact the VIE’s economic performance and the obligations to absorb losses or the right to receive benefits from the VIE that could potentially be significant to the VIE, the Company has determined it meets the definition of the primary beneficiary and consolidates the trusts.

In February 2021, the Company executed its optional redemption of outstanding securitized notes related to outstanding nonperforming HECM securitizations. As part of the optional redemption, the Company paid off notes with an outstanding principal balance of $294.2 million. The notes were paid off at par.

The following table presents the assets and liabilities of the Company’s consolidated VIEs, which are included in the Consolidated Statements of Financial Condition and excludes intercompany balances, except for retained bonds (in thousands):


     March 31, 2021      December 31, 2020  

ASSETS


Restricted cash

   $ 287,238      $ 293,580  

Mortgage loans held for investment, subject to nonrecourse debt, at fair value


2021 FASST HB1

     520,850        —    

2019 FASST JR2

     462,022        488,760  

2018 FASST JR1

     421,710        449,069  

2019 FASST JR3

     420,389        450,703  

2020 FASST HB2

     394,767        398,480  

2020 FASST JR3

     359,678        372,015  

2019 FASST JR4

     347,459        377,265  

2020 FASST JR2

     324,100        341,439  

2020 FASST S3

     317,752        316,774  

2019 FASST JR1

     312,802        331,244  

2020 FASST S2

     306,426        311,721  

2018 FASST JR2

     249,180        264,622  

2020 FASST JR1

     244,019        263,266  

2020 FASST JR4

     223,090        237,100  

2020 FASST S1

     185,224        189,243  

2020 RTL1 ANTLR

     95,217        137,989  

2018 RTL1 ANTLR

     54,496        82,393  

2019 RTL1 ANTLR

     52,263        118,161  

2020 FASST HB1

     —          265,923  

Other assets

     59,438        79,528  


TOTAL ASSETS

   $ 5,638,120      $ 5,769,275  


F-126


Table of Contents

Finance of America Equity Capital LLC and Subsidiaries

Notes to Unaudited Consolidated Financial Statements


     March 31, 2021      December 31, 2020  

LIABILITIES


Nonrecourse debt, at fair value


2021 FASST HB1

   $ 563,751      $ —    

2019 FASST JR2

     470,414        487,966  

2020 FASST HB2

     459,942        474,599  

2018 FASST JR1

     448,296        458,279  

2019 FASST JR3

     422,975        445,691  

2019 FASST JR4

     351,393        368,963  

2020 FASST JR3

     350,833        354,762  

2019 FASST JR1

     326,535        343,544  

2020 FASST JR2

     308,899        313,057  

2020 FASST S2

     308,503        314,144  

2020 FASST S3

     304,985        309,713  

2018 FASST JR2

     264,125        269,741  

2020 FASST JR1

     241,888        250,988  

2020 FASST JR4

     213,752        228,804  

2020 FASST S1

     185,473        191,189  

2020 RTL1 ANTLR

     90,696        140,839  

2018 RTL1 ANTLR

     43,648        80,767  

2019 RTL1 ANTLR

     40,930        127,981  

2020 FASST HB1

     —          298,914  

Payables and other liabilities

     171        291  


TOTAL LIABILITIES

   $ 5,397,209      $ 5,460,232  


4.

Acquisitions

Renovate America Inc.

On March 26, 2021, the Company acquired certain assets of Renovate America Inc. (“RAI”) in an asset purchase agreement for $43.5 million. The transaction will be accounted for using the acquisition method, including $36.0 million in total assets acquired resulting from the purchase have been initially recorded, consisting primarily of purchased loans, with the remaining $7.5 million of the purchase price being allocated to goodwill. Under the acquisition method of accounting, RAI’s assets and liabilities will be recorded at estimated fair value as of the acquisition date with the excess of the purchase price over the estimated fair values of the net assets acquired, if applicable, recognized as goodwill.

Additional disclosures required by ASC 805, Business Combinations, with respect to the acquisition have been omitted because the information needed for the disclosures is not currently available due to the close proximity of closing of this transaction with the date these consolidated financial statements are being issued.


5.

Fair Value

ASC 820, Fair Value Measurement (“ASC 820”), defines fair value as the price that would be received to sell an asset or paid to transfer a liability in an orderly transaction between market participants at the measurement date. Fair value is based on the assumptions market participants would use when pricing an asset or liability and follows a fair value hierarchy that prioritizes the information used to develop those assumptions. The fair value


F-127


Table of Contents

Finance of America Equity Capital LLC and Subsidiaries

Notes to Unaudited Consolidated Financial Statements


hierarchy gives the highest priority to quoted prices available in active markets (i.e., observable inputs) and the lowest priority to data lacking transparency (i.e., unobservable inputs). An instrument’s categorization within the fair value hierarchy is based on the lowest level of significant input to its valuation.

All aspects of nonperformance risk, including the Company’s own credit standing, are considered when measuring the fair value of a liability.

Following is a description of the three levels:

Level 1 Inputs: Quoted prices for identical instruments in active markets.

Level 2 Inputs: Quoted prices for similar instruments in active markets; quoted prices for identical or similar instruments in markets that are not active; and model-derived valuations whose inputs are observable or whose significant value drivers are observable.

Level 3 Inputs: Instruments with unobservable inputs that are significant to the fair value measurement.

The Company classifies assets in their entirety based on the lowest level of input that is significant to the fair value measurement. The Company recognizes transfers between levels of the fair value hierarchy as of the end of the reporting period. There were no transfers within the hierarchy for the three months ended March 31, 2021 and 2020.

Following are descriptions of the valuation methodologies used to measure material assets and liabilities at fair value and the details of the valuation models, key inputs to those models and significant assumptions utilized.

Reverse Mortgage Loans Held for Investment, Subject to HMBS Related Obligations, at Fair Value

HECM loans securitized into Ginnie Mae “GNMA” HMBS are not actively traded in open markets with readily observable market prices.

The Company values HECM loans securitized into GNMA HMBS utilizing a present value methodology that discounts estimated projected cash flows over the life of the loan portfolio using prepayment, borrower mortality, borrower draw and discounts rate assumptions management believes a market participant would use in estimating fair value. The significant unobservable inputs used in the measurement include:

Conditional Repayment Rate - the Company projects borrower prepayment rates which considers borrower age and gender and is based on historical termination rates. The outputs of borrower prepayment rates, which include both voluntary and involuntary prepayments, are utilized to anticipate future terminations.

Loss Frequency/Severity - termination proceeds are adjusted for expected loss frequencies and severities to arrive at net proceeds that will be provided upon final resolution. Historical experience is utilized to estimate the loss rates resulting from scenarios where FHA insurance proceeds are not expected to cover all principal and interest outstanding and, as servicer, the Company is exposed to losses upon resolution of the loan. Loss frequency and severities are based upon the historical experience with specific loan resolution waterfalls.

Due and Payable Triggers - the input for terminations not attributable to an FHA assignment is based on historical foreclosure and liquidation experience.

Discount Rate - derived based upon reference to yields required by market participants for recent transactions in the HECM loan bulk market adjusted based upon weighted average life of the loan portfolio.


F-128


Table of Contents

Finance of America Equity Capital LLC and Subsidiaries

Notes to Unaudited Consolidated Financial Statements


This rate reflects what the Company believes to be a market participant’s required yield on HECM loans of similar weighted average lives. The yield spread is applied over interpolated benchmark curve or as a spread over collateral forward curve.

Borrower Draw Rates - the draw curve is estimated based upon the historical experience with the specific product type contemplating the borrower’s age and loan age.

Changes to any of these assumptions could result in significantly different valuation results. The Company classifies reverse mortgage loans held for investment as Level 3 assets within the GAAP hierarchy, as they are dependent on unobservable inputs.

The following table presents the weighted average significant unobservable inputs used in the fair value measurement of reverse mortgage loans held for investment, subject to HMBS related obligations, for the periods indicated:


     March 31, 2021     December 31, 2020  
     Range of Input      Weighted Average
of Input
    Range of Input      Weighted Average
of Input
 

Conditional repayment rate

     NM        20.9     NM        20.0

Loss frequency(1)

     NM        4.0     NM        4.4

Loss severity(1)

     4.9% - 13.1%        5.2     5.1% - 13.3%        5.4

Discount rate

     NM        2.0     NM        1.6

Average draw rate

     NM        1.1     NM        1.1

“NM” - these “Not Meaningful” inputs do not have an applicable range, as they are a single derived input.    


(1)

Loss frequency and severity represents the frequency of losses and the losses associated with loans that are liquidated through a foreclosure sale, net of claim proceeds.

The Company aggregates loan portfolios based upon the underlying securitization trust and values these loans using these aggregated pools. The range of inputs provided above are based upon the range of inputs utilized for each securitization trust.

Mortgage Loans Held for Investment, Subject to Nonrecourse Debt, at Fair Value

Reverse Mortgage Loans

Reverse mortgage loans held for investment, subject to nonrecourse debt, include HECM loans previously purchased out of GNMA HMBS pools and non FHA-insured jumbo reverse mortgages, which have been subsequently securitized and serve as collateral for the issued debt. These loans are not traded in active and open markets with readily observable market prices. The Company classifies reverse mortgage loans held for investment, subject to nonrecourse debt as Level 3 assets within the GAAP hierarchy.

HECM Buyouts - Securitized (Nonperforming)

The Company values HECM buyouts utilizing a present value methodology that discounts estimated projected cash flows over the life of the portfolio using conditional repayment, loss frequency and severity, borrower mortality, and discount rate assumptions management believes a market participant would use in estimating fair value.


F-129


Table of Contents

Finance of America Equity Capital LLC and Subsidiaries

Notes to Unaudited Consolidated Financial Statements


The following table presents the weighted average significant unobservable inputs used in the fair value measurement of these assets and liabilities for the periods indicated:


     March 31, 2021     December 31, 2020  
     Range of Input      Weighted
Average of Input
    Range of Input      Weighted
Average of Input
 

Conditional repayment rate

     NM        42.6     NM        42.9

Loss frequency(1)

     25.0% - 100.0%        52.3     25.0% - 100.0%        54.8

Loss severity(1)

     4.9% - 13.1%        7.5     5.1% - 13.3%        7.5

Discount rate

     NM        3.6     NM        4.1

“NM” - these “Not Meaningful” inputs do not have an applicable range, as they are a single derived input.    


(1)

Loss frequency and severity represents the frequency of losses and the losses associated with loans that are liquidated through a foreclosure sale, net of claim proceeds.

The Company aggregates loan portfolios based upon the underlying securitization trust and values these loans using these aggregated pools. The range of inputs provided above are based upon the range of inputs utilized for each securitization trust.

HECM Buyouts - Securitized (Performing)

The Company values securitized HECM buyouts utilizing a present value methodology that discounts estimated projected cash flows over the life of the portfolio using conditional repayment, loss frequency and severity, borrower mortality, and discount rate assumptions management believes a market participant would use in estimating fair value.

The following table presents the weighted average significant unobservable inputs used in the fair value measurement of these assets and liabilities for the periods indicated:


     March 31, 2021     December 31, 2020  
     Range of Input      Weighted Average
of Input
    Range of Input      Weighted Average
of Input
 

Weighted-average remaining life in years

     NM        8.6       NM        8.5  

Conditional repayment rate

     NM        13.7     NM        14.7

Loss severity(1)

     4.9% - 13.1%        8.5     5.1% - 13.3%        7.7

Discount rate

     NM        3.7     NM        3.5

“NM” - these “Not Meaningful” inputs do not have an applicable range, as they are a single derived input.


(1) 

Loss severity represents the losses associated with loans that are liquidated through a foreclosure sale, net of claim proceeds.

The Company aggregates loan portfolios based upon the underlying securitization trust and values these loans using these aggregated pools. The range of inputs provided above are based upon the range of inputs utilized for each securitization trust.


F-130


Table of Contents

Finance of America Equity Capital LLC and Subsidiaries

Notes to Unaudited Consolidated Financial Statements


Non-Agency Reverse Mortgage - Securitized

The Company values securitized non-agency reverse mortgage loans utilizing a present value methodology that discounts estimated projected cash flows over the life of the loan portfolio using repayment, home price appreciation, pool-level losses, and discount rate assumptions. The following table presents the significant unobservable inputs used in the fair value measurements of non-agency reverse mortgage loans for the periods indicated:


     March 31, 2021     December 31, 2020  
     Range of Input      Weighted Average
of Input
    Range of Input      Weighted Average
of Input
 

Weighted-average remaining life in years

     NM        7.1       NM        6.9  

Loan to value

     0.1% - 74.4%        49.0     9.0% - 73.1%        48.2

Conditional repayment rate

     NM        18.8     NM        18.7

Loss severity(1)

     NM        10.0     NM        10.0

Home price appreciation

     3.9% - 8.8%        6.0     1.1% - 8.9%        5.6

Discount rate

     NM        4.0     NM        3.6

“NM” - these “Not Meaningful” inputs do not have an applicable range, as they are a single derived input.


(1)

Loss severity represents the losses associated with loans that are liquidated through a foreclosure sale, net of claim proceeds.

The Company aggregates loan portfolios based upon the underlying securitization trust and values these loans using these aggregated pools. The range of inputs provided above are based upon the range of inputs utilized for each securitization trust.

Commercial Mortgage Loans

Fix & Flip - Securitized

The Fix & Flip loans are short-term loans for individual real estate investors, with terms ranging from 9-18 months. This product is valued using a discounted cash flow model. The Company classifies these mortgage loans as Level 3 assets within the GAAP hierarchy.

The Company utilized the following weighted average assumptions in estimating the fair value of fix & flip mortgage loans for the periods indicated:


     March 31, 2021     December 31, 2020  
     Range of Input      Weighted Average
of Input
    Range of Input      Weighted Average
of Input
 

Prepayment rate (SMM)

     NM        18.6     NM        17.1

Discount rate

     6.6% - 10.0%        6.6     6.7% - 10.0%        6.7

Loss frequency(1)

     0.0% - 65.0%        0.8     0.2% - 44.0%        0.6

“NM” - these “Not Meaningful” inputs do not have an applicable range, as they are a single derived input.    


(1) 

Loss frequency represents the frequency of losses associated with loans that are liquidated through a foreclosure sale, net of claim proceeds.


F-131


Table of Contents

Finance of America Equity Capital LLC and Subsidiaries

Notes to Unaudited Consolidated Financial Statements


The Company aggregates loan portfolios based upon the underlying securitization trust and values these loans using these aggregated pools. The range of inputs provided above are based upon the range of inputs utilized for each securitization trust.

Mortgage Loans Held for Investment, at Fair Value

Reverse Mortgage Loans

Reverse mortgage loans held for investment, at fair value, consists of originated or purchased HECM and non-agency reverse mortgage loans not yet securitized, unsecuritized tails, and certain HECMs purchased out of GNMA HMBS (“Inventory Buyouts”) that the Company intends to securitize for purposes of serving as collateral for future securitization transfers.

Originated or purchased HECM loans held for investment are valued predominantly by utilizing forward HMBS prices for similar pool characteristics and based on observable market data. These amounts are further adjusted to include future cash flows that would be earned for servicing the HECM loan over the life of the asset.

Unsecuritized tails consists of performing and nonperforming repurchased loans. The fair value of performing unsecuritized tails are valued at current pricing levels for similar GNMA HMBS. The fair value of nonperforming unsecuritized tails is based on expected claim proceeds from HUD upon assignment of the loans.

The fair value of repurchased loans is based on expected cash proceeds of the liquidation of the underlying properties and expected claim proceeds from HUD. The primary assumptions utilized in valuing nonperforming repurchased loans include loss frequency and loss severity. Termination proceeds are adjusted for expected loss frequencies and severities to arrive at net proceeds that will be provided upon final resolution, including assignments to FHA. Historical experience is utilized to estimate the loss rates resulting from scenarios where FHA insurance proceeds are not expected to cover all principal and interest outstanding and as servicer, the Company is exposed to losses upon resolution of the loan.

The Company classifies reverse mortgage loans held for investment, at fair value as Level 3 assets within the GAAP hierarchy.

Inventory Buyouts

The fair value of Inventory Buyouts is based on the expected cash proceeds of the liquidation of the underlying properties and expected claim proceeds from HUD. The primary assumptions utilized in valuing Inventory Buyouts include loss frequency and loss severity. Termination proceeds are adjusted for expected loss frequencies and severities to arrive at net proceeds that will be provided upon final resolution, including assignments to FHA. Historical experience is utilized to estimate the loss rates resulting from scenarios where FHA insurance proceeds are not expected to cover all principal and interest outstanding and as servicer, the Company is exposed to losses upon resolution of the loan.

The Company values Inventory Buyouts utilizing a present value methodology that discounts estimated projected cash flows over the life of the portfolio using conditional repayment, loss frequency and severity, borrower mortality, and discount rate assumptions management believes a market participant would use in estimating fair value.


F-132


Table of Contents

Finance of America Equity Capital LLC and Subsidiaries

Notes to Unaudited Consolidated Financial Statements


The following table presents the weighted average significant unobservable inputs used in the fair value measurement of Inventory Buyouts classified as reverse mortgage loans held for investment for the periods indicated:


     March 31, 2021     December 31, 2020  
     Range of Input      Weighted Average
of Input
    Range of Input      Weighted Average
of Input
 

Conditional repayment rate

     NM        52.6     NM        44.0

Loss frequency(1)

     NM        64.5     NM        46.9

Loss severity(1)

     NM        12.0     NM        10.5

Discount rate

     NM        3.6     NM        4.1

“NM” - these “Not Meaningful” inputs do not have an applicable range, as they are a single derived input.


(1) 

Loss frequency and severity represents the frequency of losses and the losses associated with loans that are liquidated through a foreclosure sale, net of claim proceeds.

Non-Agency Reverse Mortgage Loans

The fair value of non-agency reverse mortgage loans is based on values for investments with similar investment grade ratings and the value the Company would expect to receive if the whole loans were sold to an investor. The Company values non-agency reverse mortgage loans utilizing a present value methodology that discounts estimated projected cash flows over the life of the loan portfolio using prepayment, home price appreciation, pool-level losses, cost to service, and discount rates.

The following table presents the weighted average significant unobservable inputs used in the fair value measurement of non-agency reverse mortgage loans classified as reverse mortgage loans held for investment for the periods indicated:


     March 31, 2021     December 31, 2020  
     Range of Input      Weighted Average
of Input
    Range of Input      Weighted Average
of Input
 

Weighted-average remaining life in years

     NM        8.0       NM        8.0  

Loan to value

     0.4% - 63.2%        46.0     0.1% - 62.1%        44.0

Conditional repayment rate

     NM        16.9     NM        16.8

Loss severity(1)

     NM        10.0     NM        10.0

Home price appreciation

     3.9% - 8.8%        6.0     1.1% - 8.9%        5.5

Discount rate

     NM        4.0     NM        3.6

“NM” - these “Not Meaningful” inputs do not have an applicable range, as they are a single derived input.


(1)

Loss severity represents the losses associated with loans that are liquidated through a foreclosure sale, net of claim proceeds.


F-133


Table of Contents

Finance of America Equity Capital LLC and Subsidiaries

Notes to Unaudited Consolidated Financial Statements


Commercial Mortgage Loans

Agricultural Loans

The agricultural loans are government-insured loans made to farmers to fund their inputs and operating expenses for the upcoming growing season with terms ranging from 7 - 17 months. The product is valued using a discounted cash flow model. The Company classifies these mortgage loans as Level 3 assets within the GAAP hierarchy.

The Company utilized the following assumptions in estimating the fair value of loans for the periods indicated:


     March 31, 2021     December 31, 2020  
     Range of Input      Weighted Average
of Input
    Range of Input      Weighted Average
of Input
 

Discount rate

     NM        4.9     NM        6.4

Prepayment rate (CPR)

     11.0% - 100.0%        21.6     0% - 1.0%        0.7 

Default rate (CDR)

     0.0% - 2.0%        1.0     0% - 2.0%        0.4 

“NM” - these “Not Meaningful” inputs do not have an applicable range, as they are a single derived input.

Fix & Flip

The fix & flip loans are short-term loans for individual real estate investors, with terms ranging from 9-18 months. This product is valued using a discounted cash flow model. The Company classifies these mortgage loans as Level 3 assets within the GAAP hierarchy.

The Company utilized the following weighted average assumptions in estimating the fair value of fix & flip mortgage loans for the periods indicated:


     March 31, 2021  
     Range of Input      Weighted Average
of Input
 

Prepayment rate (SMM)

     NM        12.1

Discount rate

     6.6% - 10.0%        6.7

Loss frequency(1)

     NM        0.4

“NM” - these “Not Meaningful” inputs do not have an applicable range, as they are a single derived input.


(1) 

Loss frequency represents the frequency of losses associated with loans that are liquidated through a foreclosure sale, net of claim proceeds.

As of March 2021, management made the decision to change the classification of fix & flip loans from mortgage loans held for sale, at fair value, to mortgage loans held for investment, at fair value.

Mortgage Loans Held for Sale, at Fair Value

Reverse Mortgage Loans

Reverse mortgage loans held for sale, at fair value, consists of unpoolable loans that the Company intends to sell to third party investors. Reverse mortgage loans held for sale consists primarily of performing repurchased loans. The fair value of performing unpoolable loans is based on expected claim proceeds from HUD upon assignment


F-134


Table of Contents

Finance of America Equity Capital LLC and Subsidiaries

Notes to Unaudited Consolidated Financial Statements


of the loans. In certain instances the loan balance may exceed the maximum claim amount (“MCA”). In these instances, the fair value is based on expected proceeds from sale of the underlying property and any additional HUD claim proceeds. The Company classifies reverse mortgage loans held for sale as Level 3 assets within the GAAP hierarchy.

Residential and Commercial Mortgage Loans

Mortgage loans held for sale include residential and commercial mortgage loans originated by the Company and held until sold to secondary market investors. The Company primarily originates conventional GSEs and government (FHA and Department of Veterans Affairs) residential mortgage loans (collectively “residential mortgage loans held for sale”) and recourse and nonrecourse commercial mortgage loans to owners and investors of single and multi-family residential rental properties (“commercial loans held for sale”).

Residential Mortgage Loans

The Company originates or purchases mortgage loans in the U.S. that it intends to sell to FNMA, FHLMC, and GNMA (collectively “the Agencies”). Additionally, the Company originates or purchases mortgage loans in the U.S. that it intends to sell into the secondary markets via whole loan sales. Mortgage loans held for sale are typically pooled and sold into certain exit markets, depending upon underlying attributes of the loan, such as agency eligibility, product type, interest rate, and credit quality. In addition, the Company may originate loans that do not meet specific underwriting criteria and are not eligible to be sold to the Agencies. Two valuation methodologies are used to determine the fair value of mortgage loans held for sale. The methodology used depends on the exit market as described below:

Loans valued using observable market prices for identical or similar assets - This includes all mortgage loans that can be sold to the Agencies, which are valued predominantly by published forward agency prices. This will also include all non-agency loans where recently negotiated market prices for the loan pool exist with a counterparty (which approximates fair value), or quoted market prices for similar loans are available. As these valuations are derived from quoted market prices, the Company classified these valuations as Level 2 in the fair value disclosures. During periods of illiquidity of the mortgage marketplace, it may be necessary to look for alternative sources of value, including the whole loan purchase market for similar loans, and place more reliance on the valuations using internal models.

Loans valued using internal models – To the extent observable market prices are not available, the Company will determine the fair value of mortgage loans held for sale using a collateral based valuation model, which approximates expected cash proceeds on liquidation. For loans where bid prices or commitment prices are unavailable, these valuation models estimate the exit price the Company expects to receive in the loan’s principal market and are based on a combination of recent appraisal values, adjusted for certain loss factors. The Company classifies these valuations as Level 3 in the fair value disclosures.

Commercial Mortgage Loans

The Company primarily originates two separate commercial loan products that it classifies as held for sale: Single Rental Loan (“SRL”) and Portfolio Lending.


F-135


Table of Contents

Finance of America Equity Capital LLC and Subsidiaries

Notes to Unaudited Consolidated Financial Statements


SRL

The SRL product is designed for small/individual real estate investors looking to purchase and then rent-out a single property. These are 30-year loans with fixed interest rates typically between 5.0% - 8.0%. This product is valued using a discounted cash flow model. The Company classifies these mortgage loans as Level 3 assets within the GAAP hierarchy.

The Company utilized the following weighted average assumptions in estimating the fair value of SRL mortgage loans held for sale for the periods indicated:


     March 31, 2021     December 31, 2020  
     Range of Input      Weighted Average
of Input
    Range of Input      Weighted Average
of Input
 

Prepayment rate (CPR)

     1.0% - 16.9%        14.0     1.0% - 17.1%        15.4

Discount rate

     NM        3.7     NM        5.0

Default rate (CDR)

     1.0% - 54.0%        2.7     1.0% - 64.9%        3.6

“NM” - these “Not Meaningful” inputs do not have an applicable range, as they are a single derived input.

Portfolio Lending

The Portfolio product is designed for larger investors with multiple properties. Specifically, these loans are useful for consolidating multiple rental property mortgages into a single loan. These loans have fixed coupons that typically range from 5.0% - 6.2%, with 5 and 10-year balloon structures, as well as a 30 year structure. This product is valued using a discounted cash flow model. The Company classifies these mortgage loans as Level 3 assets within the GAAP hierarchy.

The Company utilized the following weighted average assumptions in estimating the fair value of Portfolio mortgage loans held for sale for the periods indicated:


     March 31, 2021     December 31, 2020  
     Range of Input      Weighted Average
of Input
    Range of Input      Weighted Average
of Input
 

Prepayment rate (CPR)

     0.0% - 15.0%        5.8     0% - 15.0%        9.3

Discount rate

     NM        4.1     NM        4.9

Default rate (CDR)

     1.0% - 30.2%        1.9     1.0% - 42.7%        2.0

“NM” - these “Not Meaningful” inputs do not have an applicable range, as they are a single derived input.

Due to limited sales activity and periodically unobservable prices in certain of the Company’s markets, certain mortgage loans held for sale portfolios may transfer from Level 2 to Level 3 in future periods.

Fix & Flip

The Fix & Flip loans are short-term loans for individual real estate investors, with terms ranging from 9-18 months. This product is valued using a discounted cash flow model. The Company classifies these mortgage loans as Level 3 assets within the GAAP hierarchy.


F-136


Table of Contents

Finance of America Equity Capital LLC and Subsidiaries

Notes to Unaudited Consolidated Financial Statements


The Company utilized the following weighted average assumptions in estimating the fair value of fix & flip mortgage loans for the periods indicated:


     December 31, 2020  
     Range of Input      Weighted Average
of Input
 

Prepayment rate (SMM)

     NM        12.4

Discount rate

     6.7% - 10.0%        7.2

Loss frequency(1)

     NM        0.8

“NM” - these “Not Meaningful” inputs do not have an applicable range, as they are a single derived input.


(1)

Loss frequency represents the frequency of losses associated with loans that are liquidated through a foreclosure sale, net of claim proceeds.

As of March 2021, management made the decision to change the classification of fix & flip loans from mortgage loans held for sale, at fair value, to mortgage loans held for investment, at fair value.

Mortgage Servicing Rights

As of March 31, 2021 and December 31, 2020, the Company valued mortgage servicing rights internally. The significant assumptions utilized to determine fair value are projected prepayments using the Public Securities Association Standard Prepayment Model, discount rates, and projected servicing costs that vary based on the loan type and delinquency. The Company classifies these valuations as Level 3 since they are dependent on unobservable inputs.

Fair value is derived through a discounted cash flow analysis and calculated using a computer pricing model. This computer valuation is based on the objective characteristics of the portfolio (loan amount, note rate, etc.) and commonly used industry assumptions (PSAs, etc.). The assumptions taken into account by the pricing model are those which many active purchasers of servicing employ in their evaluations of portfolios for sale in the secondary market. The unique characteristics of the secondary servicing market often dictate adjustments to parameters over short periods of time.

Subjective factors are also considered in the derivation of fair values, including levels of supply and demand for servicing, interest rate trends, and perception of risk not incorporated into prepayment assumptions.

Fair value is defined as the estimated price at which the servicing would change hands in the marketplace between a willing buyer and seller. The valuation assumes that neither party would be under any compulsion to buy or sell and that each has reasonably complete and accurate knowledge of all relevant aspects of the offered servicing. The fair values represented in this analysis have been derived under the assumptions that sufficient time would be available to market the portfolio.

The following tables summarize certain information regarding the servicing portfolio of retained MSRs for the periods indicated:


     March 31, 2021     December 31, 2020  

Capitalization servicing rate

     1.0     0.8

Capitalization servicing multiple

     4.0       3.2  

Weighted-average servicing fee (in basis points)

     25       25  


F-137


Table of Contents

Finance of America Equity Capital LLC and Subsidiaries

Notes to Unaudited Consolidated Financial Statements


The significant assumptions used in estimating the fair value of MSRs were as follows (in annual rates):


     March 31, 2021     December 31, 2020  
     Range of Input     Weighted
Average of Input
    Range of Input     Weighted
Average of Input
 

Weighted-average prepayment speed (CPR)

     8.5% - 18.1     8.6     6.6% - 24.9     12.1

Discount rate

     NM       11.4     NM       12.1

Weighted-average delinquency rate

     1.1% - 9.3     1.3     1.2% - 9.2     1.3

“NM” - these “Not Meaningful” inputs do not have an applicable range, as they are a single derived input.    

The following table summarizes the estimated change in the fair value of MSRs from adverse changes in the significant assumptions (in thousands):


     March 31, 2021  
     Weighted
Average
Prepayment
Speed
     Discount
Rate
     Weighted
Average

Delinquency
Rate
 

Impact on fair value of 10% adverse change

   $ (8,881    $ (11,234    $ (195

Impact on fair value of 20% adverse change

     (17,195      (21,550      (390

These sensitivities are hypothetical and should be evaluated with care. The effect on fair value of a 10% variation in assumptions generally cannot be determined because the relationship of the change in assumptions to the fair value may not be linear. Additionally, the impact of a variation in a particular assumption on the fair value is calculated while holding other assumptions constant. In reality, changes in one factor may lead to changes in other factors, which could impact the above hypothetical effects.

Derivative Assets and Liabilities

Some of the derivatives held by the Company are exchange-traded or traded within highly active dealer markets. In order to determine the fair value of these instruments, the Company utilizes the exchange price or dealer market price for the particular derivative contract; therefore, these contracts are classified as Level 1. In addition, the Company enters into IRLCs with prospective borrowers. Commitments to fund residential mortgage loans with potential borrowers are a binding agreement to lend funds to these potential borrowers at a specified interest rate within a specified period of time. The fair value of IRLCs is derived from the fair value of similar mortgage loans or bonds, which is based on observable market data. Changes to the fair value of IRLCs are recognized based on changes in interest rates, changes in the probability that the commitment will be exercised (pull through factor), and the passage of time. The expected net future cash flows related to the associated servicing of the loan are included in the fair value measurement of IRLCs. The Company adjusts the outstanding IRLCs with prospective borrowers based on an expectation that it will be exercised and the loan will be funded. Given the unobservable nature of the pull through factor, IRLCs are classified as Level 3.

In addition, the Company executes derivative contracts, including forward commitments, TBAs, interest rate swaps, and interest rate swap futures, as part of its overall risk management strategy related to its reverse mortgage and commercial loan portfolios. The value of the forward commitments is estimated using current market prices for HMBS and are considered Level 3 in the fair value hierarchy. TBAs are valued based on


F-138


Table of Contents

Finance of America Equity Capital LLC and Subsidiaries

Notes to Unaudited Consolidated Financial Statements


forward dealer marks from the Company’s approved counterparties and are considered Level 2 in the fair value hierarchy. The value of interest rate swaps and interest rate swap futures is based on the exchange price or dealer market prices. The Company classifies interest rate swaps as Level 2 in the fair value hierarchy. The Company classifies interest rate swap futures as Level 1 in the fair value hierarchy. The value of the forward MBS is based on forward prices with dealers in such securities or internally-developed third party models utilizing observable market inputs. The Company classifies forward MBS as Level 2 in the fair value hierarchy.

Investments, at Fair Value

The Company invests in the equity of other companies in the form of common stock, preferred stock, or other in-substance equity interests. To the extent market prices are not observable, the Company engages third-party valuation experts to assist in determining the fair value of these investments. The values are determined utilizing a market approach which estimates fair value based on what other participants in the market have paid for reasonably similar assets that have been sold within a reasonable period from the valuation date. The Company classifies these valuations as Level 3 in the fair value disclosures.

HMBS Related Obligations, at Fair Value

The HMBS related obligation valuation considers the obligation to pass FHA insured cash flows through to the beneficial interest holders (repayment of secured borrowing) of the HMBS securities and the servicer and issuer obligations of the Company.

The valuation of the obligation to repay the secured borrowing is estimated using Level 3 unobservable market inputs. The estimated fair value is based on the net present value of projected cash flows over the estimated life of the liability. The estimated fair value of the HMBS related obligations also includes the consideration required by a market participant to transfer the HECM and HMBS servicing obligations including exposure resulting from shortfalls in FHA insurance proceeds.

The Company’s valuation considers assumptions that it believes a market participant would consider in valuing the liability, including, but not limited to, assumptions for repayment, costs to transfer servicing obligations, shortfalls in FHA insurance proceeds, and discount rates. The significant unobservable inputs used in the measurement include:

Borrower Repayment Rates - the conditional repayment rate curve considers borrower age and gender is based on historical termination rates.

Discount Rate - derived based on an assessment of current market yields and spreads that a market participant would consider for entering into an obligation to pass FHA insured cash flows through to holders of the HMBS beneficial interests. Yield spread applied over interpolated benchmark curve or as a spread over collateral forward curve.

The following table presents the weighted average significant unobservable inputs used in the fair value measurement of HMBS related obligations for the periods indicated:


     March 31, 2021     December 31, 2020  
     Range of Input      Weighted Average
of Input
    Range of Input      Weighted Average
of Input
 

Conditional repayment rate

     NM        20.7     NM        19.9

Discount rate

     NM        1.9     NM        1.4

“NM” - these “Not Meaningful” inputs do not have an applicable range, as they are a single derived input.    


F-139


Table of Contents

Finance of America Equity Capital LLC and Subsidiaries

Notes to Unaudited Consolidated Financial Statements


Nonrecourse Debt

Reverse Mortgage Loans

Outstanding notes issued that are securitized by nonrecourse debt are paid using the cash flows from the underlying reverse mortgage loans, which serve as collateral for the debt. Nonrecourse debt is estimated using Level 3 unobservable market inputs. The estimated fair value is based on the net present value of projected cash flows over the estimated life of the liability. The significant unobservable inputs used in the measurement include:

Weighted Average Remaining Life - the projected remaining life is based on the expected conditional prepayment rate, which is utilized to determine future terminations.

Borrower Repayment Rates - the conditional repayment rate curve considers borrower age and gender is based on historical termination rates.

Discount Rate - derived based on an assessment of current market yields and spreads that a market participant would consider for entering into an obligation to pass FHA insured cash flows through to holders of the HMBS beneficial interests. Yield spread applied over interpolated benchmark curve or as a spread over collateral forward curve.

The Company’s valuation considers assumptions that it believes a market participant would consider in valuing the liability, including, but not limited to, assumptions for prepayment and discount rates. The following table presents the weighted average significant unobservable inputs used in the fair value measurements of nonrecourse debt for the periods indicated:


     March 31, 2021     December 31, 2020  
     Range of Input     Weighted
Average of
Input
    Range of Input     Weighted
Average of
Input
 

Performing/Nonperforming HECM securitizations


Weighted-average remaining life (in years)

     0.9 -1.3       1.1       0.2 - 1.5       1.0  

Conditional repayment rate

     20.6% - 32.0     25.7     34.3% - 56.3     42.8

Discount rate

     NM       2.2     NM       3.1

Securitized Non-Agency Reverse


Weighted-average remaining life (in years)

     0.1 - 2.6       1.9       0.3 - 2.7       2.1  

Conditional repayment rate

     20.5% - 100.0     28.2     19.6% -35.8     23.9

Discount rate

     NM       2.3     NM       2.2

“NM” - these “Not Meaningful” inputs do not have an applicable range, as they are a single derived input.    

Commercial Mortgage Loans

Outstanding nonrecourse notes issued that are securitized by loans held for investment, subject to nonrecourse debt, are paid using the cash flows from the underlying mortgage loans. The fair value of nonrecourse debt is estimated using Level 3 unobservable market inputs. The estimated fair value is based on the net present value of projected cash flows over the estimated life of the liability.


F-140


Table of Contents

Finance of America Equity Capital LLC and Subsidiaries

Notes to Unaudited Consolidated Financial Statements


The Company’s valuation considers assumptions that it believes a market participant would consider in valuing the liability, including, but not limited to, assumptions for prepayment and discount rates. The Company estimates prepayment speeds giving consideration that the Company may in the future transfer additional loans to the trust, subject to the availability of funds provided for within the trust. The following table presents the significant unobservable inputs used in the fair value measurements of nonrecourse debt for the periods indicated:


     March 31, 2021     December 31, 2020  
     Range of Input     Weighted
Average of
Input
    Range of Input     Weighted
Average of
Input
 

Nonrecourse debt


Weighted-average remaining life (in months)

     1.2 - 2.6       2.2       1.9 - 4.1       3.4  

Weighted-average prepayment speed (SMM)

     23.3% - 43.0     29     17.7% -32.0     21.4

Discount rate

     NM       6.5     NM       5.8

“NM” - these “Not Meaningful” inputs do not have an applicable range, as they are a single derived input.    

Deferred Purchase Price Liabilities

Deferred purchase price liabilities are measured using a present value of future payments which considers various assumptions, including future loan origination volumes, projected earnings and discount rates. As of March 31, 2021 and December 31, 2020, the Company utilized discount rates ranging from 12% to 21% to value the deferred purchase price liabilities. As this value is largely based on unobservable inputs, the Company classifies this liability as Level 3 in the fair value hierarchy.

In certain cases, the inputs used to measure fair value may fall into different levels of the fair value hierarchy. In such cases, the determination of which category within the fair value hierarchy is appropriate for any given asset or liability is based on the lowest level of input that is significant to the fair value measurement. The Company’s assessment of the significance of a particular input to the fair value measurement in its entirety requires judgment, and considers factors specific to the asset or liability.

Nonrecourse MSR Financing Liability, at Fair Value

The Company has agreed to sell to certain third parties the right to receive all excess servicing and ancillary fees related to identified mortgage servicing rights in exchange for an upfront payment equal to the entire purchase price of the indentified mortgage servicing rights.

Consistent with the underlying mortgage servicing rights, fair value is derived through a discounted cash flow analysis and calculated using a computer pricing model. This computer valuation is based on the objective characteristics of the portfolio (loan amount, note rate, etc.) and commonly used industry assumptions (PSAs, etc.). The assumptions taken into account by the pricing model are those which many active purchasers of servicing employ in their evaluations of portfolios for sale in the secondary market. The unique characteristics of the secondary servicing market often dictate adjustments to parameters over short periods of time.

Subjective factors are also considered in the derivation of fair values, including levels of supply and demand for servicing, interest rate trends, and perception of risk not incorporated into prepayment assumptions.


F-141


Table of Contents

Finance of America Equity Capital LLC and Subsidiaries

Notes to Unaudited Consolidated Financial Statements


The Company classifies the valuations of the nonrecourse MSR financing liability as Level 3 in the fair value disclosures.

The significant assumptions used in estimating the fair value of the outstanding nonrecourse MSR financing liability were as follows (in annual rates):


     March 31, 2021     December 31, 2020  
     Range of Input     Weighted Average
of Input
    Range of Input     Weighted Average
of Input
 

Weighted average prepayment speed (CPR)

     5.7% - 12.3     8.9     6.9% - 12.7 %     11.6

Discount rate

     10.8% - 11.1     11.0     11.7% - 12.0     12.0

Weighted average delinquency rate

     NM       0.9     NM       1.8

“NM” - these “Not Meaningful” inputs do not have an applicable range, as they are a single derived input.    

The following table summarizes the estimated change in the fair value of the nonrecourse MSR financing liability, at fair value from adverse changes in the significant assumptions (in thousands):


     March 31, 2021  
     Weighted
Average
Prepayment
Speed
     Discount
Rate
     Weighted
Average
Delinquency
Rate
 

Impact on fair value of 10% adverse change

   $ (740    $ (921    $ (10

Impact on fair value of 20% adverse change

     (1,433      (1,768      (20

These sensitivities are hypothetical and should be evaluated with care. The effect on fair value of a 10% variation in assumptions generally cannot be determined because the relationship of the change in assumptions to the fair value may not be linear. Additionally, the impact of a variation in a particular assumption on the fair value is calculated while holding other assumptions constant. In reality, changes in one factor may lead to changes in other factors, which could impact the above hypothetical effects.

The following table provides a summary of the recognized assets and liabilities that are measured at fair value on a recurring basis (in thousands):


     March 31, 2021  
     Total Fair
Value
     Level 1      Level 2      Level 3  

Assets


Reverse mortgage loans held for investment, subject to HMBS related obligations

   $ 10,071,192      $ —        $ —        $ 10,071,192  

Mortgage loans held for investment, subject to nonrecourse debt:


Reverse mortgage loans

     5,089,469        —          —          5,089,469  

Fix & flip mortgage loans

     201,975        —          —          201,975  


F-142


Table of Contents

Finance of America Equity Capital LLC and Subsidiaries

Notes to Unaudited Consolidated Financial Statements


     March 31, 2021  
     Total Fair
Value
     Level 1      Level 2      Level 3  

Mortgage loans held for investment:


Reverse mortgage loans

     897,800        —          —          897,800  

Fix & flip mortgage loans

     78,290        —          —          78,290  

Agricultural loans

     124,454        —          —          124,454  

Mortgage loans held for sale:


Residential mortgage loans

     2,021,964        —          2,004,679        17,285  

SRL

     73,178        —          —          73,178  

Portfolio

     45,219        —          —          45,219  

Mortgage servicing rights

     267,364        —          —          267,364  

Investments

     9,470        —          —          9,470  

Derivative assets:


Forward commitments, TBAs, and Treasury Futures

     22,362        18        21,401        943  

IRLCs

     37,631        —          —          37,631  

Interest rate swap futures

     56,487        56,487        —          —    


Total assets

   $ 18,996,855      $ 56,505      $ 2,026,080      $ 16,914,270  


Liabilities


HMBS related obligation

   $ 9,926,132      $ —        $ —        $ 9,926,132  

Nonrecourse debt

     5,205,892        —          —          5,205,892  

Deferred purchase price liabilities

     3,214        —          —          3,214  

Nonrecourse MSR financing liability

     22,051        —          —          22,051  

Derivative liabilities:


Forward MBS

     664        —          664        —    

Forward commitments, TBAs, and Treasury Futures

     954        18        —          936  

Interest rate swap futures

     1,702        1,702        —          —    


Total liabilities

   $ 15,160,609      $ 1,720      $ 664      $ 15,158,225  


     December 31, 2020  
     Total Fair
Value
     Level 1      Level 2      Level 3  

Assets


Reverse mortgage loans held for investment, subject to HMBS related obligations

   $ 9,929,163      $ —        $ —        $ 9,929,163  

Mortgage loans held for investment, subject to nonrecourse debt:


Reverse mortgage loans

     5,057,624        —          —          5,057,624  

Fix & flip mortgage loans

     338,543        —          —          338,543  

Mortgage loans held for investment:


Reverse mortgage loans

     661,790        —          —          661,790  

Agricultural loans

     69,031        —          —          69,031  


F-143


Table of Contents

Finance of America Equity Capital LLC and Subsidiaries

Notes to Unaudited Consolidated Financial Statements


     December 31, 2020  
     Total Fair
Value
     Level 1      Level 2      Level 3  

Mortgage loans held for sale:


Residential mortgage loans

     2,080,585        —          2,069,957        10,628  

SRL

     60,467        —          —          60,467  

Portfolio

     38,850        —          —          38,850  

Fix & flip mortgage loans

     42,909        —          —          42,909  

Mortgage servicing rights

     180,684        —          —          180,684  

Investments

     18,934        —          —          18,934  

Derivative assets:


Forward commitments and TBAs

     1,806        —          722        1,084  

IRLCs

     87,576        —          —          87,576  

Interest rate swaps and interest rate swap futures

     2,683        186        2,497        —    


Total assets

   $ 18,570,645      $ 2,683      $ 2,070,679      $ 16,497,283  


Liabilities


HMBS related obligation

   $ 9,788,668      $ —        $ —        $ 9,788,668  

Nonrecourse debt

     5,257,754        —          —          5,257,754  

Deferred purchase price liabilities

     3,842        —          —          3,842  

Nonrecourse MSR financing liability

     14,088        —          —          14,088  

Derivative liabilities:


Forward MBS

     18,634        —          18,634        —    

Forward commitments and TBAs

     1,332        —          248        1,084  

Interest rate swaps and interest rate swap futures

     755        186        569        —    


Total liabilities

   $ 15,085,073      $ 711      $ 18,926      $ 15,065,436  


Assets and liabilities measured at fair value on a recurring basis using significant unobservable inputs (Level 3, in thousands):


    Assets  
March 31, 2021   Mortgage
loans held for
investment
    Mortgage
loans held for
investment,
subject to
nonrecourse
debt
    Mortgage
loans held for
sale
    Derivative
assets
    Mortgage
servicing
rights
    Investments  

Beginning balance

  $ 10,659,984     $ 5,396,167     $ 152,854     $ 88,660     $ 180,684     $ 18,934  

Total gain or losses included in earnings

    132,499       (37,757     2,764       (50,040     20,349       (9,464

Purchases, settlements and transfers:


Purchases and additions, net

    1,143,109       21,064       175,551       —         74,978       —    

Sales and settlements

    (534,738     (360,128     (152,579     (46     (8,647     —    

Transfers in/(out) between categories

    (229,118     272,098       (42,909     —         —         —    


Ending balance

  $ 11,171,736     $ 5,291,444     $ 135,681     $ 38,574     $ 267,364     $ 9,470  


F-144


Table of Contents

Finance of America Equity Capital LLC and Subsidiaries

Notes to Unaudited Consolidated Financial Statements


     Liabilities  
March 31, 2021    HMBS related
obligations
    Derivative
liabilities
    Deferred purchase
price liability
    Nonrecourse debt     Nonrecourse MSR
financing liability
 

Beginning balance

   $ (9,788,668   $ (1,084   $ (3,842   $ (5,257,754   $ (14,088

Total gain or losses included in earnings

     (41,434   $ —         (29     (30,770     390  

Purchases, settlements and transfers:


Purchases and additions, net

     (602,172     —         —         (575,668     (8,353

Sales and settlements

     506,142       148       657       658,300    


Ending balance

   $ (9,926,132   $ (936   $ (3,214   $ (5,205,892   $ (22,051


    Assets  
December 31, 2020   Mortgage
loans held
for
investment
    Mortgage
loans held
for
investment,
subject to
nonrecourse
debt
    Mortgage
loans held
for sale
    Derivative
assets
    Mortgage
servicing
rights
    Debt
securities
    Investments  

Beginning balance

  $ 10,894,577     $ 3,511,212     $ 182,973     $ 14,008     $ 2,600     $ 102,260     $ 20,508  

Total gain or losses included in earnings

    627,251       304,663       (2,158     74,470       4,562       2,288       (5,512

Purchases, settlements and transfers:


Purchases and additions, net

    3,616,667       136,838       409,467       182       173,522       24,489       3,938  

Sales and settlements

    (1,536,977     (1,285,902     (605,018     —         —         (129,037     —    

Transfers in/(out) between categories

    (2,941,534     2,729,356       167,590       —         —         —         —    


Ending balance

  $ 10,659,984     $ 5,396,167     $ 152,854     $ 88,660     $ 180,684     $ —       $ 18,934  


     Liabilities  
December 31, 2020    HMBS related
obligations
    Derivative
liabilities
    Deferred purchase
price liability
    Nonrecourse debt     Nonrecourse MSR
Financing Liability
 

Beginning balance

   $ (9,320,209   $ (68   $ (4,300   $ (3,490,196   $ —    

Total gain or losses included in earnings

     (359,951     (834     (3,014     (294,802     798  

Purchases, settlements and transfers:


Purchases and additions, net

     (2,051,953     (182     (138     (3,110,368     (15,101

Sales and settlements

     1,943,445       —         3,610       1,637,612       215  


Ending balance

   $ (9,788,668   $ (1,084   $ (3,842   $ (5,257,754   $ (14,088


F-145


Table of Contents

Finance of America Equity Capital LLC and Subsidiaries

Notes to Unaudited Consolidated Financial Statements


Fair Value Option

Presented in the tables below are the fair value and unpaid principal balance (“UPB”) at March 31, 2021 and December 31, 2020, of assets and liabilities for which the Company has elected the fair value option (in thousands):


March 31, 2021   Estimated Fair
Value
    Unpaid Principal
Balance
 

Assets at fair value under the fair value option


Reverse mortgage loans held for investment, subject to HMBS related obligations

  $ 10,071,192     $ 9,179,190  

Mortgage loans held for investment, subject to nonrecourse debt:


Reverse mortgage loans

    5,089,469       4,587,435  

Commercial mortgage loans

    201,975       199,485  

Mortgage loans held for investment:


Reverse mortgage loans

    897,800       773,841  

Commercial mortgage loans

    202,744       200,443  

Mortgage loans held for sale:


Residential mortgage loans

    2,021,964       1,984,564  

Commercial mortgage loans

    118,397       114,967  

Liabilities at fair value under the fair value option


HMBS related obligations

    9,926,132       9,179,190  

Nonrecourse debt

    5,205,892       5,110,698  

Nonrecourse MSR financing liability

    22,051       22,051  


December 31, 2020   Estimated Fair
Value
    Unpaid Principal
Balance
 

Assets at fair value under the fair value option


Reverse mortgage loans held for investment, subject to HMBS related obligations

  $ 9,929,163     $ 9,045,104  

Mortgage loans held for investment, subject to nonrecourse debt:


Reverse mortgage loans

    5,057,624       4,457,805  

Commercial mortgage loans

    338,543       333,344  

Mortgage loans held for investment:


Reverse mortgage loans

    661,790       589,429  

Commercial mortgage loans

    69,031       69,127  

Mortgage loans held for sale:


Residential mortgage loans

    2,080,585       2,000,795  

Commercial mortgage loans

    142,226       140,693  

Liabilities at fair value under the fair value option


HMBS related obligations

    9,788,668       9,045,104  

Nonrecourse debt

    5,257,754       5,155,017  

Nonrecourse MSR financing liability

    14,088       14,088  


F-146


Table of Contents

Finance of America Equity Capital LLC and Subsidiaries

Notes to Unaudited Consolidated Financial Statements


Net Fair Value Gains on Mortgage Loans and Related Obligations

Provided in the table below is a summary of the components of net fair value gains on mortgage loans and related obligations (in thousands):


     For the three months ended
March 31,
 
     2021      2020  

Net fair value gains (losses) on mortgage loans and related obligations:


Interest income on mortgage loans

   $ 160,568      $ 183,672  

Change in fair value of mortgage loans

     (51,346      (98,566

Change in fair value of mortgage backed securities

     —          2,287  


Net fair value gains on mortgage loans

     109,222        87,393  


Interest expense on related obligations

     (119,201      (134,357

Change in fair value of derivatives

     43,972        (14,310

Change in fair value of related obligations

     42,670        74,654  


Net fair value losses on related obligations

     (32,559      (74,013


Net fair value gains on mortgage loans and related obligations

   $ 76,663      $ 13,380  


As the cash flows on the underlying mortgage loans will be utilized to settle the outstanding obligations, the Company’s own credit risk would not impact the fair value on the outstanding HMBS liabilities and nonrecourse debt.

Fair Value of Other Financial Instruments

As of March 31, 2021 and December 31, 2020, all financial instruments were either recorded at fair value or the carrying value approximated fair value. For financial instruments that were not recorded at fair value, such as Cash and cash equivalents including restricted cash, servicer advances and other financing lines of credit, the carrying value approximates fair value due to the short-term nature of such instruments.

6.     Reverse Mortgages Portfolio Composition

The table below summarizes the Company’s serviced reverse mortgage portfolio composition and the remaining UPBs of the reverse mortgage loan portfolio (in thousands):


    March 31, 2021     December 31, 2020  

Reverse mortgage loans:


Reverse mortgage loans held for investment, subject to HMBS related obligations

  $ 9,179,190     $ 9,045,104  

Reverse mortgage loans held for investment:


Non-agency reverse mortgages

    462,935       215,688  

Loans not securitized(1)

    239,979       168,292  

Unpoolable loans(2)

    63,875       197,395  

Unpoolable tails

    7,053       8,054  


Total reverse mortgage loans held for investment

    773,842       589,429  


F-147


Table of Contents

Finance of America Equity Capital LLC and Subsidiaries

Notes to Unaudited Consolidated Financial Statements


    March 31, 2021     December 31, 2020  

Reverse mortgage loans held for investment, subject to nonrecourse debt:


Performing HECM buyouts

    275,084       141,691  

Nonperforming HECM buyouts

    651,987       538,768  

Non-agency reverse mortgages

    3,660,364       3,777,346  


Total reverse mortgage loans held for investment, subject to nonrecourse debt

    4,587,435       4,457,805  


Total owned reverse mortgage portfolio

    14,540,467       14,092,338  

Loans reclassified as government guaranteed receivable

    51,030       49,255  

Loans serviced for others

    18,894       123,324  


Total reverse mortgage loans serviced

  $ 14,610,391     $ 14,264,917  


(1) 

Loans not securitized represent primarily newly originated loans.

(2) 

Unpoolable loans represent primarily loans that have reached 98% of their MCA.

The table below summarizes the owned reverse mortgage portfolio by product type (in thousands):


     March 31, 2021      December 31, 2020  

Fixed rate loans

   $ 5,136,564      $ 5,010,659  

Adjustable rate loans

     9,403,903        9,081,679  


Total owned reverse mortgage portfolio

   $ 14,540,467      $ 14,092,338  


7.     Reverse Mortgage Loans Held for Investment, Subject to HMBS Related Obligations, at Fair Value

Reverse mortgage loans held for investment, subject to HMBS related obligations, at fair value, consisted of the following for the dates indicated (in thousands):


     March 31, 2021      December 31, 2020  

Reverse mortgage loans held for investment, subject to HMBS related obligations - UPB

   $ 9,179,190      $ 9,045,104  

Fair value adjustments

     892,002        884,059  


Total reverse mortgage loans held for investment, subject to HMBS related obligations, at fair value

   $ 10,071,192      $ 9,929,163  


F-148


Table of Contents

Finance of America Equity Capital LLC and Subsidiaries

Notes to Unaudited Consolidated Financial Statements


8.    Mortgage Loans Held for Investment, Subject to Nonrecourse Debt, at Fair Value

Mortgage loans held for investment, subject to nonrecourse debt, at fair value, consisted of the following for the dates indicated (in thousands):


     March 31, 2021      December 31, 2020  

Mortgage loans held for investment, subject to nonrecourse debt - UPB:


Reverse mortgage loans

   $ 4,587,435      $ 4,457,805  

Commercial mortgage loans

     199,485        333,344  

Fair value adjustments

     504,524        605,018  


Total mortgage loans held for investment, subject to nonrecourse debt, at fair value

   $ 5,291,444      $ 5,396,167  


The table below shows the total amount of mortgage loans held for investment, subject to nonrecourse debt that were greater than 90 days past due and on non-accrual status (in thousands):


     March 31, 2021      December 31, 2020  

Loans 90 days or more past due and on non-accrual status


Mortgage loans held for sale:


Fair value:


Commercial mortgage loans

   $ 29,041      $ 32,377  


Total fair value

     29,041        32,377  


Aggregate UPB:


Commercial mortgage loans

   $ 30,044        33,888  


Total aggregate UPB

     30,044        33,888  


Difference

   $ (1,003    $ (1,511


9.     Mortgage Loans Held for Investment, at Fair Value    

Mortgage loans held for investment, at fair value, consisted of the following for the dates indicated (in thousands):


     March 31, 2021      December 31, 2020  

Mortgage loans held for investment - UPB:


Reverse mortgage loans

   $ 773,841      $ 589,429  

Commercial mortgage loans

     200,443        69,127  

Fair value adjustments

     126,260        72,265  


Total mortgage loans held for investment, at fair value

   $ 1,100,544      $ 730,821  


F-149


Table of Contents

Finance of America Equity Capital LLC and Subsidiaries

Notes to Unaudited Consolidated Financial Statements


10.

Mortgage Loans Held for Sale, at Fair Value

Mortgage loans held for sale, at fair value, consisted of the following for the dates indicated (in thousands):


    March 31, 2021     December 31, 2020  

Mortgage loans held for sale - UPB:


Residential mortgage loans

  $ 1,984,564     $ 2,000,795  

Commercial mortgage loans

    114,967       140,693  

Fair value adjustments

    40,830       81,323  


Total mortgage loans held for sale, at fair value

  $ 2,140,361     $ 2,222,811  


The table below shows the total amount of mortgage loans held for sale that were greater than 90 days past due and on non-accrual status (in thousands):


    March 31, 2021     December 31, 2020  

Loans 90 days or more past due and on non-accrual status


mortgage loans held for sale:


Fair value:


Residential mortgage loans

  $ 17,250     $ 10,628  

Commercial mortgage loans

    3,248       5,051  


Total fair value

    20,498       15,679  


Aggregate UPB:


Residential mortgage loans

    19,445       13,236  

Commercial mortgage loans

    3,408       5,317  


Total aggregate UPB

    22,853       18,553  


Difference

  $ (2,355   $ (2,874


The Company originates or purchases and sells mortgage loans in the secondary mortgage market without recourse for credit losses. However, the Company at times maintains continuing involvement with the loans in the form of servicing arrangements and the liability under representations and warranties it makes to purchasers and insurers of the loans.

The following table summarizes cash flows between the Company and transferees as a result of the sale of mortgage loans in transactions where the Company maintains continuing involvement with the mortgage loans (in thousands):


     For the three months ended
March 31,
 
     2021      2020  

Cash flows:


Sales proceeds

   $ 6,387,933      $ 237,406  

Fair value of retained beneficial interest(1)

     66,400        1,355  

Gross servicing fees received

     13,877        280  

Repurchases

     (4,144      (5,167

Gain

     284,948        9,247  


(1) 

Fair value of retained beneficial interest includes retained servicing rights and other beneficial interests retained as of the statement of financial condition date.


F-150


Table of Contents

Finance of America Equity Capital LLC and Subsidiaries

Notes to Unaudited Consolidated Financial Statements


11.

Mortgage Servicing Rights, at Fair Value

The servicing portfolio associated with capitalized servicing rights consists of the following (in thousands):


     March 31, 2021     December 31, 2020  

Fannie Mae/Freddie Mac

   $ 26,055,580     $ 20,501,504  

Ginnie Mae

     583,660       1,727,831  

Private investors

     36,118       40,027  


Total UPB

   $ 26,675,358     $ 22,269,362  


Weighted average interest rate

     3.0 %       3.1 %  

The activity in the loan servicing portfolio associated with capitalized servicing rights consisted of (in thousands):


     For the three months ended
March 31,
 
     2021     2020  

Beginning balance

   $ 22,269,362     $ 288,057  

Originated MSR

     6,312,227       136,387  

Purchased MSR

     866,806       —    

Payoffs, sales and curtailments

     (2,773,037 )          (21,592 )     


Total UPB

   $ 26,675,358     $ 402,852  


The activity in the mortgage servicing rights asset consisted of the following (in thousands):


     For the three months  ended
March 31,
 
     2021     2020  

Beginning balance

   $ 180,684     $ 2,600  

Originations

     65,964       1,294  

Purchases

     9,014       —    

Sale of servicing rights

     (8,647 )          —    

Changes in fair value due to:


Changes in market inputs or assumptions used in valuation model

     35,109       (675

Changes in fair value due to portfolio runoff and other

     (14,760     (100 )     


Ending balance

   $ 267,364     $ 3,119  


The value of MSRs is driven by the net cash flows associated with servicing activities. The cash flows include contractually specified servicing fees, late fees, and other ancillary servicing revenue. The fees were $13.0 million and $0.1 million for the three months ended March 31, 2021 and 2020, respectively. These fees are recorded within fee income on the Consolidated Statements of Operations and Comprehensive Income.


F-151


Table of Contents

Finance of America Equity Capital LLC and Subsidiaries

Notes to Unaudited Consolidated Financial Statements


The following table provides a summary of non-performing loans:


     March 31, 2021     December 31, 2020  
     Number of
Loans
    Unpaid
Balance
    Number of
Loans
    Unpaid
Balance
 

Portfolio delinquency (1)


30 days

     0.3     0.3     0.5     0.5

60 days

     0.1     0.0     0.1     0.1

90 or more days

     0.1     0.1     0.2     0.1


Total

     0.5     0.4     0.8     0.7


Foreclosure/real estate owned

     0.0     0.0     0.0     0.0


(1) 

Represents the loan servicing portfolio delinquencies as a percentage of the total number of loans and the total unpaid balance of the portfolio.


12.

Derivatives and Risk Management Activities

The Company’s principal market exposure is to interest rate risk, specifically long-term U.S. Treasury and mortgage interest rates, due to their impact on mortgage-related assets and commitments. The Company is also subject to changes in short-term interest rates, such as LIBOR, due to their impact on certain variable rate asset-backed debt such as warehouse lines of credit. Various financial instruments are used to manage and reduce this risk, including forward delivery commitments on mortgage-backed securities or whole loans and interest rate swaps.

The Company did not have any derivative instruments designated as hedging instruments or subject to master netting and collateral agreements as of March 31, 2021 and December 31, 2020 and for the three months ended March 31, 2021 and 2020.

The following tables summarize the amounts recorded in derivative assets and payables and other liabilities, related to derivative liabilities, in the Consolidated Statements of Financial Condition for the periods indicated (in thousands):


     March 31, 2021  
     Derivative assets     Derivative liabilities  
     Fair
value
     Notional
amount
     Unrealized
gains
(losses)
    Fair
value
     Notional
amount
     Unrealized
gains
(losses)
 

Interest rate lock commitments

   $ 37,631      $ 4,463,913      $ (49,945   $ —        $ —        $ —    

Forward commitments, TBAs securities, and treasury futures

     22,362        4,139,074        20,556       954        1,365,057        378  

Interest rate swaps and futures contracts

     56,487        1,463,000        53,804       1,702        588,700        (947

Forward MBS

     —          —          —         664        348,000        17,971  


Net fair value of derivative financial instruments

   $ 116,480      $ 10,065,987      $ 24,415     $ 3,320      $ 2,301,757      $ 17,402  


F-152


Table of Contents

Finance of America Equity Capital LLC and Subsidiaries

Notes to Unaudited Consolidated Financial Statements


    December 31, 2020  
    Derivative assets     Derivative liabilities  
    Fair
value
    Notional
amount
    Unrealized
gains
(losses)
    Fair
value
    Notional
amount
    Unrealized
gains
(losses)
 

Interest rate lock commitments

  $ 87,576     $ 2,897,479     $ 73,568     $ —       $ 13,822     $ 68  

Forward commitments, TBAs securities, and treasury futures

    1,806       399,612       968       1,332       389,422       (1,248

Interest rate swaps and futures contracts

    2,683       1,386,400       2,324       755       744,500       (617

Forward MBS

    —         —         (348     18,635       3,187,000       (16,587


Net fair value of derivative financial instruments

  $ 92,065     $ 4,683,491     $ 76,512     $ 20,722     $ 4,334,744     $ (18,384


The Company is exposed to risk in the event of non-performance by counterparties in their derivative contracts. In general, the Company manages such risk by evaluating the financial position and creditworthiness of counterparties, monitoring the amount of exposure and/or dispersing the risk among multiple counterparties. While the Company does not presently have master netting arrangements with its derivative counterparties, it does either maintain or deposit cash as margin collateral with its clearing broker to the extent the relative value of its derivatives are above or below their initial strike price. The Company pledged deposits of $0.1 million and $12.0 million as of March 31, 2021 and December 31, 2020, respectively. Total margin collateral is included in other assets, net, in the Company’s Consolidated Statements of Financial Condition.


13.

Goodwill

  Goodwill consisted of the following (in thousands):


     For the three months ended March 31,  
             2021                      2020          

Beginning balance

   $ 121,233      $ 121,137  

Additions from acquisitions

     7,517      $ —    


Ending balance

   $ 128,750      $ 121,137  


The Company did not identify any impairment for the three months ended March 31, 2021 and 2020. Goodwill is reviewed for impairment utilizing either a qualitative assessment or a quantitative goodwill impairment test. The Company completed an annual impairment test for goodwill as of October 1, 2020 and determined that it was more likely than not that no impairment of goodwill existed as of the evaluation date.

The amount of goodwill allocated to each reporting unit consisted of the following (in thousands):


     March 31, 2021      December 31, 2020  

Reporting units:


Mortgage Originations

   $ 51,946      $ 44,429  

Commercial Originations

     43,113        43,113  

Lender Services

     25,247        25,247  

Portfolio Management

     8,444        8,444  


Total Goodwill

   $ 128,750      $ 121,233  


F-153


Table of Contents

Finance of America Equity Capital LLC and Subsidiaries

Notes to Unaudited Consolidated Financial Statements


14.

Intangible Assets, Net

Intangible assets, net, consisted of the following (in thousands):


March 31, 2021   

Amortization
Period
(Years)

   Cost      Accumulated
Amortization
     Net  

Non-amortizing Intangibles


Domain name

   N/A    $ 5,422      $ —        $ 5,422  


Total non-amortizing intangibles

      $ 5,422      $ —        $ 5,422  


Amortizing Intangibles


Customer list

   5 - 12    $ 12,754      $ (5,410    $ 7,344  

Broker relationships

   10      7,627        (5,661      1,966  

Trade names

   5 - 20      2,495        (1,544      951  

Technology assets

   5      805        (186      619  


Total amortizing intangibles

      $ 23,681      $ (12,801    $ 10,880  


Total intangibles

      $ 29,103      $ (12,801    $ 16,302  


December 31, 2020   

Amortization
Period
(Years)

   Cost      Accumulated
Amortization
     Net  

Non-amortizing Intangibles


Domain name

   N/A    $ 5,422      $ —        $ 5,422  


Total non-amortizing intangibles

      $ 5,422      $ —        $ 5,422  


Amortizing Intangibles


Customer list

   5 - 12    $ 12,754      $ (5,100    $ 7,654  

Broker relationships

   10      7,627        (5,429      2,198  

Trade names

   5 - 20      2,495        (1,487      1,008  

Technology assets

   5      805        (156      649  


Total amortizing intangibles

      $ 23,681      $ (12,172    $ 11,509  


Total intangibles

      $ 29,103      $ (12,172    $ 16,931  


Amortization expense was $0.6 million for the three months ended March 31, 2021 and 2020.

The estimated amortization expense for each of the five succeeding fiscal years and thereafter as of March 31, 2021 is as follows (in thousands):


Year Ending December 31,

            Amount           

2021

   $ 1,850  

2022

     2,464  

2023

     1,638  

2024

     1,270  

2025

     999  

Thereafter

     2,659  


Total future amortization expense

   $ 10,880  


F-154


Table of Contents

Finance of America Equity Capital LLC and Subsidiaries

Notes to Unaudited Consolidated Financial Statements


15.

Other Assets, Net

Other assets, net, consisted of the following (in thousands):


     March 31, 2021      December 31, 2020  

Receivables, net of allowance of $1,271 and $788, respectively

   $ 85,664      $ 67,011  

Government guaranteed receivables

     46,552        46,481  

Right-of-use assets

     43,162        46,609  

Loan subject to repurchase from GNMA

     26,368        42,148  

Prepaid expenses

     18,298        17,536  

Investments, at fair value

     9,470        18,934  

Servicer advances, net of allowance of $2,087 and $1,661, respectively

     5,920        5,795  

Deposits

     3,300        14,188  

Receivable from clearing organization

     2,042        2,043  

Other

     37,387        37,328  


Total other assets, net

   $ 278,163      $ 298,073  


As of March 31, 2021 and December 31, 2020, there were $365.3 million and $380.3 million, respectively, of foreclosure proceedings in process, which are included in mortgage loans held for investment, at fair value, on the Consolidated Statements of Financial Condition.


16.

HMBS Related Obligations, at Fair Value

HMBS related obligations represent the issuance of pools of HMBS, which are guaranteed by GNMA, to third-party security holders. The Company accounts for the transfers of these advances in the related HECM loans as secured borrowings, retaining the initial HECM loans in its Consolidated Statements of Financial Condition as reverse mortgage loans held for investment, subject to HMBS related obligations, and recording the pooled HMBS as HMBS related obligations. Monthly cash flows generated from the HECM loans are used to service the outstanding HMBS.

HMBS related obligations, at fair value, consisted of the following as of the periods indicated (in thousands):


     March 31, 2021     December 31, 2020  

GNMA loan pools - UPB

   $ 9,179,190     $ 9,045,104  

Fair value adjustments

     746,942       743,564  


Total HMBS related obligations, at fair value

   $ 9,926,132     $ 9,788,668  


Weighted average remaining life

     4.2       4.5  

Weighted average interest rate

     2.8     3.0

The Company was servicing 1,728 and 1,693 GNMA loan pools at March 31, 2021 and December 31, 2020, respectively.


F-155


Table of Contents

Finance of America Equity Capital LLC and Subsidiaries

Notes to Unaudited Consolidated Financial Statements


17.

Nonrecourse Debt, at Fair Value

Nonrecourse debt, at fair value, consisted of the following for the dates indicated (in thousands):


Issue Date


Class of

Note


Final

Maturity

Date


Interest

Rate

  Original
Issue
Amount
    March 31,
2021
    December 31,
2020
 

Securitization of nonperforming HECM loans:


2021 FAHB 1

  February 2021   A, M1, M2, M3, M4, M5   February 2031   0.9% - 9.0%   $ 571,448     $ 563,882     $ —    

2020 FASST HB2

  July 2020   A, M1, M2, M3, M4, M5   July 2030   1.71% - 7.75%     594,171       458,700       476,147  

2020 FASST HB1

  February 2020   A, M1, M2, M3, M4, M5   February 2030   2.0% - 6.0%     373,912       —         298,883  

Securitization of proprietary jumbo reverse loans:


2019 FASST JR2

  June 2019   A, A2   June 2069   2.0%     499,000       425,874       440,141  

2018 FASST JR1

  May 2018   A   May 2068   4.3%     559,197       420,820       428,671  

2019 FASST JR3

  September 2019   A   September 2069   2.0%     450,104       385,133       404,057  

2020 FASST JR3

  August 2020   A, A2   August 2025   2.0% - 3.0%     360,713       333,291       337,099  

2019 FASST JR4

  November 2019   A   November 2069   2.0%     365,685       321,422       335,945  

2019 FASST JR1

  March 2019   A   March 2069   2.0%     347,000       295,489       309,840  

2020 FASST JR2

  May 2020   A1A, A1B, A2   May 2023   0.0% - 2.0%     305,658       288,812       291,827  

2018 FASST JR2

  December 2018   A   December 2068   4.5%     280,400       248,848       253,325  

2020 FASST JR1

  April 2020   A, A2   April 2023   2.0%     254,805       233,112       240,563  

2020 FASST JR4

  October 2020   A, A2   August 2025   2.0% - 3.0%     241,664       203,105       217,385  

Securitization of proprietary Select jumbo reverse loans:


2020 FASST S2

  June 2020   A1, A2   March 2025   2.0%     320,460       293,824       299,401  

2020 FASST S3

  December 2020   A1, A2   December 2025   1.5% - 2.5%     313,357       289,735       297,871  

2020 FASST S1

  March 2020   A1, A2   March 2025   2.0% - 3.7%     199,000       175,657       181,059  

Securitization of Fix & Flip loans:


2020 RTL1 ANTLR

  May 2020   A1, A2   May 2022 (A1, A2)   6.9% - 8.0%     306,517       90,444       140,072  

2018 RTL1 ANTLR

  September 2018   A1, A2, A-VFN, M   July 2022 (A1, A2); March 2023 (M)   4.3% - 7.4%     210,296       43,658       80,949  


F-156


Table of Contents

Finance of America Equity Capital LLC and Subsidiaries

Notes to Unaudited Consolidated Financial Statements


Issue Date


Class of

Note


Final

Maturity

Date


Interest

Rate

  Original
Issue
Amount
    March 31,
2021
    December 31,
2020
 

2019 RTL1 ANTLR

  March 2019   A1, A2, A-VFN, M   June 2022 (A1, A2); January 2023 (M)   4.5% - 6.9%     217,100       38,892       121,772  


Total nonrecourse debt

      5,110,698       5,155,007  


Nonrecourse MSR financing liability, at fair value

      22,051       14,088  

Fair value adjustments

      95,194       102,747  


Total nonrecourse debt, at fair value

    $ 5,227,943     $ 5,271,842  


Nonrecourse MSR Financing Liability, at Fair Value

The Company has agreements with third parties to sell beneficial interests in the servicing fees generated from certain of its originated or acquired mortgage servicing rights. Under these agreements, the Company has agreed to sell to the third parties the right to receive all excess servicing and ancillary fees related to the identified MSRs in exchange for an upfront payment equal to the entire purchase price of the identified mortgage servicing rights. These transactions are accounted for as financings under ASC 470, Debt and included in payables and other liabilities in the Consolidated Statements of Financial Condition.

The Company elected to measure the outstanding financings related to the nonrecourse MSR financing liability, at fair value, as permitted under ASC 825, Financial Instruments, with all changes in fair value recorded as a charge or credit to fee income in the Consolidated Statements of Operations and Comprehensive Income. The fair value on the nonrecourse MSR financing liability is based on the present value of expected future cash flows to be paid to the third parties with the discount rate approximating current market value for similar financial instruments. See Note 30 - Related Parties for additional information regarding the nonrecourse MSR financing liability.


18.

Other Financing Lines of Credit

The following summarizes the components of other financing lines of credit (dollars in thousands):


                      Outstanding Borrowings at  

Facility


Maturity
Date


Interest

Rate


Collateral

Pledged

  Total
Capacity(1)
    March 31,
2021
    December 31,
2020
 

Mortgage Lines:


March 2026 $150M Facility - MSR

  March 2026   LIBOR + applicable margin   MSRs     150,000       89,298       —    

March 2022 $200M Facility

  March 2022   LIBOR + applicable margin   First Lien Mortgages     200,000       118,041       97,225  

March 2022 $200M Facility

  March 2022   LIBOR + applicable margin   First Lien Mortgages     200,000       171,598       302,877  

March 2022 $225M Facility

  March 2022   LIBOR + applicable margin   First Lien Mortgages     225,000       189,820       154,097  

March 2022 $300M Facility

  March 2022   LIBOR + applicable margin   First Lien Mortgages     300,000       166,592       182,015  

February 2022 $300M Facility

  February 2022   LIBOR + applicable margin   First Lien Mortgages     300,000       5,080       —    


F-157


Table of Contents

Finance of America Equity Capital LLC and Subsidiaries

Notes to Unaudited Consolidated Financial Statements


                      Outstanding Borrowings at  

Facility


Maturity Date


Interest

Rate


Collateral

Pledged

  Total
Capacity(1)
    March 31,
2021
    December 31,
2020
 

November 2021 $150M Facility(2)

  November 2021   LIBOR + applicable margin   First Lien Mortgages     150,000       118,611       109,463  

October 2021 $250M Facility

  October 2021   LIBOR + applicable margin   First Lien Mortgages     250,000       227,789       170,174  

August 2021 $200M Facility

  August 2021   LIBOR + applicable margin   First Lien Mortgages     200,000       122,513       126,047  

August 2021 $300M Facility

  August 2021   LIBOR + applicable margin   First Lien Mortgages     300,000       69,587       15,719  

July 2021 $150M Facility(2)

  July 2021   LIBOR + applicable margin   First Lien Mortgages     150,000       137,486       122,075  

May 2021 $250M Facility(2)

  May 2021   LIBOR + applicable margin   First Lien Mortgages     250,000       215,401       225,837  

April 2021 $350M Facility(2)

  April 2021   LIBOR + applicable margin   First Lien Mortgages     350,000       244,633       283,821  

February 2021 $50M Facility - MSR(2)

  February 2021   Prime + applicable margin; 5.00% floor   MSRs     —         —         50,000  

October 2021 $200M Facility

  October 2021   LIBOR + applicable margin   First Lien Mortgages     200,000       120,156       158,114  


Subtotal mortgage lines of credit

      $ 3,225,000     $ 1,996,605     $ 1,997,464  


Reverse Lines:


$200M Repo Facility

  N/A   Bond accrual rate + applicable margin   Mortgage Related Assets     200,000       168,187       174,578  

$1.2M Repo Facility

  N/A   LIBOR + applicable margin   Mortgage Related Assets     1,215       1,215       1,188  

April 2021 $250M Facility(2)

  April 2021   LIBOR + applicable margin   First Lien Mortgages     250,000       163,787       173,484  

April 2021 $200M Facility(2)

  April 2021   LIBOR + applicable margin   First Lien Mortgages     200,000       19,422       128,723  

April 2021 $50M Facility(2)

  April 2021   Prime + applicable margin; 6.00% floor   Unsecuritized Tails     50,000       40,820       37,442  

June 2021 $75M Facility

  June 2021   LIBOR + applicable margin   First Lien Mortgages     75,000       51,173       11,423  

August 2021 $50M Facility

  August 2021   LIBOR + applicable margin   First Lien Mortgages     50,000       —         2,860  

October 2021 $400M Facility

  October 2021   LIBOR + applicable margin   First Lien Mortgages     400,000       367,253       84,124  

December 2021 $100M Facility

  December 2021   LIBOR + applicable margin   First Lien Mortgages     100,000       56,777       61,220  


F-158


Table of Contents

Finance of America Equity Capital LLC and Subsidiaries

Notes to Unaudited Consolidated Financial Statements


                      Outstanding Borrowings at  

Facility


Maturity Date


Interest

Rate


Collateral

Pledged

  Total
Capacity(1)
    March 31,
2021
    December 31,
2020
 

March 2022 $100M Facility

  March 2022   LIBOR + applicable margin   First Lien Mortgages     100,000       15,726       15,803  

April 2022 $52.5M Facility

  April 2022   LIBOR + applicable margin   Mortgage Related Assets     52,500       52,500       50,239  

April 2022 $45M Facility

  April 2022   9.00%   Mortgage Related Assets     45,000       24,853       26,875  

February 2024 $90M Facility

  February 2024   LIBOR + applicable margin   MSRs     90,000       80,754       —    


Subtotal reverse lines of credit

    $ 1,613,715     $ 1,042,467     $ 767,959  


Commercial Lines:


$2M Securities Repo Line

  N/A   Distributed Bond Interest + 50 bps   Mortgage Related Assets     2,048       2,048       6,411  

April 2023 $145M Facility

  April 2023   LIBOR + applicable margin   First Lien Mortgages     145,000       106,575       100,070  

August 2021 $45M Facility

  August 2021   10.00%   Second Lien Mortgages     45,000       25,000       21,475  

September 2022 $150M Facility

  September 2022   LIBOR + applicable margin   Encumbered Agricultural Loans     150,000       88,124       52,300  

November 2021 $50M Facility

  November 2021   LIBOR + applicable margin   First Lien Mortgages     50,000       28,520       28,064  

February 2022 $150M Facility

  February 2022   LIBOR + applicable margin   First Lien Mortgages     150,000       22,572       —    

February 2022 $150M Facility

  February 2022   LIBOR + applicable margin   First Lien Mortgages     150,000       14,534       —    

August 2022 $75M

  August 2022   2.50% - 3.25%   Encumbered Agricultural Loans     75,000       13,900       —    


Subtotal commercial lines of credit

    $ 767,048     $ 301,273     $ 208,320  


Total other financing lines of credit

    $ 5,605,763     $ 3,340,345     $ 2,973,743  


(1) 

Capacity is dependent upon maintaining compliance with, or obtaining waivers of, the terms, conditions and covenants of the respective agreements, including asset-eligibility requirements. Capacity amounts presented are as of March 31, 2021.

(2) 

See Note 32 - Subsequent Events for additional information on facility amendments.

As of March 31, 2021 and December 31, 2020, the weighted average outstanding interest rates on outstanding debt of the Company were 3.17% and 3.15%, respectively.


F-159


Table of Contents

Finance of America Equity Capital LLC and Subsidiaries

Notes to Unaudited Consolidated Financial Statements


The Company’s borrowing arrangements and credit facilities contain various financial covenants which primarily relate to required tangible net worth amounts, liquidity reserves, leverage requirements, and profitability requirements. As a result of market disruptions and fair value accounting adjustments taken in March 2020 resulting from the COVID-19 pandemic, FACo was in violation of its first, second, and third quarter 2020 profitability covenants with two of its warehouse lenders. The Company received waivers of these covenants violations from both lenders as well as amendments to profitability covenants for the remaining quarters of 2020. As of March 31, 2021, the Company was in compliance with all financial covenants.

The terms of the Company’s financing arrangements and credit facilities contain covenants, and the terms of the Company’s GSE/seller servicer contracts contain requirements that may restrict the Company and its subsidiaries from paying distributions to its members. These restrictions include restrictions on paying distributions, whenever the payment of such distributions would cause FoA to no longer be in compliance with any of its financial covenants or GSE requirements. Further, the Company is generally prohibited under Delaware law from making a distribution to a member to the extent that, at the time of the distribution, after giving effect to the distribution, liabilities of the Company (with certain exceptions) exceed the fair value of its assets. Subsidiaries of the Company are generally subject to similar legal limitations on their ability to make distributions to FoA.

As of March 31, 2021, the maximum allowable distributions available to the Company based on the most restrictive of such financial covenant ratios is presented in the table below (in thousands, except for ratios):


Financial Covenants

  Requirement     March 31, 2021     Maximum Allowable
Distribution (1)
 

FAM


Adjusted Tangible Net Worth

  $ 150,000     $ 401,736     $ 251,736  

Liquidity

    40,000       168,405       128,405  

Leverage Ratio

    15:1       6.4:1       230,599  

Material Decline in Lender Adjusted Net Worth:


Lender Adjusted Tangible Net Worth (Quarterly requirement)

  $ 211,546     $ 384,955     $ 173,409  

Lender Adjusted Tangible Net Worth (Two-Consecutive Quarterly requirement)

    210,428       384,955       174,527  

FACo


Adjusted Tangible Net Worth

  $ 85,000     $ 128,513     $ 43,513  

Liquidity

    20,000       48,211       28,211  

Leverage Ratio

    6:1       2.5:1       74,218  

FAR


Adjusted Tangible Net Worth

  $ 300,000     $ 406,382     $ 106,382  

Liquidity

    20,000       49,445       29,445  

Leverage Ratio

    5.5:1       3.6:1       135,882  

Material Decline in Lender Adjusted Net Worth:


Lender Adjusted Tangible Net Worth (Quarterly requirement)

  $ 354,344     $ 403,895     $ 49,551  

Lender Adjusted Tangible Net Worth (Two-Consecutive Quarterly requirement)

    314,091       403,895       89,804  


(1)

The Maximum Allowable Distribution for any of the originations subsidiaries is the lowest of the amounts shown for the particular originations subsidiary.


F-160


Table of Contents

Finance of America Equity Capital LLC and Subsidiaries

Notes to Unaudited Consolidated Financial Statements


As of December 31, 2020, the maximum allowable distributions available to the Company based on the most restrictive of such financial covenant ratios is presented in the table below (in thousands, except for ratios):


Financial Covenants

   Requirement      December 31, 2020      Maximum Allowable
Distribution (1)
 

FAM


Adjusted Tangible Net Worth

   $ 125,000      $ 289,163      $ 164,163  

Liquidity

     40,000        56,775        16,775  

Leverage Ratio

     15:1        9.3:1        110,267  

Material Decline in Lender Adjusted Net Worth:


Lender Adjusted Tangible Net Worth (Quarterly requirement)

   $ 210,428      $ 282,062      $ 71,634  

Lender Adjusted Tangible Net Worth (Two-Consecutive Quarterly requirement)

     93,763        282,062        188,299  

FACo


Adjusted Tangible Net Worth

   $ 85,000      $ 126,672      $ 41,672  

Liquidity

     20,000        46,385        26,385  

Leverage Ratio

     6:1        1.7:1        90,782  

FAR


Adjusted Tangible Net Worth

   $ 300,000      $ 474,128      $ 174,128  

Liquidity

     20,000        36,425        16,425  

Leverage Ratio

     5.5:1        2.5:1        258,615  

Material Decline in Lender Adjusted Net Worth:


Lender Adjusted Tangible Net Worth (Quarterly requirement)

   $ 314,091      $ 472,458      $ 158,367  

Lender Adjusted Tangible Net Worth (Two-Consecutive Quarterly requirement)

     205,619        472,458        266,839  


(1) 

The Maximum Allowable Distribution for any of the originations subsidiaries is the lowest of the amounts shown for the particular originations subsidiary.


F-161


Table of Contents

Finance of America Equity Capital LLC and Subsidiaries

Notes to Unaudited Consolidated Financial Statements


19.

Payables and Other Liabilities

Payables and other liabilities consisted of the following (in thousands):


     March 31, 2021      December 31, 2020  

Accrued liabilities

   $ 173,553      $ 82,779  

Accrued compensation expense

     124,124        150,214  

Lease liabilities

     44,452        48,250  

GNMA reverse mortgage buy-out payable

     26,490        32,317  

Liability for loans eligible for repurchase from GNMA

     26,368        42,148  

Repurchase reserves

     10,076        10,529  

Due to investors

     3,717        648  

Derivative liabilities

     3,320        20,722  

Deferred purchase price liabilities

     3,214        3,842  

Estimate of claim losses

     10,003        8,609  


Total payables and other liabilities

   $ 425,317      $ 400,058  


20.

Notes Payable, Net

Senior Unsecured Notes

In November 2020, FOAF issued $350.0 million aggregate principal amount of senior unsecured notes (the “Notes”). Interest is payable semi-annually in arrears on May 15 and November 15 beginning on May 15, 2021. The Notes are fully and unconditionally guaranteed, jointly and severally, on a senior unsecured basis by FoA and each of FoA’s material existing and future wholly-owned domestic subsidiaries, excluding FOAF and subsidiaries.

At any time prior to November 15, 2022, FOAF may redeem some or all of the Notes at a redemption price equal to 100% of the principal amount thereof, plus the applicable premium as of the redemption date under the terms of the indenture and accrued and unpaid interest. The redemption price during each of the twelve-month periods following November 15, 2022, November 15, 2023 and at any time after November 15, 2024 is 103.938%, 101.969% and 100.000%, respectively, of the principal amount plus accrued and unpaid interest thereon. At any time prior to November 15, 2022, FOAF may also redeem up to 40% of the aggregate principal amount of the notes at a redemption price equal to 107.875% of the aggregate principal amount of the senior unsecured notes redeemed, with an amount equal to or less than the net cash proceeds from certain equity offerings, plus accrued and unpaid interest.

Upon the occurrence of a change of control, the holders of the Notes will have the right to require FOAF to make an offer to repurchase each holder’s Notes at a price equal to 101% of their principal amount, plus accrued and unpaid interest.

The Notes contain covenants limiting, among other things, FOAF and its restricted subsidiaries’ ability to incur additional debt or issue certain preferred shares, incur liens, make certain distributions, investments and other restricted payments, engage in certain transactions with affiliates, and merge or consolidate or sell, transfer, lease or otherwise dispose of all or substantially all of FOAF’s assets. These incurrence based covenants are subject to exceptions and qualifications. Many of these covenants will cease to apply during any time that the Notes have investment grade ratings and no default has occurred and continuing. The Company was in compliance with all required covenants related to the Notes as of March 31, 2021.


F-162


Table of Contents

Finance of America Equity Capital LLC and Subsidiaries

Notes to Unaudited Consolidated Financial Statements


Financing Agreements

As a part of the Company’s acquisitions of certain subsidiaries, the Company entered into various note agreements with the sellers. In addition, in 2017, the Company entered into an agreement for the purchase of computer hardware and equipment which was financed by notes payable to the seller with monthly payments through January 2021.

A summary of the outstanding notes payable, net, is presented in the table below (in thousands):


Description

   Maturity Date    Interest Rate     March 31, 2021      December 31, 2020  

Senior Unsecured Notes

   November 2025      7.9   $ 350,000      $ 350,000  

Financing Agreement

   January 2021      5.5   $ —        $ 9  


Total aggregate principle amount

        $ 350,000      $ 350,009  

Less: Debt issuance costs

        $ (13,704    $ (13,436


Total notes payable and other debt, net

        $ 336,296      $ 336,573  


The interest expense for the three months ended March 31, 2021 and 2020 was $7.7 million and $0.4 million, respectively.


21.

Leases

The Company’s lease portfolio is comprised primarily of real estate and equipment agreements. Operating leases in which the Company is the lessee are recorded as operating lease ROU assets and operating lease liabilities, included in other assets, net, and payables and other liabilities, respectively, on the Consolidated Statements of Financial Condition, as of March 31, 2021 and December 31, 2020. The Company does not currently have any finance leases in which it is the lessee. Operating lease ROU assets represent the Company’s right to use an underlying asset during the lease term and operating lease liabilities represent the Company’s obligation to make lease payments arising from the lease.

For operating leases, the lease liabilities are initially recognized based on the present value of the remaining lease payments using a discount rate that represents the Company’s incremental borrowing rate at the lease commencement date. As most of the Company’s leases do not provide an implicit rate, the Company uses its incremental borrowing rate based on the information available at the lease commencement date in determining the present value of the lease payments. This incremental borrowing rate is the rate of interest that the Company would have to pay to borrow on a collateralized basis over a similar term an amount equal to the lease payments in a similar economic environment and given similar credit risk. The lease term for all of the Company’s leases includes the noncancellable period of the lease plus any additional periods covered by either a Company option to extend (or not to terminate) the lease. The Company includes these options in the lease term when it is reasonably certain of exercising them.

ROU assets are further adjusted for lease incentives. Operating lease expense is recognized on a straight-line basis over the lease term and is recorded in general and administrative expenses in the Consolidated Statements of Operations and Comprehensive Income. The Company recognizes variable lease payments associated with the Company’s leases when the variability is resolved. Variable lease payments are recorded in general and administrative expenses in the Consolidated Statements of Operations and Comprehensive Income along with expenses arising from fixed lease payments.


F-163


Table of Contents

Finance of America Equity Capital LLC and Subsidiaries

Notes to Unaudited Consolidated Financial Statements


The table below summarizes the Company’s operating lease portfolio (in thousands):


     March 31, 2021     December 31, 2020  

Right-of-use assets

   $ 43,162     $ 46,609  

Lease liabilities

   $ 44,452     $ 48,250  

Weighted-average remaining lease term (in years)

     3.28       3.61  

Weighted-average discount rate

     7.13     7.42

The table below summarizes the Company’s net operating lease cost:


     For the three months ended
March 31,
 
     2021      2020  

Operating lease cost

   $ 5,490      $ 6,612  

Short-term lease cost

     1,035        2,031  


Total operating and short term lease cost

     6,525        8,643  


Variable lease cost

     1,808        704  

Sublease income

     (464      (696


Net lease cost

   $ 7,869      $ 8,651  


The table below summarizes other information related to the Company’s operating leases:


     For the three months ended
March 31,
 
     2021      2020  

Cash paid for amounts included in the measurement of lease liabilities:


Operating cash flows from operating leases

   $ 5,423      $ 6,285  

Leased assets obtained in exchange for new operating lease liabilities

   $ 701      $ 3,464  


The following table presents a maturity analysis of our operating leases and a reconciliation of the undiscounted cash flows to our lease liabilities as of March 31, 2021:


2021

   $ 14,869  

2022

     14,358  

2023

     9,983  

2024

     6,185  

2025

     3,172  

2026

     880  

Thereafter

     554  


Total undiscounted lease payments

     50,001  

Less amounts representing interest

     (5,549


Total lease liabilities

   $ 44,452  


F-164


Table of Contents

Finance of America Equity Capital LLC and Subsidiaries

Notes to Unaudited Consolidated Financial Statements


22.

Litigation

The Company’s business is subject to legal proceedings, examinations, investigations and reviews by various federal, state and local regulatory and enforcement agencies as well as private litigants such as the Company’s borrowers or former employees. At any point in time, the Company may have open investigations with regulators or enforcement agencies, including examinations and inquiries related to its loan servicing and origination practices. These matters and other pending or potential future investigations, examinations, inquiries or lawsuits may lead to administrative or legal proceedings, and possibly result in remedies, including fines, penalties, restitution, or alterations in business practices, and in additional expenses and collateral costs.

As a litigation or regulatory matter develops, the Company, in conjunction with any outside counsel handling the matter, evaluates on an ongoing basis whether such matter presents a loss contingency that is probable and estimable. If, at the time of evaluation, the loss contingency is not both probable and reasonably estimable, the matter will continue to be monitored for further developments that would make such loss contingency both probable and reasonably estimable. Once the matter is deemed to be both probable and reasonably estimable, the Company will establish an accrued liability and record a corresponding amount to litigation related expense. The Company will continue to monitor the matter for further developments that could affect the amount of the accrued liability that has been previously established. Legal expenses, which includes, among other things, settlements and the fees paid to external legal service providers, of $4.2 million and $3.5 million for the three months ended March 31, 2021 and 2020, respectively, were included in general and administrative expenses in the Consolidated Statements of Operations and Comprehensive Income.

For certain matters, the Company may consider a loss to be probable or reasonably possible but cannot provide a precise estimate of losses. For these matters, the Company may be able to estimate a range of possible loss. In determining whether it is possible to provide an estimate of loss or range of possible loss, the Company reviews and evaluates its material litigation and regulatory matters on an ongoing basis, in conjunction with any outside counsel handling the matter. As of March 31, 2021, there were no matters that the Company considered to be probable or reasonably possible for which they could provide a reasonable range of estimated losses.


23.

Commitments and Contingencies

Servicing of Mortgage Loans

Sub-Servicing

The Company has contracted with third-party providers to perform specified servicing functions on its behalf. These services include maintaining borrower contact, facilitating borrower advances, generating borrower statements, and facilitating loss-mitigation strategies in an attempt to keep defaulted borrowers in their homes. Defaults on reverse mortgages leading to foreclosures may occur if borrowers fail to meet maintenance obligations, such as payment of taxes or home insurance premiums. When a default cannot be cured, the sub-servicers manage the foreclosure process and the filing of any insurance claims with HUD. The sub-servicers have responsibility for remitting timely advances and statements to borrowers and timely and accurate claims to HUD, including compliance with local, state and federal regulatory requirements.

Additionally, the sub-servicers are also responsible for remitting payments to investors, including interest accrued and interest shortfalls and funding advances such as taxes and home insurance premiums. Advances are typically remitted by the Company to the sub-servicers on a daily basis. Although the Company has outsourced its servicing function, as the issuer the Company has responsibility for all aspects of servicing of the HECM loans and related HMBS beneficial interests under the terms of the servicing contracts, state laws and regulations.


F-165


Table of Contents

Finance of America Equity Capital LLC and Subsidiaries

Notes to Unaudited Consolidated Financial Statements


Contractual sub-servicing fees related to sub-servicer arrangements are generally based on a fixed dollar amount per loan and are included in general and administrative expenses in the Consolidated Statements of Operations and Comprehensive Income.

Unfunded Commitments

The Company is required to fund further borrower advances (where the borrower has not fully drawn down the HECM or fix & flip loan proceeds available to them), and to additionally fund the payment of the borrower’s obligation to pay the FHA their monthly insurance premium.

The outstanding unfunded commitments available to borrowers related to HECM loans were approximately $2.3 billion as of March 31, 2021. The outstanding unfunded commitments available to borrowers related to fix & flip loans were approximately $13.8 million as of March 31, 2021. This additional borrowing capacity is primarily in the form of undrawn lines of credit.

The Company also has commitments to purchase and sell loans totaling $21.6 million and $111.7 million, respectively, at March 31, 2021.

Mandatory Repurchase Obligation

The Company is required to repurchase reverse loans out of the GNMA securitization pools once the outstanding principal balance of the related HECM is equal to or greater than 98% of the MCA. Performing repurchased loans are conveyed to HUD and nonperforming repurchased loans are generally liquidated in accordance with program requirements. Loans are considered nonperforming upon events such as, but not limited to, the death of the mortgagor, the mortgagor no longer occupying the property as their principal residence, or the property taxes or insurance not being paid.

As an issuer of HMBS, the Company also has the option to repurchase reverse loans out of the GNMA securitization pools without GNMA prior approval in certain instances. These situations include the borrower requesting an additional advance that causes the outstanding principal balance to be equal or greater than 98% of the MCA; the borrower’s loan becoming due and payable under certain circumstances; the borrower not occupying the home for greater than twelve consecutive months for physical or mental illness and the home is not the residence of another borrower; or the borrower failing to perform in accordance with the terms of the loan.

For each HECM loan that the Company securitizes into Agency HMBS, the Company is required to covenant and warrant to GNMA, among other things, that the HECM loans related to each participation included in the Agency HMBS are eligible under the requirements of the National Housing Act and the GNMA Mortgage-backed Securities Guide, and that the Company will take all actions necessary to ensure the HECM loan’s continued eligibility. The GNMA HMBS program requires that the Company removes the participation related to any HECM loan that does not meet the requirements of the GNMA Mortgage-backed Securities Guide. In addition to securitizing HECM loans into Agency HMBS, the Company may sell HECM loans to third parties and the agreements with such third parties include standard representations and warranties related to such loans, which if breached, may require the Company to repurchase the HECM loan and/or indemnify the purchaser for losses related to such HECM loans. In the case where the Company repurchases the loan, the Company bears any subsequent credit loss on the loan. To the extent that the Company is required to remove a loan from an Agency HMBS, purchase a loan from a third party or indemnify a third party, the potential losses suffered by the Company may be reduced by any recourse the Company has to the originating broker and/or correspondent


F-166


Table of Contents

Finance of America Equity Capital LLC and Subsidiaries

Notes to Unaudited Consolidated Financial Statements


lender, if applicable, to the extent such entity breached similar or other representations and warranties. Under most circumstances, the Company has the right to require the originating broker/correspondent to repurchase the related loan from the Company and/or indemnify the Company for losses incurred. The Company seeks to manage the risk of repurchase and associated credit exposure through the Company’s underwriting and quality assurance practices.

IRLCs

The Company enters into IRLCs with prospective borrowers whereby the Company commits to lend a certain loan amount under specific terms and interest rates to the borrower. The Company also enters into LPCs with prospective sellers. These loan commitments are treated as derivatives and are carried at fair value. See Note 12 - Derivative and Risk Management Activities for more information.

Leases

See Note 21 - Leases for a listing of the Company’s current lease obligations under ASC 842 and Note 22 -Litigation for information regarding current litigation matters.


24.

Long-Term Incentive Plan

On January 1, 2015, the Company established a long-term incentive plan (the “Plan”) to compensate key employees. Any distributions are based on distributions received by equity holders of the Company in excess of the contributed equity capital, plus a designated return on contributed equity capital (the “Hurdle”).

The phantom units are accounted for as a profit-sharing arrangement under ASC Topic 710, Compensation –General (“ASC 710”) as they do not represent a substantive form of equity and are not indexed to the price of UFG common units. A total of 1,250 Phantom Units were approved under the Plan, with 1,077 units issued and outstanding as of March 31, 2021.

In connection with the closing of the Proposed Business Combination further described in Note 32 - Subsequent Events, which occurred on April 1, 2021, the holders of Phantom Units will receive a one-time lump sum cash payment of $24.0 million as it relates to the anticipated achievement of the Hurdle being met under the original terms of the Plan. The balance of the Company’s obligation under the Plan will be replaced by the issuance of replacement restricted stock units as governed by the Amended and Restated Management Long-Term Incentive Plan. See Note 32 – Subsequent Events.

The cash payment of $24.0 million relates to prior services provided solely for the benefit of the Company and not for ongoing services to be provided in the future that would benefit the post-combination entity. Given that the payment was triggered by the distributions made in connection with the successful closing of the Business Combination, the payment of $24.0 million is considered to have been incurred “on the line”.


25.

Changes in Contingently Redeemable Noncontrolling Interest

The Company has determined that the Class B interests of FACo Holdings issued to Buy to Rent Platform Holdings, L.P. (“B2R”) meet the definition of CRNCI. Under the FACo Holdings Agreement, the Class B Units may be redeemed upon sale of FACo by FACo Holdings, sale of FAH, or sale of UFG Holdings LLC, which would require FAH to purchase the outstanding Class B Units. The Company has determined that the legal provisions in the FACo Holdings Agreement in which there is a noncontrolling interest represent a substantive


F-167


Table of Contents

Finance of America Equity Capital LLC and Subsidiaries

Notes to Unaudited Consolidated Financial Statements


profit-sharing arrangement, where the allocation to the members differs from the stated ownership percentages. The Company utilizes the hypothetical liquidation at book value, or HLBV, method for the allocation of profits and losses each period. Under the HLBV method, the amounts of income and loss attributed to the noncontrolling interests in the Consolidated Statements of Operations and Comprehensive Income reflects changes in the amounts each member would hypothetically receive at each Consolidated Statement of Financial Condition date under the liquidation provisions of the FACo Holdings Agreement, assuming the net assets of the FACo Holdings were liquidated at their respective recorded amounts. Allocations of profits and losses in the Consolidated Statements of Operations and Comprehensive Income is determined based on the hypothetical amounts that would be distributed to members after taking into account any capital transactions between FACo Holdings and its members as follows:


Distributions up to Hurdle Amount of $202.0 million (subject to certain adjustments defined in the FACo Holdings Agreement) - 100% to Class B Members;


Distributions of the next $150.0 million - 95% to Class A Members and 5% to Class B Members, and;


Thereafter - 75% to Class A Members and 25% to Class B Members.

In connection with the closing of the Business Combination disclosed in Note 1, FoA will cause Finance of America Holdings LLC to exercise its right under the FACo Holdings Agreement to purchase all of the outstanding Class B Units held by B2R for a redemption price of $203.2 million in satisfaction of the applicable Hurdle Amount under the FACo Holdings Agreement. As of March 31, 2021, the carrying value of the CRNCI has been accreted to the agreed upon redemption price. See Note 32 - Subsequent Events within the notes to unaudited consolidated financial statements for the implications of the Business Combination on CRNCI.

The changes in CRNCI are as follows (in thousands):


     March 31, 2021      December 31, 2020  

Balance, beginning of period

   $ 166,231      $ 187,981  

Accretion to redemption price

     32,725        —    

Net income (loss)

     4,260        (21,750


Balance, end of period

   $ 203,216      $ 166,231  


26.

General and Administrative Expenses

General and administrative expenses consisted of the following (in thousands):


     For the three months ended
March 31,
 
     2021      2020  

Professional fees

   $ 23,794      $ 4,899  

Title and closing

     25,061        15,995  

Loan origination expenses

     20,503        20,447  

Loan portfolio expenses

     15,200        9,177  

Communications and data processing

     11,324        6,302  

Business development

     10,607        8,269  

Securitization expenses

     6,944        —    

Other expenses

     2,985        1,955  


F-168


Table of Contents

Finance of America Equity Capital LLC and Subsidiaries

Notes to Unaudited Consolidated Financial Statements


     For the three months ended
March 31,
 
     2021      2020  

Depreciation and amortization

     3,484        3,469  

Office expense

     2,738        2,345  

Licensing and insurance

     2,487        1,792  

Travel and entertainment

     2,060        3,854  

Fair value change in deferred purchase price liability

     30        62  


Total general and administrative expenses

   $ 127,217      $ 78,566  


27.

Business Segment Reporting

The Company has identified six reportable segments: Portfolio Management, Forward Originations, Reverse Originations, Commercial Originations, Lender Services and Corporate/Other.

Mortgage Originations

The Mortgage Originations segment originates mortgage loans through FAM. This segment generates revenue through fee-based mortgage loan origination services and the origination and sale of mortgage loans into the secondary market. The Mortgage Originations segment includes three channels: distributed retail lending, direct-to-consumer lending, and third-party-originator lending.

Reverse Originations

The Reverse Originations segment originates or acquires reverse mortgage loans through FAR. This segment originates HECMs which are insured by the FHA, and proprietary jumbo reverse mortgages. The segment originates reverse mortgage loans through the following channels: retail and third-party-originator. Reverse mortgage lending activities primarily consist of the origination and securitization of mortgage loans to GNMA and other private investors.

Commercial Originations

The Commercial Originations segment originates or acquires commercial mortgage loans through FACo. The segment provides business purpose lending solutions for residential real estate investors in two principal ways: short-term loans to provide rehab and construction of investment properties meant to be sold upon completion, and investor rental loans collateralized by either a single asset or portfolio of properties. The segment originates commercial mortgage loans through the following channels: retail and third-party-originator. Commercial mortgage lending activities primarily consist of the origination and securitization of commercial mortgages to private investors.

Portfolio Management

The Portfolio Management segment provides product development, loan securitization, loan sales, risk management, asset management and servicing oversight services to the enterprise and third-party funds.


F-169


Table of Contents

Finance of America Equity Capital LLC and Subsidiaries

Notes to Unaudited Consolidated Financial Statements


Lender Services

The Lender Services segment provides ancillary business services, title agency and title insurance services, MSR valuation and trade brokerage, and appraisal management services to customers in the residential mortgage, student lending, and commercial lending industries. The segment also operates a foreign branch in the Philippines for fulfillment transactional and administrative support.

Corporate and Other

Corporate and other consists of the Business Excellence Office (“BXO”) and other corporate services groups The Company’s segments are based upon the Company’s organizational structure which focuses primarily on the services offered. Corporate functional expenses are allocated to individual segments based on actual cost of services performed based on a direct resource utilization, estimate of percentage use for shared services or headcount percentage for certain functions. Non-allocated corporate expenses include administrative costs of executive management and other corporate functions that are not directly attributable to the Company’s operating segments. Revenues generated on inter-segment services performed are valued based on similar services provided to external parties. To reconcile the Company’s consolidated results, certain inter-segment revenues and expenses are eliminated in the “Eliminations” column in the following tables.

The following tables are a presentation of financial information by segment for the periods indicated (in thousands):


    For the three months ended March 31, 2021  
    Mortgage
Originations
    Reverse
Originations
    Commercial
Originations
    Portfolio
Management
    Lender
Services
    Operating
Segments
    Corporate
and Other
    Elim     Total  

REVENUES


Gain on sale of loans, net

  $ 286,481     $ —       $ —       $ 5,065     $ —       $ 291,546     $ —       $ (212   $ 291,334  

Net fair value gains

    —         68,449       5,431       2,750       —         76,630       —         33       76,663  

Fee income

    32,731       558       9,079       37,086       76,385       155,839       (9,464     6,134       152,509  

Net interest expense

    891       —         —         (14,816     (36     (13,961     (7,744     —         (21,705


Total revenues

    320,103       69,007       14,510       30,085       76,349       510,054       (17,208     5,955       498,801  

Total expenses

    224,246       23,693       13,391       24,406       62,970       348,706       18,683       5,955       373,344  


Net income (loss) before taxes

  $ 95,857     $ 45,314     $ 1,119     $ 5,679     $ 13,379     $ 161,348     $ (35,891   $ —       $ 125,457  


Depreciation and amortization

  $ 1,423     $ 151     $ 125     $ 146     $ 1,268     $ 3,113     $ 371     $ —       $ 3,484  

Total assets

    2,425,529       35,861       82,375       17,378,088       125,317     $ 20,047,170       379,562       (326,313   $ 20,100,419  


    For the three months ended March 31, 2020  
    Mortgage
Originations
    Reverse
Originations
    Commercial
Originations
    Portfolio
Management
    Lender
Services
    Operating
Segments
    Corporate
and Other
    Elim     Total  

REVENUES


Gain on sale of loans, net

  $
 
 
127,291
 
 
  $ —       $ —       $ 5,617     $ —       $
 
 
132,908
 
 
  $ —       $ (2,224   $ 130,684  

Net fair value gains

    —         34,589       8,561       (31,356     —         11,794       —         1,586       13,380  

Fee income

    20,527       603       10,836       961       41,258       74,185       —         (4,229     69,956  

Net interest expense

    486       —         —         (24,773     9       (24,278     (1,416     (67     (25,761


Total revenues

    148,304       35,192       19,397       (49,551     41,267       194,609       (1,416     (4,934     188,259  

Total expenses

    138,191       18,584       15,890       17,372       38,595       228,632       6,649       (4,934     230,347  


Net income (loss) before taxes

  $ 10,113     $ 16,608     $ 3,507     $ (66,923   $ 2,672     $ (34,023   $ (8,065   $ —       $ (42,088


F-170


Table of Contents

Finance of America Equity Capital LLC and Subsidiaries

Notes to Unaudited Consolidated Financial Statements


    For the three months ended March 31, 2020  
    Mortgage
Originations
    Reverse
Originations
    Commercial
Originations
    Portfolio
Management
    Lender
Services
    Operating
Segments
    Corporate
and Other
    Elim     Total  

Depreciation and amortization

  $ 1,567     $ 169     $ 164     $ 12     $ 1,055     $ 2,967     $ 502     $ —       $ 3,469  

Total assets

  $ 1,510,668     $ 94,153     $ 80,063     $ 15,746,423     $ 73,669     $ 17,504,976     $ 681,986     $ (984,261   $ 17,202,701  


28.

Liquidity and Capital Requirements

FAM

In addition to the covenant requirements of FAM mentioned in Note 18 - Other Financing Lines of Credit, FAM is subject to various regulatory capital requirements administered by HUD as a result of their mortgage origination and servicing activities. HUD governs non-supervised, direct endorsement mortgagees, and GNMA, FNMA and FHLMC, which sponsor programs that govern a significant portion of FAM’s mortgage loans sold and servicing activities. Additionally, FAM is required to maintain minimum net worth requirements for many of the states in which it sells and services loans. Each state has its own minimum net worth requirement; however, none of the state requirements are material to the Company’s Consolidated Financial Statements.

Failure to meet minimum capital requirements can result in certain mandatory and possibly additional discretionary remedial actions by regulators that, if undertaken, could: (i) remove FAM’s ability to sell and service loans to or on behalf of the Agencies; and (ii) have a direct material effect on FAM’s financial statements, results of operations and cash flows.

In accordance with the regulatory capital guidelines, FAM must meet specific quantitative measures of cash, assets, liabilities, profitability and certain off-balance sheet items calculated under regulatory accounting practices. Further, changes in regulatory and accounting standards, as well as the impact of future events on FAM’s results, may significantly affect the FAM’s net worth adequacy.

Among FAM’s various capital requirements related to its outstanding mortgage origination and servicing agreements, the most restrictive of these requires FAM to maintain a minimum adjusted net worth balance of $163.2 million as of March 31, 2021. FAM’s adjusted net worth was $402.1 million as of March 31, 2021. The Company was therefore in compliance with all net worth requirements.

In addition, FAM is required to maintain both fidelity bond and errors and omissions insurance coverage at tiered levels based on the aggregate UPB of the loans serviced by FAM throughout the year. FAM is required to conduct compliance testing at least quarterly to ensure compliance with the foregoing requirements. As of March 31, 2021, FAM was in compliance with applicable requirements.

FAR

As an issuer of HMBS, FAR is required by GNMA to maintain minimum net worth, liquidity and capitalization levels as well as minimum insurance levels.

The net worth required is $5.0 million plus 1% of FAR’s commitment authority from GNMA. The liquidity requirement is for 20% of FAR’s required net worth be in the form of cash or cash equivalent assets. FAR is required to maintain a ratio of 6% of net worth to total assets.


F-171


Table of Contents

Finance of America Equity Capital LLC and Subsidiaries

Notes to Unaudited Consolidated Financial Statements


In addition, FAR is required to maintain both fidelity bond and errors and omissions insurance coverage at tiered levels based on the aggregate UPB of the loans serviced by FAR throughout the year. FAR is required to conduct compliance testing at least quarterly to ensure compliance with the foregoing requirements. As of March 31, 2021, FAR was in compliance with applicable requirements.

At March 31, 2021, FAR was in compliance with the minimum net worth, liquidity and insurance requirements of GNMA and had received a permanent waiver for its capital requirement. The minimum tangible net worth required of FAR by GNMA at March 31, 2021 was $98.3 million. FAR’s actual net worth calculated based on GNMA guidance at March 31, 2021 was $393.1 million.

Incenter

Incenter Securities Group LLC (“ISG”), one of the operating subsidiaries of Incenter, operates in a highly regulated environment and is subject to federal and state laws, SEC rules and Financial Industry Regulatory Authority (“FINRA”) rules and guidance. Applicable laws and regulations, among other things, restrict permissible activities and require compliance with a wide range of financial and customer-related protections. The consequences of noncompliance can include substantial monetary and nonmonetary sanctions. In addition, ISG is subject to comprehensive examination by its regulators. These regulators have broad discretion to impose restrictions and limitations on the operations of the Company and to impose sanctions for noncompliance. ISG is subject to the SEC’s Uniform Net Capital Rule (SEC Rule 15c3-1) (“the Rule”), which requires the maintenance of minimum net capital. ISG computes net capital under the alternative method. Under this method, the required minimum net capital is equal to $0.3 million. At March 31, 2021, ISG had met the minimum net capital requirement amounts.

Additionally, ISG claims the exemption provision of SEC Rule 15c3-3(k)(2)(ii). ISG does not hold customer funds or safekeep customer securities. The Company introduces and clears its customers’ transactions through a third-party on a fully-disclosed basis.

Agents National Title Insurance Company, an operating subsidiary of Incenter, has additional capital requirements. The State of Missouri and State of Alabama require domestic title insurance underwriters maintain minimum capital and surplus of $1.6 million and $0.2 million, respectively. Failure to comply with these provision may result in various actions up to and including surrender of the certificate of authority. Additionally, in October 2019, Agents entered into a capital maintenance agreement in conjunction with the approval for the certificate of authority for California. This agreement requires Agents to maintain a minimum of $8.0 million in policyholder surplus. If Agents falls below this requirement in any given quarter, Incenter must contribute cash, cash equivalents securities or other instruments to bring Agents to compliance. The Company’s insurance company subsidiaries met the existing minimum statutory capital and surplus requirements as of March 31, 2021.

The Company is also required to maintain bonds, certificates of deposit and interest bearing accounts in accordance with applicable state regulatory requirements. The total requirement was $3.8 million across all states as of March 31, 2021. The Company was in compliance with these requirements as of March 31, 2021.


29.

Concentrations of Risk

The Company’s activities are subject to significant risks and uncertainties, including the ability of management to adequately develop its service lines, acquire adequate customer and revenue bases, and overall market demand for its services. In addition, the Company engages in various trading and brokerage activities in which counterparties primarily include broker-dealers, banks and other financial institutions. In the event counterparties do not fulfill


F-172


Table of Contents

Finance of America Equity Capital LLC and Subsidiaries

Notes to Unaudited Consolidated Financial Statements


their obligations, the Company may be exposed to risk. The risk of default depends on the creditworthiness of the counterparty or issuer of the instrument. It is the Company’s policy to review, as necessary, the credit standing of each counterparty.

Financial instruments, which potentially subject the Company to credit risk, consist of cash and cash equivalents, derivatives, loans held for sale, and loans held for investment.

The Company invests its excess cash balances that may exceed federal insured limits with financial institutions evaluated as being creditworthy, primarily in money market accounts which are exposed to minimal interest rate and credit risk. The balances of these accounts are insured by the Federal Deposit Insurance Corporation, subject to certain limitations.

Credit risk is reduced by the Company’s underwriting standards, monitoring pledged collateral and other in-house monitoring procedures performed by management. The Company’s credit exposure for amounts due from investors and derivative related receivables is minimized since its policy is to sell mortgages only to highly reputable and financially sound financial institutions.

Mortgage loans are sold or financed through one of the following methods: (i) sales or financing securitizations to or pursuant to programs sponsored by FNMA, FHLMC, and GNMA, or (ii) sales or financing securitizations issued to private investors. The Company sold $7,696.6 million and $3,576.3 million in mortgage loans to FNMA, FHLMC and GNMA for the three months ended March 31, 2021 and 2020, respectively. The Company sold to or securitized with private investors $1,724.3 million and $1,500.8 million in mortgage loans for the three months ended March 31, 2021 and 2020, respectively. For the three months ended March 31, 2021, the sales or financing securitizations issued to private investors consisted of 33.1% nonperforming repurchased loans and 66.9% other. For the three months ended March 31, 2020, the sales or financing securitizations issued to private investors consisted of 13.3% non-agency reverse mortgage loans, 24.8% nonperforming repurchased loans, 11.4% third-party financial institutions, and 50.5% other.

Through FoA’s parent, the Company is owned by Libman Family Holdings, LLC, certain investment funds affiliated with Blackstone and other co-investors. In the ordinary course of conducting business, a portion of these mortgage loans sold or financed relate to certain commercial transactions that the Company enters into with a counterparty that is a non-affiliated company separately owned by certain other investment funds affiliated with Blackstone. The nature of its business interactions with this counterparty may allow the Company to negotiate preferential terms of commercial transactions that may not be available for other parties on an arm’s-length basis. These commercial transactions include the transfer of certain residential mortgage loans, in which the Company may receive an ongoing service fee. The Company sold $84.6 million and $98.7 million in mortgage loans to non-affiliated Blackstone portfolio companies for the three months ended March 31, 2021 and 2020, respectively. In addition, the Company is also contracted by certain non-affiliated Blackstone portfolio companies to provide sub-advisor services in areas such as asset management and administrative oversight, in which the Company receives an advisory fee. The Company has recognized gains on the sale of mortgages related to transactions with non-affiliated Blackstone portfolio companies of $4.0 million and $4.7 million for the three months ended March 31, 2021 and 2020, respectively.

In May 2020, the Company entered into an uncommitted Master Repurchase Agreement with a non-affiliated company, separately owned by other investment funds affiliated with Blackstone, with no stated maturity with a financial institution, under which the Company may enter into transactions, for an aggregate amount of $18.6 million, in which the Company agrees to transfer to the non-affiliated company certain mortgage-backed


F-173


Table of Contents

Finance of America Equity Capital LLC and Subsidiaries

Notes to Unaudited Consolidated Financial Statements


securities against the transfer of funds by the non-affiliated company, with a simultaneous agreement by the non-affiliated company to transfer such mortgage-backed securities to the Company at a certain date, or on demand, against the transfer of funds by the Company. As of March 31, 2021 and December 31, 2020, the Company had no outstanding borrowings.

In July 2017, the Company entered into a $45.0 million mezzanine financing agreement with a non-affiliated company, separately owned by other investment funds affiliated with Blackstone, secured by a junior lien in mortgage assets pledged to certain senior secured warehouse facilities. This facility was structured as a loan and security agreement. The funds advanced are generally repaid using collections from the underlying assets to the extent remaining after the payment of any senior debt or the proceeds from the sale or securitization of the underlying assets or distribution from underlying securities, although prior payment may be required based on, among other things, certain breaches of representations and warranties or other events of default. As of March 31, 2021 and December 31, 2020, the Company had outstanding borrowings of $25.0 million and $21.5 million, respectively.

Residential Mortgages

The mortgaged properties securing the residential loans that we service are geographically dispersed throughout the United States. Certain states may experience future weakened economic conditions or greater rates of decline in real estate values than the United States in general. In addition, certain states may change their licensing or other regulatory requirement to make servicing loans in these states cost-prohibitive.

The table below provides the percentage of residential mortgage loans serviced by the location in which the home securing the loan is located and is based on the outstanding UPB. “Other” consists of loans in states in which concentration individually represents less than 5% of total remaining UPB.


     March 31, 2021     December 31, 2020  

California

     36     37

Oregon

     8       7  

Washington

     8       8  

Arizona

     6       6  

New Jersey

     5       5  

Other

     37       37  


     100     100 % 


Reverse Mortgages

FAR originates, buys and sells HECMs, commonly referred to as reverse mortgages, and securitizes and sells the HECMs as HMBS. FAR is subject to approval of, and is heavily regulated by, federal and state regulatory agencies as a mortgage lender, GNMA issuer, broker and servicer.

The secondary market for the FHA insured HECM loans is not assured; to the extent the program requires Congressional appropriations in future years, which are not forthcoming, the program could be jeopardized; and/or, consumer demand could be reduced if FHA actions result in a reduction of initial principal limit available to borrowers.

FAR depends on its ability to securitize reverse mortgages, subsequent draws, mortgage insurance premiums and servicing fees, and would be adversely affected if the ability to access the secondary market were to be limited.


F-174


Table of Contents

Finance of America Equity Capital LLC and Subsidiaries

Notes to Unaudited Consolidated Financial Statements


Concentrations of credit risk associated with reverse mortgage loans are limited due to the large number of customers and their dispersion across many geographic areas. The table below provides the percentage of reverse loans in the Company’s Consolidated Statements of Financial Condition by the location in which the home securing the loan is located and is based on their remaining UPBs. “Other” consists of loans in states in which concentration individually represents less than 5% of total remaining UPB.


     March 31, 2021     December 31, 2020  

California

     44     44

New York

     8       8  

Florida

     5       5  

Texas

     5       5  

Other

     38       38  


     100     100


A significant portion of the Company’s proprietary Jumbo products are originated within the state of California. The Company’s non-agency reverse mortgage production is concentrated by location is presented in the following table. The Company’s total origination volume in any other states did not exceed 5% of the total origination volume, and were included in the “Other” balance.


     March 31, 2021     December 31, 2020  

California

     83     84

Other

     17       16  


     100     100


Loans previously repurchased out of a HMBS pool (“HECM Buyouts”) that were subsequently securitized also contain concentrations of credit risk as they are limited due to the dispersion across many geographic areas. The table below provides the percentage of securitized nonperforming HECM buyouts in the Company’s Consolidated Statements of Financial Condition by the location in which the home securing the loan is located and is based on their remaining UPBs. “Other” consists of loans in states in which concentration individually represents less than 5% of total remaining UPB.


     March 31, 2021     December 31, 2020  

Puerto Rico

     17     21

New York

     16       15  

California

     11       9  

Texas

     10       9  

New Jersey

     5       5  

Other

     41       41  


     100     100


Puerto Rico’s economy has been in a serious recession since the second quarter of 2006, and its economic downturn has been generally much worse than that of the United States. Further, Hurricane Maria in 2017 has further stressed the economy and infrastructure in Puerto Rico, resulting in extensive loss of water supplies and electricity.


F-175


Table of Contents

Finance of America Equity Capital LLC and Subsidiaries

Notes to Unaudited Consolidated Financial Statements


Regulatory agencies require all properties in affected areas to be inspected for “acceptable” condition prior to any transaction occurring with or on behalf of the GSEs or HUD (including foreclosure sale, property conveyance, sale/ funding/transfers of originated loans to third parties, etc.). This required inspection may cause delays in foreclosures and settlement of claims. Additionally, in certain circumstances when there are uninsured losses, the Company may be responsible for repairs to the properties if not done by the homeowner.

In its determination of fair value amounts for loans that are in disaster impacted areas, the Company has provided for increased expectations of loss severities due to delays in processing claims and uninsured losses. These estimates are based on management’s best estimates of anticipated losses. Actual results may differ from the estimates due to external factors.


Commercial Mortgages

The economies of states where mortgage properties are concentrated may be adversely affected to a greater degree than the economies of other areas of the country. In recent years, certain regions of the United States have experienced significant downturns in the market value of real estate. The table below provides the percentage of loans on the Company’s Consolidated Statements of Financial Condition by the location in which the home securing the loan is located and is based on their remaining UPBs. “Other” consists of loans in states in which concentration individually represents less than 5% of total remaining UPB.


     March 31, 2021     December 31, 2020  

Illinois

     9     7

Minnesota

     9       5  

New Jersey

     9       9  

New York

     7       7  

California

     6       9  

Connecticut

     6       5  

Florida

     5       6  

Texas

     5       5  

Other

     44       47  


     100 %      100


Incenter

The Company had two major referral partners accounting for approximately 21% and 29% of the Company’s title and closing revenue for the three months ended March 31, 2021 and 2020, respectively.

Ratings have always been an important factor in establishing the competitive position of insurance companies. Ratings reflect the opinion of a rating agency with regard to an insurance company’s or insurance holding company’s financial strength, operating performance and ability to meet its obligations to policyholders and are not evaluations directed to investors. The Company’s insurance subsidiary is rated by Demotech and as of March 31, 2021 the rating assigned was A (Exceptional). The Company is subject to continued periodic review by the rating agency and the continued retention of the rating cannot be assured. If the rating is reduced from the current level or the ratings of the Company’s insurance title underwriter are downgraded, the results of operations could be adversely affected.


F-176


Table of Contents

Finance of America Equity Capital LLC and Subsidiaries

Notes to Unaudited Consolidated Financial Statements


30.

Related Party Transactions

The Company transacts with various related parties as a part of normal day-to-day operations. Outstanding receivables from related parties were $1.5 million and $2.6 million as of March 31, 2021 and December 31, 2020, respectively.

Promissory Notes

In June 2019, the Company executed two Revolving Working Capital Promissory Note Agreements (the “2019 Promissory Notes”) with BTO Urban Holdings and Libman Family Holdings, LLC, which are deemed affiliates of the Company. The 2019 Promissory Notes accrued interest monthly at a rate of 10.0% per annum and matured and were paid in full in June 2020. For the three months ended March 31, 2020, the Company paid interest of $0.4 million related to the outstanding balances during the period on the 2019 Promissory Notes. For the three months ended March 31, 2021, the Company paid no interest related to the 2019 Promissory Notes.

Agricultural Loans

In 2019, the Company entered into an Amended and Restated Limited Liability Company Agreement with FarmOp Capital Holdings, LLC (“FarmOps”) in which the Company acquired an equity investment in FarmOps. Subsequent to this agreement, the Company agreed to purchase originated agricultural loans from FarmOps. For the three months ended March 31, 2021 and 2020, the Company purchased $83.0 million and $64.7 million of agricultural loans and had a total funded draw amounts of $82.1 million and $55.6 million, respectively.

The Company had promissory notes outstanding with FarmOps of $3.3 million and $0.8 million as of March 31, 2021 and December 31, 2020, respectively.

Cloudvirga

In 2017 and 2019, certain subsidiaries of the Company purchased preferred and common stock investments in Cloudvirga, Inc. (“Cloudvirga”). Subsequent to its investment, the Company entered into a software development arrangement in which Cloudvirga agreed to develop software in addition to providing certain technology services for the Company. As of March 31, 2021, $1.7 million was capitalized related to the development of the software and will be amortized over a 12 month period from the date placed in service. For the three months ended March 31, 2021 and 2020, $0.6 million in professional fees were paid to Cloudvirga in exchange for the technology services provided.

In May 2021, the Company was notified of the merger of Cloudvirga with an unaffiliated third party, effectively liquidating all of the preferred equity held by certain subsidiaries of the Company. As such, the fair value assumptions used to determine the holding value of such preferred equity were updated by the Company and resulted in an impairment of the equity investment of $9.3 million. See Note 32 - Subsequent Events for additional detail on the merger of Cloudvirga.

Nonrecourse MSR Financing Liability, at Fair Value

In 2020, the Company entered into a nonrevolving facility commitment with various investors of UFG, the parent company of FoA, to sell beneficial interests in the servicing fees generated from its originated or acquired MSRs. Under these agreements, the Company has agreed to sell to these parties the right to receive all servicing fees in excess of the cost to service and ancillary fees related to the identified MSRs in exchange for an upfront payment equal to the purchase price or fair value of the identified MSRs. These transactions are accounted for as financings under ASC 470, Debt.


F-177


Table of Contents

Finance of America Equity Capital LLC and Subsidiaries

Notes to Unaudited Consolidated Financial Statements


As of March 31, 2021 and December 31, 2020, the Company had an outstanding advance of $22.4 million and $14.9 million against this commitment for the purchase of MSRs with a fair value of $22.1 million and $14.1 million, respectively.

The Company has also entered into Investment Management Agreements with these third parties to serve as the investment manager, in which the Company performs various advisory services to the investors in exchange for a management fee.

Senior Notes

Related parties of FoA purchased notes in the high-yield debt offering in November 2020 in an aggregate principal amount of $135.0 million.


31.

Condensed Financial Information of Registrant (Parent Company Only)

Finance of America Equity Capital LLC

(Parent company only)

Condensed Statements of Financial Condition

(Dollars in thousands)


     March 31, 2021      December 31, 2020  

ASSETS


Fixed assets and leasehold improvements, net

   $ 22      $ 23  

Investment in subsidiaries

     647,930        638,866  

Other assets, net

     1,853        2,184  


TOTAL ASSETS

   $ 649,805      $ 641,073  


LIABILITIES AND MEMBER’S EQUITY


Payables and other liabilities

     8,635        13,033  


TOTAL LIABILITIES

     8,635        13,033  


TOTAL MEMBER’S EQUITY

     641,170        628,040  


TOTAL LIABILITIES, CRNCI, AND MEMBER’S EQUITY

   $ 649,805      $ 641,073  


F-178


Table of Contents

Finance of America Equity Capital LLC and Subsidiaries

Notes to Unaudited Consolidated Financial Statements


Finance of America Equity Capital LLC

(Parent Company Only)

Condensed Statements of Operations and Comprehensive Income

(Dollars in thousands)


     For the three months ended March 31,  
             2021                     2020          

REVENUES


Equity income (loss) from subsidiaries

   $ 128,925     $ (39,491

Interest expense

     (46     (1,124


TOTAL REVENUES

     128,879       (40,615


EXPENSES


Salaries and benefits

     4,041       1,101  

Occupancy and equipment rentals

     161       169  

General and administrative

     357       521  


TOTAL EXPENSES

     4,559       1,791  


NET INCOME (LOSS) BEFORE TAXES

     124,320       (42,406


NET INCOME (LOSS)

     124,320       (42,406


COMPREHENSIVE INCOME (LOSS)

   $ 124,320     $ (42,406


As disclosed in Note 2, FoA is a holding company and wholly owned subsidiary of UFG that was formed in July 2020. FoA did not have any cash as of March 31, 2021, accordingly Condensed Statements of Cash Flows have not been presented. Management determined which assets and liabilities were to be used by the operating subsidiaries, and these amounts have been appropriately excluded from the parent company Condensed Statements of Financial Position of FoA presented above. Changes in these balances are reflected as additional contributions and distributions from UFG in the period in which they occur, and had no impact on any cash balances that may have otherwise been maintained at FoA.

Basis of Presentation

The parent company financial statements should be read in conjunction with the Company’s Consolidated Financial Statements and the accompanying notes thereto. The parent company follows the same accounting policies as disclosed in Note 2 to the Company’s Consolidated Financial Statements. For purposes of this condensed financial information, the Company’s wholly owned and majority owned subsidiaries are recorded based upon its proportionate share of the subsidiaries net assets (similar to presenting them on the equity method).

Since restricted net assets of FoA and its subsidiaries exceed 25% of the consolidated net assets of the Company and its subsidiaries, the accompanying condensed parent company financial statements have been prepared in accordance with Rule 12-04 Schedule 1 of Regulation S-X.

Dividends from Subsidiaries

There were $75.0 million cash dividends paid to FoA from the Company’s consolidated subsidiaries for the three months ended March 31, 2021. There were no cash dividends paid to FoA from the Company’s consolidated subsidiaries for the three months ended March 31, 2020.


F-179


Table of Contents

Finance of America Equity Capital LLC and Subsidiaries

Notes to Unaudited Consolidated Financial Statements


32.

Subsequent Events

The Company has evaluated subsequent events from the date of the Consolidated Financial Statements of March 31, 2021 through May 17, 2021, the date these Consolidated Financial Statements were issued. No events or transactions were identified that would have an impact on the financial position or results of operations of the Company as of March 31, 2021 as reported herein. However, management of the Company believes disclosure of the following events is appropriate.

Business Combination

On April 1, 2021, the Company was acquired in the Business Combination pursuant to the Transaction Agreement described in Note 1 - Organization and Description of Business. The Business Combination will be accounted for using the acquisition method with New Pubco as the accounting acquirer. Under the acquisition method of accounting, New Pubco’s assets and liabilities will be recorded at carrying value and the assets and liabilities associated with the Company will be recorded at estimated fair value as of the acquisition date. The excess of the purchase price over the estimated fair values of the net assets acquired, if applicable, will be recognized as goodwill. For accounting purposes, the acquirer is the entity that has obtained control of another entity and, thus, consummated a business combination. The determination of whether control has been obtained begins with the evaluation of whether control should be evaluated based on the variable interest or voting interest model pursuant to ASC Topic 810, Consolidation (“ASC 810”). If the acquiree is a variable interest entity, the primary beneficiary would be the accounting acquirer. The Company meets the definition of a variable interest entity and New Pubco was determined to be the primary beneficiary. Therefore, New Pubco will be the accounting acquirer.

In connection with the Business Combination, the New Pubco also entered into Tax Receivable Agreements (“TRAs”) that provide for the payment by the New Pubco to certain owners of FoA prior to the Business Combination of 85% of the cash tax benefits, if any, that the Company is deemed to realize based on certain attributes as defined in the TRAs.

In conjunction with the Business Combination, UFG adopted the Amended and Restated UFG Holdings LLC Management Long-Term Incentive Plan (the “A&R MLTIP”), effective as of the date the Business Combination was executed, contingent upon the occurrence of the Closing. Under the terms of the A&R MLTIP, it is expected that participants (including each of our named executive officers) will be entitled to receive (i) a cash payment promptly following the Closing (see Note 24), (ii) a grant of restricted stock units under the Incentive Plan and (iii) the right to receive additional shares of Class A Common Stock upon the occurrence of specified earnout conditions. The Replacement RSUs will be effectively vested on the Closing Date. The Replacement RSUs will be 25% vested on the RSU Closing Date and the remaining 75% will vest in equal installments on each of the first three anniversaries of the Closing Date, subject to continued employment. The Replacement RSUs are not subject to any other conditions which affect their vesting. The first 25% of Replacement RSUs will not be delivered to the participants until 180 days after Closing.

In connection with the closing of the Business Combination, FoA caused Finance of America Holdings LLC to exercise its right under the FACo Holdings Agreement to purchase all of the outstanding Class B Units held by B2R for a redemption price of $203.2 million in satisfaction of the applicable Hurdle Amount under the FACo Holdings Agreement.


F-180


Table of Contents

Finance of America Equity Capital LLC and Subsidiaries

Notes to Unaudited Consolidated Financial Statements


Parkside Acquisition

On April 6, 2021, the Company entered into an agreement to acquire certain assets (primarily workforce) of Parkside Lending, LLC (“Parkside”) a wholesale, retail and correspondent mortgage lender. The transaction closed on May 4, 2021. The Company purchased certain key contracts and real property leases, and assumed the post-closing liabilities thereunder, as well as proprietary materials and intellectual property, for a purchase price equal to the sum of (a) $20.0 million paid at closing, (b) an additional contingent premium of $5.0 million payable six months after the closing date only to the extent certain conditions are met, and (c) additional annual earn out amounts based upon certain specified profitability metrics as of the first, second and third anniversaries of the closing date and payable in six (6) month increments during such three (3) year period. The Company also extended offers to certain identified employees. Additionally, the Company agreed to provide limited interim support obligations and to act as the purchaser of last resort for Parkside’s mortgage loan pipeline to the extent such pipeline loans are not sold by Parkside to third party purchasers within one hundred and twenty (120) days after the closing date.

Additional disclosures required by ASC 805, Business Combinations, with respect to the acquisition have been omitted because the information needed for the disclosures is not currently available due to the close proximity of closing of this transaction with the date these consolidated financial statements are being issued.

Securitizations

Investor Purpose Asset Securitization

In April 2021, the Company securitized approximately $336.5 million of its investor purpose residential mortgage assets, through the issuance of approximately $268.5 million of mortgage backed notes, which accrue interest at an annual rate of 2.12% - 5.44% on a weighted average based on the principal balance of the notes and have a scheduled final maturity dates occurring between November 2024 and May 2025, based on the applicable class of notes. The principal and interest on the outstanding notes will be paid using the cash flows from the related investor purpose residential mortgage assets, which serve as collateral for the debt. The securitization is callable by the Company with the optional redemption date being any date after the 24th monthly payment date (occurring in May 2023). This securitization will be accounted for as a secured financing in the Company’s Consolidated Statements of Financial Condition. Certain of the investor purposes residential mortgage assets included in the April 2021 securitization were from three of the Company’s prior securitizations. The Company exercised its optional redemption right relating to such prior securitizations in April 2021. In connection with its optional redemptions in April 2021, the Company paid off notes secured by investor purpose residential mortgage assets with an aggregate outstanding principal balance of $236.8 million. The notes were paid off at the related redemption price, which was par.

Reverse Loan Securitization

In April 2021, the Company securitized approximately $435.6 million of its reverse mortgage loans, through the issuance of approximately $562.5 million of mortgage backed notes, which accrue interest at an annual rate of 1.6% on a weighted average based on the principal balance of the notes and have a scheduled final maturity date occurring in April 2051. The principal and interest on the outstanding notes will be paid using the cash flows from the related reverse mortgage loans, which serve as collateral for the debt. The securitization is callable by the Company with the optional redemption date being any date beginning with the payment date occurring in April 2024. This securitization will be accounted for as a secured financing in the Company’s Consolidated Statements of Financial Condition. Certain of the reverse mortgage loans included in the April 2021 securitization were from the Company’s prior securitization. The optional redemption for the prior securitization


F-181


Table of Contents

Finance of America Equity Capital LLC and Subsidiaries

Notes to Unaudited Consolidated Financial Statements


was exercised by the Company in April 2021. In connection with its optional redemption in April 2021, the Company paid off notes secured by reverse mortgage loans with an aggregate outstanding principal balance of $251.7 million. The notes were paid off at the related redemption price, which was par plus 5%.

Financing Lines of Credit

Mortgage Lines

The May 2021 $250.0 million facility was amended in April 2021. Under the terms of the new amended agreement, the maturity date was extended to April 2022.

The July 2021 $150.0 million facility was amended in April 2021. Under the terms of the new amended agreement, the borrowing capacity was increased from $150.0 million to $200.0 million.

The November 2021 $150.0 million facility was amended in May 2021. Under the terms of the new amended agreement, the borrowing capacity was increased from $150.0 million to $200 million and the maturity date was extended to May 2022.

The April 2021 $350.0 million facility was amended in May 2021. Under the terms of the new amended agreement, the maturity date was extended to May 2022.

The February 2021 $50M facility - MSR was paid off and terminated in February 2021.

Reverse Lines

The April 2021 $250.0 million facility was amended in April 2021. Under the terms of the new amended agreement, the maturity date was extended to March 2022.

Other Secured

In April 2021, the Company entered into a securities repurchase facility for $4.4 million with rolling one-month maturity dates beginning on May 28, 2021.

The April 2021 $50.0 million facility was amended in April 2021. Under the terms of the new amended agreement, the maturity date was extended to April 2022.

The April 2021 $200.0 million facility was amended in April 2021. Under the terms of the new amended agreement, the maturity date was extended to May 2021.

Cloudvirga

In May 2021, CloudVirga entered into an agreement and plan of merger (the “Merger Agreement”) with an unaffiliated third party buyer (“Buyer”), pursuant to which a wholly-owned subsidiary of Buyer would merge with and into CloudVirga with CloudVirga being the surviving corporation (the “Merger”). Upon the closing of the Merger on May 21, 2021, all preferred and common equity of CloudVirga held by FAM was effectively liquidated. Accordingly, the fair value assumptions used to determine the holding value of such preferred and common equity were updated by the Company as of March 31, 2021, which resulted in an impairment of the equity investment of $9.3 million as recorded in the Consolidated Statements of Operations. In connection with the closing of the Merger, the convertible note made by CloudVirga in favor of FAM in the principal amount of $6 million was repaid in an amount equal to 106% of principal, plus accrued and unpaid interest, in accordance with the terms of the convertible note.


F-182


Table of Contents

Finance of America Equity Capital LLC and Subsidiaries

Notes to Unaudited Consolidated Financial Statements


Related Party Transactions

FAM Third Party MSR Fund

In February 2021, FAM entered into a $350.0 million nonrevolving facility commitment with unaffiliated third party investors. Repayment of amounts drawn from the facility are repaid from excess servicing fees as well as net operating cash flows from certain identified MSRs. During April 2021, advances of $37.6 million were received by the Company.


F-183


Table of Contents

Report of Independent Registered Public Accounting Firm

Shareholders and Board of Directors

Finance of America Companies Inc. on behalf of Replay Acquisition Corp

Charlotte, NC

Opinion on the Financial Statements

We have audited the accompanying balance sheets of Replay Acquisition Corp (the “Company”) as of December 31, 2020 and 2019, the related statements of operations, shareholders’ equity, and cash flows for each of the two years in the period ended December 31, 2020, and the related notes (collectively referred to as the “financial statements”). In our opinion, the financial statements present fairly, in all material respects, the financial position of the Company at December 31, 2020 and 2019, and the results of its operations and its cash flows for each of the two years in the period ended December 31, 2020, in conformity with accounting principles generally accepted in the United States of America.

Restatement of Financial Statements

As discussed in Note 1 and 8 to the financial statements, the accompanying financial statements have been restated to correct the classification and accounting for warrants as liabilities, and to correct the classification and accounting for redeemable ordinary shares as mezzanine equity carried at redemption value.

These financial statements were originally audited by another independent registered public accounting firm whose report was dated March 24, 2021.

Basis for Opinion

These financial statements are the responsibility of the Company’s management. Our responsibility is to express an opinion on the Company’s financial statements based on our audits. We are a public accounting firm registered with the Public Company Accounting Oversight Board (United States) (“PCAOB”) and are required to be independent with respect to the Company in accordance with the U.S. federal securities laws and the applicable rules and regulations of the Securities and Exchange Commission and the PCAOB.

We conducted our audits in accordance with the standards of the PCAOB. Those standards require that we plan and perform the audit to obtain reasonable assurance about whether the financial statements are free of material misstatement, whether due to error or fraud. The Company is not required to have, nor were we engaged to perform, an audit of its internal control over financial reporting. As part of our audits we are required to obtain an understanding of internal control over financial reporting but not for the purpose of expressing an opinion on the effectiveness of the Company’s internal control over financial reporting. Accordingly, we express no such opinion.

Our audits included performing procedures to assess the risks of material misstatement of the financial statements, whether due to error or fraud, and performing procedures that respond to those risks. Such procedures included examining, on a test basis, evidence regarding the amounts and disclosures in the financial statements. Our audits also included evaluating the accounting principles used and significant estimates made by management, as well as evaluating the overall presentation of the financial statements. We believe that our audits provide a reasonable basis for our opinion.

/s/ BDO USA, LLP

We have served as the Company’s auditor since 2021.

Charlotte, NC

May 17, 2021


F-184


Table of Contents

REPLAY ACQUISITION CORP.

BALANCE SHEETS

(AS RESTATED)


     December 31,  
     2020     2019  
     (As Restated)     (As Restated)  

Assets:


Current assets:


Cash

   $ 849,909   $ 1,589,795

Prepaid expenses

     10,833     62,738


Total current assets

     860,742     1,652,533

Investments held in Trust Account

     293,315,407     292,054,158


Total assets

   $ 294,176,149   $ 293,706,691


Liabilities and Shareholders’ Equity:


Current liabilities:


Accounts payable

   $ 916,939   $ 86,595

Accrued expenses

     779,411     8,860


Total current liabilities

     1,696,350     95,455

Warrant liability

     35,351,250     18,817,500

Deferred underwriting commissions

     9,187,500     9,187,500


Total liabilities

     46,235,100     28,100,455

Commitments and contingencies (Note 5)


Ordinary shares, $0.0001 par value; 28,750,000 shares subject to possible redemption at $10.00 per share at December 31, 2020 and 2019

     287,500,000      
287,500,000
 

Shareholders’ Equity:


Preference shares, $0.0001 par value; 2,000,000 shares authorized; none issued and outstanding

     —         —    

Ordinary shares, $0.0001 par value; 200,000,000 shares authorized; 7,187,500 shares issued and outstanding (excluding 28,750,000 shares subject to possible redemption) at December 31, 2020 and 2019

     719     719

Additional paid-in capital

     —         —    

Accumulated deficit

     (39,559,670     (21,894,483


Total shareholders’ equity

     (39,558,951    
(21,893,764


Total Liabilities and Shareholders’ Equity

   $ 294,176,149   $ 293,706,691


The accompanying notes are an integral part of these financial statements.


F-185


Table of Contents

REPLAY ACQUISITION CORP.

STATEMENTS OF OPERATIONS

(AS RESTATED)


     For the years ended
December 31,
 
     2020     2019  
     (As Restated)     (As Restated)  

General and administrative expenses

   $ 2,392,686   $ 327,399


Loss from operations

     (2,392,686     (327,399

Issuance costs allocated to the public warrants

     —         (648,239

(Loss) gain on revaluation of warrant liability

     (16,533,750     520,000  

Gain on marketable securities, dividends and interest held in Trust Account

     1,261,249     4,554,158


Net (loss) income

   $ (17,665,187   $ 4,098,520  


Basic and diluted weighted average shares outstanding of Public Shares

     28,750,000     28,750,000


Basic and diluted net (loss) income per share, Public Shares

   $ (0.48   $ 0.33  


Basic and diluted weighted average shares outstanding of Founder Shares

     7,187,500     7,187,500


Basic and diluted net loss per share, Founder Shares

   $ (0.53   $ (0.76)  


The accompanying notes are an integral part of these financial statements.


F-186


Table of Contents

REPLAY ACQUISITION CORP.

STATEMENTS OF CHANGES IN SHAREHOLDERS’ EQUITY

(AS RESTATED)


     Ordinary Shares      Additional Paid-In
Capital
   

Accumulated
Deficit

    Total Shareholders’
Equity
 
     Shares      Amounts  

Balance - December 31, 2018, as previously reported

   $ 7,187,500    $ 719    $ 24,281     (2,694   $ 22,306


Proceeds from sale of private warrants in excess of fair value

           775,000       —         775,000  

Remeasurement of ordinary shares subject to possible redemption

           (799,281     (25,990,309     (26,789,590

Net income, as restated

     —          —          —         4,098,520       4,098,520  


Balance - December 31, 2019, as restated

     7,187,500    $ 719      $ —       $ (21,894,483   $ (21,893,764


Net loss, as restated

     —          —          —         (17,665,187     (17,665,187


Balance - December 31, 2020, as restated

     7,187,500    $ 719    $ —       $ (39,559,670   $ (39,558,951


The accompanying notes are an integral part of these financial statements.


F-187


Table of Contents

REPLAY ACQUISITION CORP.

STATEMENTS OF CASH FLOWS

(AS RESTATED)


     For the years ended December 31,  
     2020     2019  
     (As Restated)     (As Restated)  

Cash Flows from Operating Activities:


Net (loss) income

   $ (17,665,187   $ 4,098,520  
Adjustments to reconcile net (loss) income to net cash used in operating activities:


Gain on marketable securities, dividends and interest held in Trust Account

     (1,261,249     (4,554,158

Loss (gain) on revaluation of warrant liability

     16,533,750     (520,000
Changes in operating assets and liabilities:     

Prepaid expenses

     51,905     (62,738

Accounts payable

     830,344     83,995

Accrued expenses

     770,551     6,166


Net cash used in operating activities

     (739,886 )      (948,215


Cash Flows from Investing Activities:


Cash deposited in Trust Account

     —         (287,500,000


Net cash used in investing activities

     —         (287,500,000


Cash Flows from Financing Activities:


Proceeds from note payable to related party

     —         250,000

Repayment of note payable and advances from related party

     —         (250,000

Proceeds received from initial public offering

     —         287,500,000

Proceeds from private placement

     —         7,750,000

Offering costs paid

     —         (5,236,990


Net cash provided by financing activities

     —         290,013,010


Net change in cash

     (739,886     1,564,795

Cash - beginning of year

     1,589,795     25,000


Cash - end of year

   $ 849,909   $ 1,589,795


Supplemental disclosure of noncash activities:


Offering costs included in accounts payable

   $ —       $ 2,600

Remeasurement of ordinary shares subject to possible redemption

   $ —       $ 26,789,590  

Deferred underwriting commissions

   $ —       $ 9,187,500  

The accompanying notes are an integral part of these financial statements.


F-188


Table of Contents

REPLAY ACQUISITION CORP.

NOTES TO FINANCIAL STATEMENTS

NOTE 1. DESCRIPTION OF ORGANIZATION AND BUSINESS OPERATIONS

Organization and General

Replay Acquisition Corp. (the “Company”) was incorporated as a Cayman Islands exempted company on November 6, 2018. The Company was formed for the purpose of effecting a merger, amalgamation, share exchange, asset acquisition, share purchase, reorganization or similar business combination with one or more businesses (the “Business Combination”). The Company is an emerging growth company and, as such, the Company is subject to all of the risks associated with emerging growth companies.

On October 12, 2020, the Company; Finance of America Equity Capital LLC, a Delaware limited liability company (“FoA”); Finance of America Companies Inc., a Delaware corporation and wholly owned subsidiary of the Company (“New Pubco”); RPLY Merger Sub LLC, a Delaware limited liability company and wholly owned subsidiary of New Pubco (“Replay Merger Sub”); RPLY BLKR Merger Sub LLC, a Delaware limited liability company and wholly owned subsidiary of New Pubco (“Blocker Merger Sub”); Blackstone Tactical Opportunities Fund (Urban Feeder) – NQ L.P., a Delaware limited partnership (“Blocker”); Blackstone Tactical Opportunities Associates – NQ L.L.C., a Delaware limited liability company (“Blocker GP”); BTO Urban Holdings L.L.C., a Delaware limited liability company (“BTO Urban”), Blackstone Family Tactical Opportunities Investment Partnership – NQ – ESC L.P., a Delaware limited partnership (“ESC”), Libman Family Holdings LLC, a Connecticut limited liability company (“Family Holdings”), The Mortgage Opportunity Group LLC, a Connecticut limited liability company (“TMO”), L and TF, LLC, a North Carolina limited liability company (“L&TF”), UFG Management Holdings LLC, a Delaware limited liability company (“Management Holdings”), and Joe Cayre (each of BTO Urban, ESC, Family Holdings, TMO, L&TF, Management Holdings and Joe Cayre, a “Seller” and, collectively, the “Sellers”); and BTO Urban and Family Holdings, solely in their joint capacity as the representative of the Sellers pursuant to Section 12.18 of the Transaction Agreement (as defined below) (the “Seller Representative”), entered into a Transaction Agreement (the “Transaction Agreement”), pursuant to which the Company agreed to combine with FoA in a series of transactions (collectively, the “Proposed Business Combination”) that will result in New Pubco becoming a publicly-traded company on the New York Stock Exchange (“NYSE”) and controlling FoA in an “UP-C” structure. See the Proposed Business Combination described below.

As of December 31, 2020, the Company had not commenced any operations. All activity for the period from November 6, 2018 (inception) through December 31, 2020 relates to the Company’s formation, the Company’s initial public offering (the “Initial Public Offering”) described below, and since the Initial Public Offering, the search for a potential target including the costs incurred in connection with the Proposed Business Combination. The Company will not generate any operating revenues until after the completion of its initial Business Combination, at the earliest. The Company generates non-operating income in the form of investment income on cash and cash equivalents from the proceeds derived from the Initial Public Offering.

Sponsor and Initial Public Offering

The Company’s sponsor is Replay Sponsor, LLC, a Delaware limited liability company (the “Sponsor”). The Company’s ability to commence operations is contingent upon obtaining adequate financial resources. The registration statement for the Company’s Initial Public Offering was declared effective on April 3, 2019. On April 8, 2019, the Company consummated its Initial Public Offering of 28,750,000 units (“Units”), including the issuance of 3,750,000 Units as a result of the underwriters’ full exercise of their over-allotment option, at $10.00 per Unit, generating gross proceeds of $287.5 million, and incurring offering costs of approximately $15.0 million, inclusive of approximately $9.2 million in deferred underwriting commissions (Note 5).


F-189


Table of Contents

REPLAY ACQUISITION CORP.

NOTES TO FINANCIAL STATEMENTS


Simultaneously with the closing of the Initial Public Offering, the Company consummated the private placement (“Private Placement”) of 7,750,000 warrants (each, a “Private Placement Warrant” and collectively, the “Private Placement Warrants”) at a price of $1.00 per Private Placement Warrant to the Sponsor, generating gross proceeds of $7.75 million (Note 4).

NYSE Notice

On August 15, 2019, we received a written notice (the “Notice”) from the staff of NYSE Regulation of the New York Stock Exchange (“NYSE”) indicating that the Company was not then in compliance with Section 802.01B of the NYSE Listed Company Manual (the “Manual”), which requires us to maintain a minimum of 300 public shareholders on a continuous basis. Pursuant to the Notice, the Company was subject to the procedures set forth in Sections 801 and 802 of the Manual. The Company submitted a business plan that demonstrated how the Company expected to return to compliance with the minimum public shareholders requirement within 18 months of receipt of the Notice. On October 24, 2019, we were notified by the staff of NYSE Regulation that the NYSE’s Listings Operations Committee agreed to accept our business plan, and the Company was subject to quarterly monitoring for compliance with such plan. On November 5, 2020, we were notified by the staff of NYSE Regulation that we are a “company back in compliance” with Section 802.01B of the Manual. Our ordinary shares, warrants and Units, which trade under the symbols “RPLA,” “RPLA WS” and “RPLA.U,” respectively, continue to be listed and traded on the NYSE and no longer bear the indicator “.BC” on the consolidated tape to indicate noncompliance with the NYSE’s continued listing standards.

Trust Account

Upon the closing of the Initial Public Offering and Private Placement, $287.5 million ($10.00 per Unit) of the net proceeds of the sale of the Units in the Initial Public Offering and the Private Placement was placed in a trust account (the “Trust Account”), located in the United States at J.P. Morgan Chase Bank, N.A., with Continental Stock Transfer & Trust Company acting as trustee, and invested only in U.S. government securities, within the meaning set forth in Section 2(a)(16) of the Investment Company Act 1940, as amended (the “Investment Company Act”), with a maturity of 180 days or less or in any open-ended investment company that holds itself out as a money market fund selected by the Company meeting the conditions of paragraphs (d)(2), (d)(3) and (d)(4) of Rule 2a-7 of the Investment Company Act, as determined by the Company, until the earlier of: (i) the completion of a Business Combination and (ii) the distribution of the Trust Account as described below.

Initial Business Combination

The Company’s management has broad discretion with respect to the specific application of the net proceeds of the Initial Public Offering and the sale of Private Placement Warrants, although substantially all of the net proceeds are intended to be applied generally toward consummating a Business Combination. There is no assurance that the Company will be able to complete a Business Combination successfully. The Company must complete one or more initial Business Combinations having an aggregate fair market value of at least 80% of the assets held in the Trust Account (excluding the deferred underwriting commissions and taxes payable on income earned on the Trust Account) at the time of the agreement to enter into the initial Business Combination. However, the Company will only complete a Business Combination if the post-transaction company owns or acquires 50% or more of the outstanding voting securities of the target or otherwise acquires a controlling interest in the target sufficient for it not to be required to register as an investment company under the Investment Company Act.

The Company will provide its holders (the “Public Shareholders”) of its ordinary shares, par value $0.0001 per share, sold in the Initial Public Offering (the “Public Shares”), with the opportunity to redeem all or a portion of


F-190


Table of Contents

REPLAY ACQUISITION CORP.

NOTES TO FINANCIAL STATEMENTS


their Public Shares upon the completion of a Business Combination either (i) in connection with a shareholder meeting called to approve the Business Combination or (ii) by means of a tender offer. The decision as to whether the Company will seek shareholder approval of a Business Combination or conduct a tender offer will be made by the Company, solely in its discretion. The Public Shareholders will be entitled to redeem their Public Shares for a pro rata portion of the amount then in the Trust Account (initially anticipated to be $10.00 per Public Share). The per-share amount to be distributed to Public Shareholders who redeem their Public Shares will not be reduced by the deferred underwriting commissions the Company will pay to the underwriters (as discussed in Note 5). These Public Shares were classified as temporary equity upon the completion of the Initial Public Offering in accordance with the Financial Accounting Standards Board’s (“FASB”) Topic 480 Distinguishing Liabilities from Equity (“ASC 480”). In such case, the Company will proceed with a Business Combination if the Company has net tangible assets of at least $5,000,001 upon such consummation of a Business Combination and a majority of the shares voted are voted in favor of the Business Combination. If a shareholder vote is not required by law and the Company does not decide to hold a shareholder vote for business or other legal reasons, the Company will, pursuant to its Amended and Restated Memorandum and Articles of Association (the “Amended and Restated Memorandum and Articles of Association”), conduct the redemptions pursuant to the tender offer rules of the U.S. Securities and Exchange Commission (“SEC”) and file tender offer documents with the SEC prior to completing a Business Combination. If, however, shareholder approval of the transactions is required by law, or the Company decides to obtain shareholder approval for business or legal reasons, the Company will offer to redeem shares in conjunction with a proxy solicitation pursuant to the proxy rules and not pursuant to the tender offer rules. Additionally, each Public Shareholder may elect to redeem their Public Shares irrespective of whether they vote for or against the proposed transaction. If the Company seeks shareholder approval in connection with a Business Combination, the initial shareholders (as defined below) agreed to vote their Founder Shares (as defined below in Note 4) and any Public Shares purchased during or after the Initial Public Offering in favor of a Business Combination. Subsequent to the consummation of the Initial Public Offering, the Company will adopt an insider trading policy which will require insiders to: (i) refrain from purchasing shares during certain blackout periods and when they are in possession of any material non-public information and (ii) to clear all trades with the Company’s legal counsel prior to execution. In addition, the initial shareholders agreed to waive their redemption rights with respect to their Founder Shares and Public Shares in connection with the completion of a Business Combination.

Notwithstanding the foregoing, the Amended and Restated Memorandum and Articles of Association provide that a Public Shareholder, together with any affiliate of such shareholder or any other person with whom such shareholder is acting in concert or as a “group” (as defined under Section 13 of the Securities Exchange Act of 1934, as amended (the “Exchange Act”)), will be restricted from redeeming its shares with respect to more than an aggregate of 15% or more of the ordinary shares sold in the Initial Public Offering, without the prior consent of the Company.

The Company’s Sponsor, officers and directors (the “initial shareholders”) agreed not to propose an amendment to the Amended and Restated Memorandum and Articles of Association (a) that would modify the substance or timing of the Company’s obligation to redeem 100% of its Public Shares if the Company does not complete a Business Combination within 24 months from the closing of the Initial Public Offering, or April 8, 2021, (or such later date as may be approved by the Company’s shareholders in accordance with the Amended and Restated Memorandum and Articles of Association)(the “Combination Period”) or (b) with respect to any other provision relating to shareholders’ rights or pre-initial Business Combination activity, unless the Company provides the Public Shareholders with the opportunity to redeem their ordinary shares in conjunction with any such amendment.

If the Company is unable to complete a Business Combination within the Combination Period, the Company will (1) cease all operations except for the purpose of winding up, (2) as promptly as reasonably possible but no more


F-191


Table of Contents

REPLAY ACQUISITION CORP.

NOTES TO FINANCIAL STATEMENTS


than 10 business days thereafter, subject to lawfully available funds therefor, redeem the Public Shares, at a per-share price, payable in cash, equal to the aggregate amount then on deposit in the Trust Account, including interest (less up to $100,000 of interest to pay dissolution expenses and which interest shall be net of taxes payable), divided by the number of then issued and outstanding Public Shares, which redemption will completely extinguish Public Shareholders’ rights as shareholders (including the right to receive further liquidating distributions, if any), subject to applicable law, and (3) as promptly as reasonably possible following such redemption, subject to the approval of the Company’s remaining shareholders and its board of directors, wind up its affairs and subsequently dissolve , subject in each case to the Company’s obligations under Cayman Islands law to provide for claims of creditors and the requirements of other applicable law.

The initial shareholders agreed to waive their liquidation rights with respect to the Founder Shares if the Company fails to complete a Business Combination within the Combination Period. However, if the initial shareholders should acquire Public Shares in or after the Initial Public Offering, they will be entitled to liquidating distributions from the Trust Account with respect to such Public Shares if the Company fails to complete a Business Combination within the Combination Period. The underwriters agreed to waive their rights to their deferred underwriting commissions (see Note 5) held in the Trust Account in the event the Company does not complete a Business Combination within the Combination Period and, in such event, such amounts will be included with the other funds held in the Trust Account that will be available to fund the redemption of the Public Shares. In the event of such distribution, it is possible that the per share value of the residual assets remaining available for distribution (including Trust Account assets) will be less than the $10.00 per share initially held in the Trust Account. In order to protect the amounts held in the Trust Account, the Sponsor agreed to be liable to the Company if and to the extent any claims by a third party (other than the Company’s independent auditors) for services rendered or products sold to the Company, or a prospective target business with which the Company has discussed entering into a transaction agreement, reduce the amount of funds in the Trust Account below (1) $10.00 per Public Share or (2) such lesser amount per Public Share held in the Trust Account as of the date of the liquidation of the Trust Account due to reductions in the value of the trust assets, in each case net of the interest which may be withdrawn to pay taxes. This liability will not apply with respect to any claims by a third party who executed a waiver of any right, title, interest or claim of any kind in or to any monies held in the Trust Account or to any claims under the Company’s indemnity of the underwriters of the Initial Public Offering against certain liabilities, including liabilities under the Securities Act of 1933, as amended (the “Securities Act”). Moreover, in the event that an executed waiver is deemed to be unenforceable against a third party, the Sponsor will not be responsible to the extent of any liability for such third-party claims. The Company will seek to reduce the possibility that the Sponsor will have to indemnify the Trust Account due to claims of creditors by endeavoring to have all vendors, service providers (other than the Company’s independent auditors), prospective target businesses or other entities with which the Company does business, execute agreements with the Company waiving any right, title, interest or claim of any kind in or to monies held in the Trust Account.

Proposed Business Combination and Related Transactions

On October 12, 2020, the Company, FoA, New Pubco, Replay Merger Sub, Blocker Merger Sub, Blocker, Blocker GP, the Sellers and BTO Urban and Family Holdings, solely in their joint capacity as the Seller Representative, entered into the Transaction Agreement, pursuant to which the Company agreed to combine with FoA in the Proposed Business Combination that will result in New Pubco becoming a publicly-traded company on the NYSE and controlling FoA in an “UP-C” structure.

The Proposed Business Combination encompasses a series of transactions to effect an “UP-C” structure, pursuant to which, among other things: (i) the Company will change its jurisdiction of incorporation from the Cayman Islands to the State of Delaware by deregistering as an exempted company in the Cayman Islands and continuing


F-192


Table of Contents

REPLAY ACQUISITION CORP.

NOTES TO FINANCIAL STATEMENTS


and domesticating as a limited liability company formed under the laws of the State of Delaware (the “Domestication”), whereby (A) each of the Company’s ordinary shares outstanding immediately prior to the Domestication will be converted into a unit representing a limited liability company interest in the Company (each, a “Replay LLC Unit”) and (B) the Company will be governed by a limited liability company agreement; (ii) the Sellers and Blocker GP will sell to the Company limited liability company interests in FoA (“FoA Units”) in exchange for cash; (iii) Replay Merger Sub will merge with and into the Company (the “Replay Merger”), with the Company surviving the Replay Merger as a direct wholly owned subsidiary of New Pubco and each Replay LLC Unit outstanding immediately prior to the effectiveness of the Replay Merger being converted into the right to receive one share of New Pubco’s Class A common stock, par value $0.0001 per share (“Class A Common Stock”); (iv) Blocker will be converted from a Delaware limited partnership to a Delaware limited liability company; (v) Blocker Merger Sub will merge with and into Blocker (the “Blocker Merger”), with Blocker surviving the Blocker Merger as a direct wholly owned subsidiary of New Pubco and each limited liability company interest of Blocker (each, a “Blocker Share”) outstanding immediately prior to the effectiveness of the Blocker Merger being converted into the right to receive a combination of shares of Class A Common Stock and cash; (vi) Blocker GP will contribute its remaining FoA Units to New Pubco in exchange for shares of Class A Common Stock, after which New Pubco will contribute such FoA Units to Blocker; and (vii) New Pubco will issue to the Sellers shares of New Pubco’s Class B common stock, par value $0.0001 per share (“Class B Common Stock”), which will have no economic rights but will entitle each holder of at least one such share (regardless of the number of shares so held) to a number of votes that is equal to the aggregate number of FoA Units held by such holder on all matters on which stockholders of New Pubco are entitled to vote generally.

As a result of the Proposed Business Combination, among other things: (A) New Pubco will indirectly hold (through the Company and Blocker) FoA Units and will have the sole and exclusive right to appoint the board of managers of FoA; (B) the Sellers will hold (i) FoA Units that are exchangeable on a one-for-one basis for shares of Class A Common Stock and (ii) shares of Class B Common Stock; and (C) the holders of Blocker Shares outstanding immediately prior to the effectiveness of the Blocker Merger and Blocker GP will, directly or indirectly, hold shares of Class A Common Stock.

The consummation of the Proposed Business Combination is subject to a number of conditions set forth in the Transaction Agreement including, among others, receipt of the requisite approval of the Company’s shareholders, satisfaction of the minimum cash requirements provided in the Transaction Agreement, the termination or expiration of all required waiting periods under the Hart-Scott-Rodino Antitrust Improvements Act of 1976, as amended (the “HSR Act”), and the execution of the various related transaction agreements. On November 4, 2020, the request for early termination of the waiting period under the HSR Act with respect to the Proposed Business Combination was granted by the Federal Trade Commission.

Concurrently with the execution of the Transaction Agreement, (i) the Company entered into subscription agreements with various investors, including an affiliate of the Sponsor, pursuant to which such investors agreed to purchase ordinary shares (which ordinary shares will be converted into Replay LLC Units pursuant to the Domestication and then will be converted into the right to receive shares of Class A Common Stock pursuant to the Replay Merger) (each such subscription agreement, a “Replay PIPE Agreement”), and (ii) New Pubco entered into subscription agreements with certain funds affiliated with The Blackstone Group Inc. and Brian L. Libman and certain entities controlled by him (collectively, the “Principal Stockholders”, and together with the investors party to the Replay PIPE Agreements, the “PIPE Investors”) pursuant to which the Principal Stockholders agreed to purchase shares of Class A Common Stock (together with the ordinary shares being purchased pursuant to the Replay PIPE Agreements, the “PIPE Shares”). In the aggregate, the PIPE Investors have committed to purchase $250.0 million of PIPE Shares, at a purchase price of $10.00 per PIPE Share, including $10.0 million of PIPE Shares to be purchased by an affiliate of the Sponsor.


F-193


Table of Contents

REPLAY ACQUISITION CORP.

NOTES TO FINANCIAL STATEMENTS


Basis of Presentation

The accompanying financial statements are presented in U.S. dollars in conformity with accounting principles generally accepted in the United States of America (“GAAP”) and pursuant to the rules and regulations of the SEC.

Emerging Growth Company

The Company is an “emerging growth company,” as defined in Section 2(a) of the Securities Act, as modified by the Jumpstart Our Business Startups Act of 2012 (the “JOBS Act”), and it may take advantage of certain exemptions from various reporting requirements that are applicable to other public companies that are not emerging growth companies including, but not limited to, not being required to comply with the auditor attestation requirements of Section 404 of the Sarbanes-Oxley Act of 2002, reduced disclosure obligations regarding executive compensation in its periodic reports and proxy statements, and exemptions from the requirements of holding a nonbinding advisory vote on executive compensation and shareholder approval of any golden parachute payments not previously approved.

Further, Section 102(b)(1) of the JOBS Act exempts emerging growth companies from being required to comply with new or revised financial accounting standards until private companies (that is, those that have not had a Securities Act registration statement declared effective or do not have a class of securities registered under the Exchange Act) are required to comply with the new or revised financial accounting standards. The JOBS Act provides that an emerging growth company can elect to opt out of the extended transition period and comply with the requirements that apply to non-emerging growth companies but any such election to opt out is irrevocable. The Company has elected not to opt out of such extended transition period which means that when a standard is issued or revised, and it has different application dates for public or private companies, the Company, as an emerging growth company, can adopt the new or revised standard at the time private companies adopt the new or revised standard. This may make comparison of the Company’s financial statements with other public companies difficult or impossible because of the potential differences in accounting standards used.

Going Concern Consideration

As of December 31, 2020, the Company had approximately $850,000 outside of the Trust Account and a working deficit of approximately $836,000.

Through December 31, 2020, the Company’s liquidity needs have been satisfied through receipt of a $25,000 capital contribution from the Sponsor in exchange for the issuance of the Founder Shares (Note 4) to the Sponsor, $250,000 in note payable to the Sponsor and approximately $2,000 of general and administrative expenses paid by a related party on behalf of the Company. Subsequent to the consummation of the Initial Public Offering, the Company received the net proceeds from the consummation of the Private Placement not held in the Trust Account of $2.0 million. The Company fully repaid the note and the advances to the Sponsor and the related party in May 2019.

In addition, in order to finance transaction costs in connection with a Business Combination, the Sponsor or an affiliate of the Sponsor, or certain of the Company’s officers and directors may, but are not obligated to, loan the Company Working Capital Loans (Note 4). Except for the foregoing, the terms of such Working Capital Loans, if any, have not been determined and no written agreements exist with respect to such loans. The Working Capital Loans would either be repaid upon consummation of a Business Combination, without interest, or, at the lender’s discretion, up to $1.5 million of such Working Capital Loans may be convertible into warrants at a price of $1.00 per warrant. The warrants would be identical to the Private Placement Warrants. To date, the Company has no borrowings under the Working Capital Loans.


F-194


Table of Contents

REPLAY ACQUISITION CORP.

NOTES TO FINANCIAL STATEMENTS


Based on the foregoing, management believes that the Company will have sufficient working capital and borrowing capacity from the Sponsor or an affiliate of the Sponsor, or certain of the Company’s officers and directors to meet its needs until the consummation of the Proposed Business Combination. Over this time period, the Company will be using these funds for paying existing accounts payable, identifying and evaluating prospective initial business combination candidates, performing due diligence on prospective target businesses, paying for travel expenditures, selecting the target business to merge with or acquire, and structuring, negotiating and consummating the Initial Business Combination.

In connection with the Company’s assessment of going concern considerations in accordance with FASB Accounting Standards Update 2014-15, “Disclosure of Uncertainties about an Entity’s Ability to Continue as a Going Concern,” management has determined that in light of the upcoming Business Combination whereby the Company became a wholly owned subsidiary of New Pubco, Replay will continue to operate as a going concern. No adjustments have been made to the carrying amounts of assets or liabilities should the Company be required to liquidate after April 8, 2021. Refer to Note 9 - Subsequent Event for further detail on the upcoming Business Combination.

Restatement of Previously Issued Financial Statements

The Company has restated its financial statements as of December 31, 2020 and 2019, for the years ended December 31, 2020 and December 31, 2019, as well as the unaudited financial statements for the three month period ended March 31, 2020, the three and six month periods ended June 30, 2020 and 2019 and the three and nine month periods ended September 30, 2020 and 2019, to correct misstatements in those prior periods primarily related to misstatements identified in improperly applying accounting guidance for warrants, recognizing them as equity instead of a warrant liability, under the guidance of ASC 815-40, Contracts in Entity’s Own Equity, and not properly accounting for the entire amount of redeemable ordinary shares as temporary equity carried at redemption value in accordance with the guidance in ASC 480.

See Note 8 - Restatement of Previously Issued Financial Statements for additional information regarding the errors identified and the restatement adjustments made to the financial statements.

NOTE 2. SUMMARY OF SIGNIFICANT ACCOUNTING POLICIES

Concentrations of Credit Risk

Financial instruments that potentially subject the Company to credit risk consist principally of cash and investments held in Trust Account. Cash is maintained in accounts with financial institutions, which, at times may exceed the Federal depository insurance coverage of $250,000. The Company has not experienced losses on its cash accounts and management believes, based upon the quality of the financial institutions, that the credit risk with regard to these deposits is not significant. The Company’s investments held in Trust Account consists entirely of U.S. government securities with an original maturity of 180 days or less.

Cash and Cash Equivalents

The Company considers all short-term investments with an original maturity of three months or less when purchased to be cash equivalents.

Investments Held in Trust Account

The Company’s portfolio of investments held in Trust Account are comprised solely of U.S. government securities, within the meaning set forth in Section 2(a)(16) of the Investment Company Act, with a maturity of


F-195


Table of Contents

REPLAY ACQUISITION CORP.

NOTES TO FINANCIAL STATEMENTS


180 days or less, classified as trading securities. Trading securities are presented on the balance sheets at fair value at the end of each reporting period. Gains and losses resulting from the change in fair value of these securities is included in gain on marketable securities (net), dividends and interest, held in Trust Account in the accompanying statements of operations. The estimated fair values of investments held in the Trust Account are determined using available market information.

Warrant Liability

The Company accounts for warrants for the Company’s ordinary shares as liabilities at fair value on the Balance Sheets because the warrants do not meet the criteria for classification within equity. Offering costs were allocated to the Ordinary Shares and Public Warrants, and the amounts allocated to the Public Warrants were expensed immediately. The warrants are subject to remeasurement at each balance sheet date and any change in fair value is recognized in the Statements of Operations. The Company will continue to adjust the liability for changes in fair value until the earlier of the exercise or expiration of the Warrants. At that time, the portion of the warrant liability related to the Warrants will be reclassified to additional paid-in capital.

Fair Value Measurements

Fair value is defined as the price that would be received for sale of an asset or paid for transfer of a liability in an orderly transaction between market participants at the measurement date. GAAP establishes a three-tier fair value hierarchy, which prioritizes the inputs used in measuring fair value.

The hierarchy gives the highest priority to unadjusted quoted prices in active markets for identical assets or liabilities (Level 1 measurements) and the lowest priority to unobservable inputs (Level 3 measurements). These tiers include:


Level 1, defined as observable inputs such as quoted prices for identical instruments in active markets;


Level 2, defined as inputs other than quoted prices in active markets that are either directly or indirectly observable such as quoted prices for similar instruments in active markets or quoted prices for identical or similar instruments in markets that are not active; and


Level 3, defined as unobservable inputs in which little or no market data exists, therefore requiring an entity to develop its own assumptions, such as valuations derived from valuation techniques in which one or more significant inputs or significant value drivers are unobservable.

ASC 825, Financial Instruments, requires all entities to disclose the fair value of financial instruments, both assets and liabilities for which it is practicable to estimate fair value. As of December 31, 2020, and 2019, the recorded values of cash, prepaid expenses, accounts payable, and accrued expenses approximate the fair values due to the short-term nature of the instruments. The Company’s investments held in Trust Account are comprised of investments in U.S. government securities with an original maturity of 180 days or less. The fair value for trading securities is determined using quoted market prices in active markets.

Use of Estimates

The preparation of financial statements in conformity with U.S. GAAP requires the Company’s management to make estimates and assumptions that affect the reported amounts of assets and liabilities and disclosure of contingent assets and liabilities at the financial statements and the reported amounts of revenue and expenses during the reporting period.


F-196


Table of Contents

REPLAY ACQUISITION CORP.

NOTES TO FINANCIAL STATEMENTS


Making estimates requires management to exercise significant judgment. It is at least reasonably possible that the estimate of the effect of a condition, situation or set of circumstances that existed at the date of the financial statements, which management considered in formulating its estimate, could change in the near term due to one or more future confirming events. Accordingly, the actual results could differ significantly from those estimates.

Offering Costs

Offering costs consist of legal, accounting, underwriting fees and other costs incurred through the balance sheet date that are directly related to the Initial Public Offering and that were charged to shareholders equity upon the completion of the Initial Public Offering. Offering costs were allocated to the ordinary shares and the public warrants based on the relative fair value of the Warrants compared to the ordinary shares. The amounts allocated to the shares were recognized as a reduction to the carrying value of the shares, and the amounts allocated to the public warrants were immediately recognized as an expense.

Ordinary Shares Subject to Possible Redemption

Ordinary shares subject to mandatory redemption (if any) are classified as liability instruments and are measured at redemption value. Conditionally redeemable ordinary shares (including ordinary shares that feature redemption rights that are either within the control of the holder or subject to redemption upon the occurrence of uncertain events not solely within the Company’s control) are classified as temporary equity. At all other times, ordinary shares are classified as shareholders’ equity. The Company’s ordinary shares feature certain redemption rights that are considered to be outside of the Company’s control and subject to the occurrence of uncertain future events. Accordingly, at December 31, 2020, 28,750,000 ordinary shares subject to possible redemption are presented as temporary equity, outside of the shareholders’ equity section of the Company’s balance sheets. At December 31, 2019, 28,750,000 ordinary shares subject to possible redemption are presented as temporary equity, outside of the shareholders’ equity section of the Company’s balance sheet.

The ordinary shares subject to possible redemption are subject to the subsequent measurement guidance in ASC Topic 480. Under such guidance the Company must subsequently measure the shares to their redemption amount because, as a result of the allocation of net proceeds to the Public Warrants, the initial carrying amount of the Ordinary Shares is less than $10.00 per share. In accordance with the guidance, the Company has elected to measure the Ordinary shares subject to possible redemption to their redemption amount (i.e., $10.00 per share) immediately as if the end of the first reporting period after the IPO, June 30 2019, were the redemption date.

Net (Loss) Income Per Ordinary Share

The Company complies with accounting and disclosure requirements of FASB ASC Topic 260, Earnings Per Share. The Statements of Operations include a presentation of income (loss) per public share and income (loss) per founder share following the two-class method of income per share. In order to determine the Net income (loss) attributable to both the public and founder shares, the Company first considered the total income (loss) allocable to both sets of shares. This is calculated using the total net income (loss) less any dividends paid. For purposes of calculating net income (loss) per share, any Remeasurement of the ordinary shares subject to possible redemption and was considered to be dividends paid to the public shareholders. Subsequent to calculating the total income (loss) allocable to both sets of shares, the company split the amount to be allocated using a ratio of 80% for the public shares and 20% for the founder shares, reflective of the respective participation rights.

For the year ended December 31, 2020, basic and diluted net loss per share of Public Shares, were calculated by dividing 80% of the total loss allocable to all shares of approximately $18.9 million, by the weighted average


F-197


Table of Contents

REPLAY ACQUISITION CORP.

NOTES TO FINANCIAL STATEMENTS


number of 28,750,000 Public Shares outstanding for the period. For the year ended December 31, 2020, basic and diluted net loss per share of Founder Shares were calculated by dividing 20% of the total loss allocable to all shares of approximately $18.9 million, by the weighted average number of 7,187,500 Founder Shares outstanding for the period.

For the year ended December 31, 2019, basic and diluted net loss per share of Public Shares, were calculated by dividing 80% of the total loss allocable to all shares of approximately $27.2 million, plus the remeasurement of the ordinary shares subject to possible redemption of approximately $31.3 million, by the weighted average number of 28,750,000 Public Shares outstanding for the period. For the year ended December 31, 2019, basic and diluted net loss per share of Founder Shares were calculated by dividing 20% of the total loss allocable to all shares of approximately $27.2 million, by the weighted average number of 7,187,500 Founder Shares outstanding for the period.

At December 31, 2020 and December 31, 2019, we did not have any dilutive securities and other contracts that could, potentially, be exercised or converted into ordinary shares and then share in our earnings. As a result, diluted loss per share is the same as basic loss per share for the periods presented.

Income Taxes

FASB ASC 740 prescribes a recognition threshold and a measurement attribute for the financial statement recognition and measurement of tax positions taken or expected to be taken in a tax return. For those benefits to be recognized, a tax position must be more likely than not to be sustained upon examination by taxing authorities. There were no unrecognized tax benefits as of December 31, 2020, and 2019. The Company’s management determined that the Cayman Islands is the Company’s only major tax jurisdiction. The Company recognizes accrued interest and penalties related to unrecognized tax benefits as income tax expense. No amounts were accrued for the payment of interest and penalties at December 31, 2020, and 2019. The Company is currently not aware of any issues under review that could result in significant payments, accruals or material deviation from its position. The Company is subject to income tax examinations by major taxing authorities since inception.

There is currently no taxation imposed on income by the Government of the Cayman Islands. In accordance with Cayman income tax regulations, income taxes are not levied on the Company. Consequently, income taxes are not reflected in the Company’s financial statements.

Risks and Uncertainties

Management continues to evaluate the impact of the COVID-19 pandemic and has concluded that, while it is reasonably possible that the virus could have a negative effect on the Company’s financial position, results of its operations, close of the Initial Public Offering and/or search for a target company, the specific impact is not readily determinable as of the date of these financial statements. The financial statements do not include any adjustments that might result from the outcome of this uncertainty.

Recent Accounting Pronouncements

Management does not believe that any recently issued, but not yet effective, accounting pronouncements, if currently adopted, would have a material effect on the Company’s financial statements.

NOTE 3. INITIAL PUBLIC OFFERING

On April 8, 2019, the Company sold 28,750,000 Units, including the issuance of 3,750,000 Units as a result of the underwriters’ full exercise of their over-allotment option, at a purchase price of $10.00 per Unit in the Initial


F-198


Table of Contents

REPLAY ACQUISITION CORP.

NOTES TO FINANCIAL STATEMENTS


Public Offering. Of these, an aggregate of 2,500,000 Units in the Initial Public Offering (“Affiliate Units”) were purchased by certain affiliates of the Sponsor for gross proceeds of $25.0 million.

Each Unit consists of one ordinary share and one-half of one redeemable warrant (each, a “Public Warrant”). Each whole Public Warrant entitles the holder to purchase one ordinary share at a price of $11.50 per share, subject to adjustment (see Note 6).

NOTE 4. RELATED PARTY TRANSACTIONS

Founder Shares

In December 2018, the Sponsor purchased 7,187,500 ordinary shares, par value $0.0001 per share (the “Founder Shares”), for an aggregate price of $25,000. In March 2019, the Sponsor transferred to the Company’s independent directors an aggregate of 90,000 Founder Shares for an aggregate purchase price of $313. The Sponsor agreed to forfeit up to 937,500 Founder Shares to the extent that the over-allotment option was not exercised in full by the underwriters. The forfeiture was to be adjusted to the extent that the over-allotment option was not exercised in full by the underwriters so that the Founder Shares would represent 20.0% of the Company’s issued and outstanding shares after the Initial Public Offering. On April 5, 2019, the underwriters fully exercised their over-allotment option which closed simultaneously with the Initial Public Offering; thus, the 937,500 Founder Shares were no longer subject to forfeiture.

The initial shareholders agreed, subject to limited exceptions, not to transfer, assign or sell any of their Founder Shares until the earlier to occur of: (A) one year after the completion of the initial Business Combination or (B) subsequent to the initial Business Combination, (x) if the last reported sale price of the ordinary shares equals or exceeds $12.00 per share (as adjusted for share splits, share dividends, rights issuances, subdivisions, reorganizations, recapitalizations and the like) for any 20 trading days within any 30-trading day period commencing at least 150 days after the initial Business Combination, or (y) the date on which the Company completes a liquidation, merger, amalgamation, share exchange, reorganization or other similar transaction that results in all of the Company’s shareholders having the right to exchange their ordinary shares for cash, securities or other property.

Private Placement Warrants

Simultaneously with the closing of the Initial Public Offering on April 8, 2019, the Company sold 7,750,000 Private Placement Warrants to the Sponsor at a price of $1.00 per Private Placement Warrant, generating gross proceeds of $7.75 million. Each Private Placement Warrant is exercisable for one ordinary share at a price of $11.50 per share. The Private Placement Warrants have been accounted for as liabilities, with an initial fair value of $6.98 million. The difference between the proceeds received and the fair value was recognized as a capital contribution in additional paid-in capital on the Statements of Changes in Shareholders’ Equity. A portion of the net proceeds from the Private Placement Warrants was added to the proceeds from the Initial Public Offering held in the Trust Account. If the Company does not complete a Business Combination within the Combination Period, the Private Placement Warrants will expire worthless. The Private Placement Warrants will be non-redeemable and exercisable on a cashless basis so long as they are held by the Sponsor or its permitted transferees.

The Sponsor and the Company’s officers and directors agreed, subject to limited exceptions, not to transfer, assign or sell any of their Private Placement Warrants until 30 days after the completion of the initial Business Combination.

Contemporaneously with the execution of the Transaction Agreement, the initial shareholders entered into an amendment and restatement of the existing Sponsor Agreement (as amended and restated, the “Sponsor


F-199


Table of Contents

REPLAY ACQUISITION CORP.

NOTES TO FINANCIAL STATEMENTS


Agreement”) with New Pubco, the Company and FoA, pursuant to which, among other things, (i) immediately prior to the Domestication (as defined below), all of the Private Placement Warrants owned by the Sponsor will be exchanged for ordinary shares and (ii) excluding the Founder Shares held by the Company’s independent directors (unless transferred to any other initial shareholder or permitted transferee thereof), 40% of the Founder Shares held by the Sponsor will be vested and wholly owned by the Sponsor as of the closing of the Proposed Business Combination and 60% of the Founder Shares held by the Sponsor will be subject to vesting and forfeiture in accordance with certain terms and conditions.

Pursuant to the Sponsor Agreement, the initial shareholders have agreed to (i) vote or cause to be voted at the general meeting all of their Founder Shares and all other equity securities that they hold in the Company in favor of each proposal in connection with the Proposed Business Combination and the Transaction Agreement and any other matters reasonably necessary for consummation of the Proposed Business Combination, (ii) use reasonable best efforts to cause to be done all reasonably necessary, proper or advisable actions to consummate the Proposed Business Combination, (iii) waive all redemption rights and certain other rights in connection with the Proposed Business Combination and (iv) be bound by the same exclusivity obligations that bind the purchaser-side parties in the Transaction Agreement.

PIPE Agreements

Concurrently with the execution of the Transaction Agreement, the Company entered into the Replay PIPE Agreements (as defined below) with various investors, including an affiliate of the Sponsor, pursuant to which such investors agreed to purchase ordinary shares (which ordinary shares will be converted into Replay LLC Units pursuant to the Domestication and then will be converted into the right to receive shares of Class A Common Stock pursuant to the Replay Merger (as defined below)). In the aggregate, the PIPE Investors (as defined below) have committed to purchase $250.0 million of PIPE Shares (as defined below), at a purchase price of $10.00 per PIPE Share, including $10.0 million of PIPE Shares to be purchased by an affiliate of the Sponsor.

Related Party Loans

On December 1, 2018, the Sponsor agreed to loan the Company an aggregate of up to $250,000 to cover expenses related to the Initial Public Offering pursuant to a promissory note (the “Note”). This loan was non-interest bearing and payable on the earlier of June 30, 2019 or the completion of the Initial Public Offering. The Company borrowed $250,000 under the Note, and fully repaid on May 6, 2019.

In addition to the Note, the Company borrowed approximately $2,000 from a related party for general and administrative expenses. The Company repaid this amount on May 7, 2019.

In addition, in order to finance transaction costs in connection with a Business Combination, the Sponsor or an affiliate of the Sponsor, or certain of the Company’s officers and directors may, but are not obligated to, loan the Company funds as may be required (“Working Capital Loans”). If the Company completes a Business Combination, the Company would repay the Working Capital Loans out of the proceeds of the Trust Account released to the Company. Otherwise, the Working Capital Loans would be repaid only out of funds held outside the Trust Account. In the event that a Business Combination does not close, the Company may use a portion of proceeds held outside the Trust Account to repay the Working Capital Loans but no proceeds held in the Trust Account would be used to repay the Working Capital Loans. Except for the foregoing, the terms of such Working Capital Loans, if any, have not been determined and no written agreements exist with respect to such loans. The Working Capital Loans would either be repaid upon consummation of a Business Combination, without interest, or, at the lender’s discretion, up to $1.5 million of such Working Capital Loans may be convertible into warrants


F-200


Table of Contents

REPLAY ACQUISITION CORP.

NOTES TO FINANCIAL STATEMENTS


at a price of $1.00 per warrant. The warrants would be identical to the Private Placement Warrants. As of December 31, 2020, the Company had no borrowings under the Working Capital Loans.

Reimbursement

The Sponsor, officers and directors, or any of their respective affiliates, will be reimbursed for any out-of-pocket expenses incurred in connection with activities on the Company’s behalf such as identifying potential target businesses and performing due diligence on suitable Business Combinations. The Company’s Audit Committee will review on a quarterly basis all payments that were made to the Sponsor, officers, directors or the Company’s or any of their affiliates and will determine which expenses and the amount of expenses that will be reimbursed. There is no cap or ceiling on the reimbursement of out-of-pocket expenses incurred by such persons in connection with activities on the Company’s behalf.

NOTE 5. COMMITMENTS & CONTINGENCIES

Registration Rights

The holders of Founder Shares, Private Placement Warrants and warrants that may be issued upon conversion of Working Capital Loans, if any, and any ordinary shares underlying such securities, are entitled to registration rights pursuant to a Registration Rights Agreement entered into on April 3, 2019. These holders will be entitled to certain demand and “piggyback” registration rights. However, the Registration Rights Agreement provides that the Company will not permit any registration statement filed under the Securities Act to become effective until the termination of the applicable lock-up period for the securities to be registered. The Company will bear the expenses incurred in connection with the filing of any such registration statements.

Underwriting Agreement

The Company granted the underwriters a 45-day option from the date of the final prospectus relating to the Initial Public Offering to purchase up to 3,750,000 additional Units to cover over-allotments, if any, at the Initial Public Offering price less the underwriting discounts and commissions. On April 5, 2019, the underwriters fully exercised their over-allotment option which closed simultaneously with the Initial Public Offering.

Except on the Affiliate Units, the underwriters were entitled to an underwriting discount of $0.20 per Unit, or $5.25 million in the aggregate, paid upon the closing of the Initial Public Offering. In addition, $0.35 per Unit, or approximately $9.19 million in the aggregate will be payable to the underwriters for deferred underwriting commissions. The deferred fee will become payable to the underwriters from the amounts held in the Trust Account solely in the event that the Company completes a Business Combination, subject to the terms of the underwriting agreement.

NOTE 6. SHAREHOLDERS’ EQUITY

Ordinary Shares—The Company is currently authorized to issue 200,000,000 ordinary shares with a par value of $0.0001 per share. Holders of ordinary shares are entitled to one vote for each share. As disclosed in Note 4, 7,187,500 ordinary shares were issued to the Sponsor (Founders Shares), and an aggregate of up to 937,500 shares were subject to forfeiture to the Company by the Sponsor for no consideration to the extent that the underwriters’ over-allotment option was not exercised in full or in part, so that the initial shareholders would collectively own 20% of the Company’s issued and outstanding ordinary shares after the Initial Public Offering. On April 5, 2019, the underwriters fully exercised their over-allotment option which closed simultaneously with the Initial Public Offering; thus, the 937,500 Founder Shares were no longer subject to forfeiture. These


F-201


Table of Contents

REPLAY ACQUISITION CORP.

NOTES TO FINANCIAL STATEMENTS


7,187,500 Founder Shares are subject to certain restrictions (see Note 4). In April 2019, the Company sold 28,750,000 Units in the Initial Public Offering. As a result, as of December 31, 2020 and 2019, there were 35,937,500 ordinary shares issued and outstanding, including 28,750,000 ordinary shares subject to possible redemption, respectively.

Preference Shares—The Company is authorized to issue 2,000,000 Preference shares with such designations, voting and other rights and Preference as may be determined from time to time by the Company’s board of directors. As of December 31, 2020, and 2019, there were no Preference shares issued or outstanding.

Warrants— Public Warrants may only be exercised for a whole number of shares. No fractional Public Warrants will be issued upon separation of the Units and only whole Public Warrants will trade. The Public Warrants will become exercisable on the later of (a) 30 days after the completion of a Business Combination; provided that the Company has an effective registration statement under the Securities Act covering the ordinary shares issuable upon exercise of the Public Warrants and a current prospectus relating to them is available (or the Company permits holders to exercise their Public Warrants on a cashless basis and such cashless exercise is exempt from registration under the Securities Act). The Company has agreed that as soon as practicable, but in no event later than 15 business days, after the closing of a Business Combination, the Company will use its best efforts to file with the SEC a registration statement for the registration, under the Securities Act, of the ordinary shares issuable upon exercise of the Public Warrants. If the shares issuable upon exercise of the warrants are not registered under the Securities Act, the Company will be required to permit holders to exercise their warrants on a cashless basis. However, no warrant will be exercisable for cash or on a cashless basis, and the Company will not be obligated to issue any shares to holders seeking to exercise their warrants, unless the issuance of the shares upon such exercise is registered or qualified under the securities laws of the state of the exercising holder, or an exemption from registration is available. Notwithstanding the above, if the Company’s ordinary shares are at the time of any exercise of a warrant not listed on a national securities exchange such that it satisfies the definition of a “covered security” under Section 18(b)(1) of the Securities Act, the Company may, at its option, require holders of Public Warrants who exercise their warrants to do so on a “cashless basis” in accordance with Section 3(a)(9) of the Securities Act and, in the event the Company so elects, the Company will not be required to file or maintain in effect a registration statement, but the Company will use its best efforts to register or qualify the shares under applicable blue sky laws to the extent an exemption is not available.

The Public Warrants will expire five years after the completion of a Business Combination or earlier upon redemption or liquidation.

The Private Placement Warrants are identical to the Public Warrants underlying the Units sold in the Initial Public Offering, except that the Private Placement Warrants and the ordinary shares issuable upon exercise of the Private Placement Warrants will not be transferable, assignable or salable until 30 days after the completion of a Business Combination, subject to certain limited exceptions. Additionally, the Private Placement Warrants will be non-redeemable so long as they are held by the initial purchasers or such purchasers’ permitted transferees. If the Private Placement Warrants are held by someone other than the initial purchasers or their permitted transferees, the Private Placement Warrants will be redeemable by the Company and exercisable by such holders on the same basis as the Public Warrants.

The Company may call the Public Warrants for redemption (except with respect to the Private Placement Warrants):


in whole and not in part;


at a price of $0.01 per warrant;


upon a minimum of 30 days’ prior written notice of redemption; and


F-202


Table of Contents

REPLAY ACQUISITION CORP.

NOTES TO FINANCIAL STATEMENTS


if, and only if, the last reported closing price of the ordinary shares equals or exceeds $18.00 per share for any 20 trading days within a 30-trading day period ending on the third trading day prior to the date on which the Company sends the notice of redemption to the warrant holders.

If the Company calls the Public Warrants for redemption, management will have the option to require all holders that wish to exercise the Public Warrants to do so on a “cashless basis,” as described in the warrant agreement.

The exercise price and number of ordinary shares issuable upon exercise of the warrants may be adjusted in certain circumstances including in the event of a share dividend, recapitalization, reorganization, merger or consolidation. In addition, if (x) the Company issues additional ordinary shares or equity-linked securities for capital raising purposes in connection with the closing of its initial Business Combination at an issue price or effective issue price of less than $9.20 per ordinary share (with such issue price or effective issue price to be determined in good faith by the Company’s board of directors and, in the case of any such issuance to the Sponsor or its affiliates, without taking into account any Founder Shares held by the Sponsor or such affiliates, as applicable, prior to such issuance) (the “Newly Issued Price”), (y) the aggregate gross proceeds from such issuances represent more than 60% of the total equity proceeds, and interest thereon, available for the funding of the Company’s initial Business Combination on the date of the consummation of such initial Business Combination (net of redemptions), and (z) the volume weighted average trading price of the Company’s ordinary shares during the 20 trading day period starting on the trading day prior to the day on which the Company consummates its initial Business Combination (such price, the “Market Value”) is below $9.20 per share, the exercise price of the warrants will be adjusted (to the nearest cent) to be equal to 115% of the higher of the Market Value and the Newly Issued Price and the $18.00 per share redemption trigger price described above will be adjusted (to the nearest cent) to be equal to 180% of the higher of the Market Value and the Newly Issued Price. Additionally, in no event will the Company be required to net cash settle the warrant shares. If the Company is unable to complete a Business Combination within the Combination Period and the Company liquidates the funds held in the Trust Account, holders of warrants will not receive any of such funds with respect to their warrants, nor will they receive any distribution from the Company’s assets held outside of the Trust Account with the respect to such warrants. Accordingly, the warrants may expire worthless.

The Company accounts for the Public Warrants and Private Placement Warrants as liabilities in accordance with the guidance contained in ASC 815-40, Derivatives and Hedging — Contracts in Entity’s Own Equity. Because the Company does not control the occurrence of events, such as a tender offer or exchange, that may trigger cash settlement of the warrants where not all of the shareholders also receive cash, the warrants do not meet the criteria for equity treatment thereunder, as such, the warrants must be recorded as derivative liability.

Additionally, certain adjustments to the settlement amount of the Private Placement Warrants are based on a variable that is not an input to the fair value of a “fixed-for-fixed” option as defined under ASC 815-40, and thus the Private Placement Warrants are not considered indexed to the Company’s own stock and not eligible for an exception from derivative accounting.

The accounting treatment of derivative financial instruments requires that the Company record a derivative liability upon the issuance of the warrants at the closing of this offering. Accordingly, the Company expects to classify each warrant as a liability at its fair value. The Public Warrants were allocated a portion of the proceeds from the issuance of the Units equal to its fair value determined by the Monte Carlo simulation. The warrant liability is subject to remeasurement at each balance sheet date. With each such re-measurement, the warrant liability will be adjusted to fair value, with the change in fair value recognized in the Company’s Statements of Operations. The Company will reassess the classification of the warrants at each balance sheet date. If the classification changes as a result of events during the period, the warrants will be reclassified as of the date of the event that causes the reclassification.


F-203


Table of Contents

REPLAY ACQUISITION CORP.

NOTES TO FINANCIAL STATEMENTS


NOTE 7. FAIR VALUE MEASUREMENTS

The following tables presents information about the Company’s assets and liabilities that are measured at fair value on a recurring basis as of December 31, 2020 and December 31, 2019 and indicate the fair value hierarchy of the valuation techniques that the Company utilized to determine such fair value. In general, fair values determined by Level 1 inputs utilize quoted prices (unadjusted) in active markets for identical assets or liabilities. Fair values determined by Level 2 inputs utilize data points that are observable, such as quoted prices, interest rates and yield curves. Fair values determined by Level 3 inputs are unobservable data points for the asset or liability, and includes situations where there is little, if any, market activity for the asset or liability.

The Company has determined that the Warrants are subject to treatment as a liability. As the transfer of the Private Placement Warrants to anyone other than the purchasers or their permitted transferees would result in the Private Placement Warrants having substantially the same terms as the Public Warrants issued in the Offering, the Company has determined that the fair value of each Warrant issued as part of the Private Placement Warrants is the same as that of a Warrant issued in the Offering, with an insignificant adjustment for short-term marketability restrictions. Accordingly, the Warrants are classified as Level 2 financial instruments.

December 31, 2020


Description

   Quoted Prices
in Active
Markets

(Level 1)
     Significant
Other
Observable
Inputs

(Level 2)
     Significant
Other
Unobservable
Inputs

(Level 3)
 

Assets:


Investments held in Trust Account

   $ 293,315,407    $ —        $ —    

Liabilities:


Warrants

   $ —        $ 35,351,250    $ —  

December 31, 2019


Description

   Quoted Prices
in Active
Markets

(Level 1)
     Significant
Other
Observable
Inputs

(Level 2)
     Significant
Other
Unobservable
Inputs

(Level 3)
 

Assets:


Investments held in Trust Account

   $ 292,054,158    $ —        $ —    

Liabilities:


Warrants

   $ —        $ 18,817,500    $ —    

Transfers to/from Levels 1, 2, and 3 are recognized at the end of the reporting period. There were no transfers between levels for the years ended December 31, 2020 and 2019.

NOTE 8. RESTATEMENT OF PREVIOUSLY ISSUED FINANCIAL STATEMENTS

On April 12, 2021, the Staff of the Securities and Exchange Commission issued a statement regarding the accounting and reporting considerations for warrants issued by special purpose acquisition companies entitled “Staff Statement on Accounting and Reporting Considerations for Warrants Issued by Special Purpose Acquisition Companies (“SPACs”)” (the “SEC Statement”). The errors that caused the Company to conclude that its financial statements should be restated are the result of a misapplication of the guidance on accounting for its issued warrants, which came to light when the SEC issued the SEC Statement. The SEC Statement addresses


F-204


Table of Contents

REPLAY ACQUISITION CORP.

NOTES TO FINANCIAL STATEMENTS


certain accounting and reporting considerations related to warrants of a kind similar to those issued by the Company at the time of its initial public offering on April 8, 2019. Based on ASC 815-40, Contracts on an Entity’s Own Equity, warrant instruments that do not meet the criteria to be considered indexed to an entity’s own stock shall be initially classified as liabilities at their estimated fair values. In periods subsequent to issuance, changes in the estimated fair value of the derivative instruments should be reported in the Statement of Operations. Refer to Note 6 - Shareholders’ Equity for further detail on the Warrants.

The Company’s management and the audit committee of the Company’s Board of Directors concluded that it is appropriate to restate (i) the Company’s previously issued audited financial statements as of December 31, 2020 and December 31, 2019, as previously reported in its Form 10-K and (ii) quarterly unaudited financial statements for the quarterly periods ended June 30, 2019, September 30, 2019, March 31, 2020, June 30, 2020 and September 30, 2020. The restated classification and reported values of the Warrants as accounted for under ASC 815-40 are included in the financial statements herein.

In addition, management has identified errors made in the historical financial statements related to its shareholders’ equity where, on the date of issuance of the units, Replay improperly allocated the net proceeds among the ordinary shares subject to possible redemption and public warrants. Additionally, due to the redemption features tied to the ordinary shares subject to possible redemption, such shares will be redeemed or become redeemable. As a result, Replay should have remeasured the ordinary shares subject to possible redemption to their redemption amount (i.e., $10.00 per share) immediately as of the end of the first reporting period after the IPO (June 30, 2019) were the redemption date. Management also noted a reclassifications error related to temporary equity and permanent equity.

The following presents the restated financial statements as of December 31, 2020 and 2019, as well as the statements for the three month period ended March 30, 2020, the three and six month periods ended June 30, 2020 and 2019 and the three and nine month periods ended September 30, 2020 and 2019.


F-205


Table of Contents

REPLAY ACQUISITION CORP.

NOTES TO FINANCIAL STATEMENTS


The following presents a reconciliation of the Balance Sheets, Statements of Operations, and Statements of Cash Flows from the prior periods as previously reported to the restated amounts as of December 31, 2020 and 2019. The Statements of Shareholders’ Equity for the years ended December 31, 2020 and 2019 have been restated, for the restatement impact to net (loss) income and common stock subject to possible redemption. See the Statement of Operations reconciliation tables below for additional information on the restatement adjustments and impact to net (loss) income.


     December 31, 2020  
     As Reported      Restatement
Adjustments
    As Restated  

Assets:


Current assets:


Cash

   $ 849,909    $ —       $ 849,909

Prepaid expenses

     10,833      —         10,833


Total current assets

     860,742      —         860,742

Investments held in Trust Account

     293,315,407      —         293,315,407


Total assets

     294,176,149      —         294,176,149


Liabilities and Shareholders’ Equity:


Current liabilities:


Accounts payable

     916,939      —         916,939

Accrued expenses

     779,411      —         779,411


Total current liabilities

     1,696,350      —         1,696,350

Warrant liability

     —          35,351,250 (a)      35,351,250

Deferred underwriting commissions

     9,187,500      —         9,187,500


Total liabilities

     10,883,850      35,351,250       46,235,100


Commitments and contingencies


Ordinary shares, $0.0001 par value; 28,750,000 shares subject to possible redemption at $10.00 per share at December 31, 2020

     278,292,290      9,207,710 (a)      287,500,000  

Shareholders’ Equity:


Preference shares, $0.0001 par value; 2,000,000 shares authorized; none issued and outstanding

     —          —         —    

Ordinary shares, $0.0001 par value; 200,000,000 shares authorized; 7,187,500 shares issued and outstanding (excluding 28,750,000 shares subject to possible redemption) at December 31, 2020

     811      (92 )(a)      719

Additional paid-in capital

     1,906,570      (1,906,570 )(a)      —  

Retained earnings / (Accumulated deficit)

     3,092,628      (42,652,298 )(a)      (39,559,670


Total shareholders’ equity

     5,000,009      (44,558,960     (39,558,951


Total Liabilities and Shareholders’ Equity

   $ 294,176,149    $ —       $ 294,176,149


F-206


Table of Contents

REPLAY ACQUISITION CORP.

NOTES TO FINANCIAL STATEMENTS


     December 31, 2019  
     As Reported      Restatement
Adjustments
    As Restated  

Assets:


Current assets:


Cash

   $ 1,589,795    $ —       $ 1,589,795

Prepaid expenses

     62,738      —         62,738


Total current assets

     1,652,533      —         1,652,533

Investments held in Trust Account

     292,054,158      —         292,054,158


Total assets

     293,706,691      —         293,706,691


Liabilities and Shareholders’ Equity:


Current liabilities:


Accounts payable

     86,595      —         86,595

Accrued expenses

     8,860      —         8,860


Total current liabilities

     95,455      —         95,455

Warrant liability

     —          18,817,500 (a)      18,817,500

Deferred underwriting commissions

     9,187,500      —         9,187,500


Total liabilities

     9,282,955      18,817,500       28,100,455


Commitments and contingencies


Ordinary shares, $0.0001 par value; 28,750,000 shares subject to possible redemption at $10.00 per share at December 31, 2019

     279,423,730      8,076,270 (a)      287,500,000  

Shareholders’ Equity:


Preference shares, $0.0001 par value; 2,000,000 shares authorized; none issued and outstanding

     —          —         —    

Ordinary shares, $0.0001 par value; 200,000,000 shares authorized; 7,187,500 shares issued and outstanding (excluding 28,750,000 and shares subject to possible redemption) at December 31, 2019

     800      (81 )(a)      719

Additional paid-in capital

     775,141      (775,141 )(a)      —    

Retained earnings / (Accumulated deficit)

     4,224,065      (26,118,548 )(a)      (21,894,483


Total shareholders’ equity

     5,000,006      (26,893,770     (21,893,764


Total Liabilities and Shareholders’ Equity

   $ 293,706,691    $ —       $ 293,706,691


F-207


Table of Contents

REPLAY ACQUISITION CORP.

NOTES TO FINANCIAL STATEMENTS


     For the year ended December 31, 2020  
     As Reported      Restatement
Adjustments
    As Restated  

General and administrative expenses

   $ 2,392,686    $ —       $ 2,392,686


Loss from operations

     (2,392,686      —         (2,392,686

Loss on revaluation of warrant liability

     —          (16,533,750 )(a)      (16,533,750

Gain on marketable securities, dividends and interest held in Trust Account

     1,261,249      —         1,261,249


Net loss

   $ (1,131,437    $ (16,533,750   $ (17,665,187


Basic and diluted weighted average shares outstanding of Public Shares

     28,750,000      —         28,750,000


Basic and diluted net income (loss) per share, Public Shares

   $ 0.04    $ (0.52 )(a)    $ (0.48


Basic and diluted weighted average shares outstanding of Founder Shares

     7,187,500      —         7,187,500


Basic and diluted net loss per share, Founder Shares

   $ (0.33    $ (0.20 )(a)    $ (0.53


     For the year ended December 31, 2019  
     As Reported      Restatement
Adjustments
    As Restated  

General and administrative expenses

   $ 327,399    $ —       $ 327,399


Loss from operations

     (327,399      —         (327,399

Issuance costs allocated to Public Warrants

     —          (648,239 )(a)      (648,239

Gain on revaluation of warrant liability

     —          520,000 (a)      520,000  

Gain on marketable securities, dividends and interest held in Trust Account

     4,554,158      —         4,554,158


Net income

   $ 4,226,759    $ (128,239   $ 4,098,520


Basic and diluted weighted average shares outstanding of Public Shares

     28,750,000      —         28,750,000


Basic and diluted net income per share, Public Shares

   $ 0.16    $ 0.17 (a)    $ 0.33


Basic and diluted weighted average shares outstanding of Founder Shares

     7,187,500      —         7,187,500


Basic and diluted net loss per share, Founder Shares

   $ (0.05    $ (0.71 )(a)    $ (0.76 )


F-208


Table of Contents

REPLAY ACQUISITION CORP.

NOTES TO FINANCIAL STATEMENTS


     For the year ended December 31, 2020  
     As Reported     Restatement
Adjustments
    As Restated  

Cash Flows from Operating Activities:


Net loss

   $ (1,131,437   $ (16,533,750 )(a)    $ (17,665,187

Adjustments to reconcile net loss to net cash used in operating activities:


Gain on marketable securities, dividends and interest held in Trust Account

     (1,261,249     —         (1,261,249

Loss on revaluation of warrant liability

     —         16,533,750 (a)      16,533,750

Changes in operating assets and liabilities:


Prepaid expenses

     51,905     —         51,905

Accounts payable

     830,344     —         830,344

Accrued expenses

     770,551     —         770,551


Net cash used in operating activities

     (739,886     —         (739,886


Net change in cash

     (739,886     —         (739,886

Cash - beginning of year

     1,589,795     —         1,589,795


Cash - end of year

   $ 849,909   $ —       $ 849,909


Supplemental disclosure of noncash activities:


Change in value of ordinary share subject to possible redemption

   $ (1,131,440   $ 1,131,440 (a)    $ —    


    For the year ended December 31, 2019  
    As Reported     Restatement
Adjustments
    As Restated  

Cash Flows from Operating Activities:


Net income

  $ 4,226,759     $ (128,239 )(a)    $ 4,098,520  

Adjustments to reconcile net income to net cash used in operating activities:


Gain on marketable securities, dividends and interest held in Trust Account

    (4,554,158     —         (4,554,158

Gain on revaluation of warrant liability

    —         (520,000 )(a)      (520,000

Changes in operating assets and liabilities:


Prepaid expenses

    (62,738     —         (62,738

Accounts payable

    83,995     —         83,995

Accrued expenses

    6,166     —         6,166


Net cash used in operating activities

    (299,976     (648,239     (948,215


Cash Flows from Investing Activities:


Cash deposited in Trust Account

    (287,500,000     —         (287,500,000


Net cash used in investing activities

    (287,500,000     —         (287,500,000


F-209


Table of Contents

REPLAY ACQUISITION CORP.

NOTES TO FINANCIAL STATEMENTS


    For the year ended December 31, 2019  
    As Reported     Restatement
Adjustments
    As Restated  

Cash Flows from Financing Activities:


Proceeds from note payable to related party

    250,000     —         250,000

Repayment of note payable and advances from related party

    (250,000     —         (250,000

Proceeds received from initial public offering

    287,500,000     —         287,500,000

Proceeds from private placement

    7,750,000     —         7,750,000

Offering costs paid

    (5,885,229     648,239 (a)      (5,236,990


Net cash provided by financing activities

    289,364,771     648,239       290,013,010  


Net change in cash

    1,564,795     —         1,564,795  

Cash - beginning of year

    25,000     —         25,000


Cash - end of year

  $ 1,589,795   $
—  
 
  $ 1,589,795  


Supplemental disclosure of noncash activities:


Offering costs included in accounts payable

  $ 2,600   $ —       $ 2,600

Value of ordinary share subject to possible redemption

  $ 279,423,730     $ (252,634,140 )(a)    $ 26,789,590  

Deferred underwriting commissions

  $     $ 9,187,500 (a)    $ 9,187,500  

The following presents a reconciliation of the unaudited Balance Sheets from the balances previously reported to the restated balances as of March 31, 2020, June 30,2020, September 30, 2020, June 30, 2019 and September 30, 2019.


    March 31, 2020  
    As Reported     Restatement
Adjustments
    As Restated  

Assets:


Current assets:


Cash

  $ 1,492,046   $ —       $ 1,492,046

Prepaid expenses

    109,585     —         109,585


Total current assets

    1,601,631     —         1,601,631

Investments held in Trust Account

    293,182,905     —         293,182,905


Total assets

    294,784,536     —         294,784,536


Liabilities and Shareholders’ Equity:


Current liabilities:


Accounts payable

    161,682     —         161,682

Accrued expenses

    50,000     —         50,000


Total current liabilities

    211,682     —         211,682

Warrant liability

    —         13,053,750 (a)      13,053,750

Deferred underwriting commissions

    9,187,500     —         9,187,500


Total liabilities

    9,399,182     13,053,750       22,452,932


F-210


Table of Contents

REPLAY ACQUISITION CORP.

NOTES TO FINANCIAL STATEMENTS


     March 31, 2020  
     As Reported      Restatement
Adjustments
    As Restated  

Commitments and contingencies


Ordinary shares, $0.0001 par value; 28,750,000 shares subject to possible redemption at $10.00 per share at March 31, 2020

     280,385,350      7,114,650 (a)      287,500,000  

Shareholders’ Equity:


Preference shares, $0.0001 par value; 2,000,000 shares authorized; none issued and outstanding

     —          —         —    

Ordinary shares, $0.0001 par value; 200,000,000 shares authorized; 7,187,500 shares issued and outstanding (excluding 28,750,000 shares subject to possible redemption) at March 31, 2020

     790      (71 )(a)      719

Retained earnings / (Accumulated deficit)

     4,999,214      (20,168,329 )(a)      (15,169,115


Total shareholders’ equity

     5,000,004      (20,168,400     (15,168,396


Total Liabilities and Shareholders’ Equity

   $ 294,784,536    $ —       $ 294,784,536


     June 30, 2020  
     As Reported      Restatement
Adjustments
    As Restated  

Assets:


Current assets:


Cash

   $ 1,261,642    $ —       $ 1,261,642

Prepaid expenses

     83,333      —         83,333


Total current assets

     1,344,975      —         1,344,975

Investments held in Trust Account

     293,168,737      —         293,168,737


Total assets

     294,513,712      —         294,513,712


Liabilities and Shareholders’ Equity:


Current liabilities:


Accounts payable

     26,078      —         26,078

Accrued expenses

     25,000      —         25,000


Total current liabilities

     51,078      —         51,078

Warrant liability

     —          19,990,000 (a)      19,990,000

Deferred underwriting commissions

     9,187,500      —         9,187,500


Total liabilities

     9,238,578      19,990,000       29,228,578


F-211


Table of Contents

REPLAY ACQUISITION CORP.

NOTES TO FINANCIAL STATEMENTS


     June 30, 2020  
     As Reported      Restatement
Adjustments
    As Restated  

Commitments and contingencies


Ordinary shares, $0.0001 par value; 28,750,000 shares subject to possible redemption at $10.00 per share at June 30, 2020

     280,275,130      7,224,870 (a)      287,500,000  

Shareholders’ Equity:


Preference shares, $0.0001 par value; 2,000,000 shares authorized; none issued and outstanding

     —          —         —    

Ordinary shares, $0.0001 par value; 200,000,000 shares authorized; 7,187,500 shares issued and outstanding (excluding 28,750,000 shares subject to possible redemption) at June 30, 2020

     791      (72 )(a)      719

Retained earnings / (Accumulated deficit)

     4,999,213      (27,214,798 )(a)      (22,215,585


Total shareholders’ equity

     5,000,004      (27,214,870     (22,214,866


Total Liabilities and Shareholders’ Equity

   $ 294,513,712    $ —       $ 294,513,712


     September 30, 2020  
     As Reported      Restatement
Adjustments
    As Restated  

Assets:


Current assets:


Cash

   $ 974,317    $ —       $ 974,317

Prepaid expenses

     47,084      —         47,084


Total current assets

     1,021,401      —         1,021,401

Investments held in Trust Account

     293,255,540      —         293,255,540


Total assets

     294,276,941      —         294,276,941


Liabilities and Shareholders’ Equity:


Current liabilities:


Accounts payable

     371,225      —         371,225

Accrued expenses

     414,571      —         414,571


Total current liabilities

     785,796      —         785,796

Warrant liability

     —          21,096,250 (a)      21,096,250

Deferred underwriting commissions

     9,187,500      —         9,187,500


Total liabilities

     9,973,296      21,096,250       31,069,546


Commitments and contingencies


Ordinary shares, $0.0001 par value; 28,750,000 shares subject to possible redemption at $10.00 per share at September 30, 2020

     279,303,640      8,196,360 (a)      287,500,000  


F-212


Table of Contents

REPLAY ACQUISITION CORP.

NOTES TO FINANCIAL STATEMENTS


     September 30, 2020  
     As Reported      Restatement
Adjustments
    As Restated  

Shareholders’ Equity:


Preference shares, $0.0001 par value; 2,000,000 shares authorized; none issued and outstanding

     —          —         —    

Ordinary shares, $0.0001 par value; 200,000,000 shares authorized; 7,187,500 shares issued and outstanding (excluding 28,750,000 shares subject to possible redemption) at September 30, 2020

     801      (82 )(a)      719

Additional paid-in capital

     895,230      (895,230 )(a)      —    

Retained earnings / (Accumulated deficit)

     4,103,974      (28,397,298 )(a)      (24,293,324


Total shareholders’ equity

     5,000,005      (29,292,610     (24,292,605


Total Liabilities and Shareholders’ Equity

   $ 294,276,941    $ —       $ 294,276,941


     June 30, 2019  
     As Reported      Restatement
Adjustments
    As Restated  

Assets:


Current assets:


Cash

   $ 1,784,487    $ —       $ 1,784,487

Prepaid expenses

     138,629      —         138,629


Total current assets

     1,923,116      —         1,923,116

Investments held in Trust Account

     289,260,594      —         289,260,594


Total assets

     291,183,710      —         291,183,710


Liabilities and Shareholders’ Equity:


Current liabilities:


Accounts payable

     2,600      —         2,600

Accrued expenses

     170,269      —         170,269


Total current liabilities

     172,869      —         172,869

Warrant liability

     —          15,720,000 (a)      15,720,000

Deferred underwriting commissions

     9,187,500      —         9,187,500


Total liabilities

     9,360,369      15,720,000       25,080,369


Commitments and contingencies


Ordinary shares, $0.0001 par value; 28,750,000 shares subject to possible redemption at $10.00 per share at June 30, 2019

     276,823,340      10,676,660 (a)      287,500,000  


F-213


Table of Contents

REPLAY ACQUISITION CORP.

NOTES TO FINANCIAL STATEMENTS


     June 30, 2019  
     As Reported      Restatement
Adjustments
    As Restated  

Shareholders’ Equity:


Preference shares, $0.0001 par value; 2,000,000 shares authorized; none issued and outstanding

     —          —         —    

Ordinary shares, $0.0001 par value; 200,000,000 shares authorized; 7,187,500 shares issued and outstanding (excluding 28,750,000 shares subject to possible redemption) at June 30, 2019

     826      (107 )(a)      719

Additional paid-in capital

     3,375,505      (3,375,505 )(a)      —    

Retained earnings / (Accumulated deficit)

     1,623,670      (23,021,048 )(a)      (21,397,378


Total shareholders’ equity

     5,000,001      (26,396,660     (21,396,659


Total Liabilities and Shareholders’ Equity

   $ 291,183,710    $ —       $ 291,183,710


     September 30, 2019  
     As Reported      Restatement
Adjustments
    As Restated  

Assets:


Current assets:


Cash

   $ 1,618,729    $ —       $ 1,618,729

Prepaid expenses

     101,988      —         101,988


Total current assets

     1,720,717      —         1,720,717

Investments held in Trust Account

     290,822,448      —         290,822,448


Total assets

     292,543,165      —         292,543,165


Liabilities and Shareholders’ Equity:


Current liabilities:


Accounts payable

     82,220      —         82,220

Accrued expenses

     —          —         —    


Total current liabilities

     82,220      —         82,220

Warrant liability

     —          16,671,250 (a)      16,671,250

Deferred underwriting commissions

     9,187,500      —         9,187,500


Total liabilities

     9,269,720      16,671,250       25,940,970


Commitments and contingencies


Ordinary shares, $0.0001 par value; 28,750,000 shares subject to possible redemption at $10.00 per share at September 30, 2019

     278,273,440      9,226,560 (a)      287,500,000  


F-214


Table of Contents

REPLAY ACQUISITION CORP.

NOTES TO FINANCIAL STATEMENTS


     September 30, 2019  
     As Reported      Restatement
Adjustments
    As Restated  

Shareholders’ Equity:


Preference shares, $0.0001 par value; 2,000,000 shares authorized; none issued and outstanding

     —          —         —    

Ordinary shares, $0.0001 par value; 200,000,000 shares authorized; 7,187,500 shares issued and outstanding (excluding 28,750,000 shares subject to possible redemption) at September 30, 2019

     811      (92 )(a)      719

Additional paid-in capital

     1,925,420      (1,925,420 )(a)      —    

Retained earnings / (Accumulated deficit)

     3,073,774      (23,972,298 )(a)      (20,898,524


Total shareholders’ equity

     5,000,005      (25,897,810     (20,897,805


Total Liabilities and Shareholders’ Equity

   $ 292,543,165    $ —       $ 292,543,165


The following presents a reconciliation of the unaudited Statements of Operations from the amounts previously reported to the restated amounts for the three month period ended March 31, 2020, the three and six month periods ended June 30, 2020, the three and nine month periods ended September 30, 2020, the three and six month periods ended June 30, 2019 and the three and nine month periods ended September 30, 2019.


     For the three months ended March 31, 2020  
     As Reported      Restatement
Adjustments
    As Restated  

General and administrative expenses

   $ 167,129    $ —       $ 167,129


Loss from operations

     (167,129      —         (167,129

Issuance costs allocated to Public Warrants

     —          —         —    

Gain on revaluation of warrant liability

     —          5,763,750 (a)      5,763,750

Gain on marketable securities, dividends and interest held in Trust Account

     1,128,747      —         1,128,747


Net income

   $ 961,618    $ 5,763,750     $ 6,725,368


Basic and diluted weighted average shares outstanding of Public Shares

     28,750,000      —         28,750,000


Basic and diluted net income per share, Public Shares

   $ 0.04    $ 0.15 (a)    $ 0.19


Basic and diluted weighted average shares outstanding of Founder Shares

     7,187,500      —         7,187,500


Basic and diluted net (loss) income per share, Founder Shares

   $ (0.02    $ 0.18 (a)    $ 0.16


F-215


Table of Contents

REPLAY ACQUISITION CORP.

NOTES TO FINANCIAL STATEMENTS


     For the three months ended June 30, 2020  
     As Reported      Restatement
Adjustments
    As Restated  

General and administrative expenses

   $ 96,052    $ —       $ 96,052


Loss from operations

     (96,052      —         (96,052

Loss on revaluation of warrant liability

     —          (6,936,250 )(a)      (6,936,250

Loss on marketable securities, dividends and interest held in Trust Account

     (14,168      —         (14,168


Net loss

   $ (110,220    $ (6,936,250   $ (7,046,470


Basic and diluted weighted average shares outstanding of Public Shares

     28,750,000      —         28,750,000


Basic and diluted net loss per share, Public Shares

   $ —        $ (0.20 )(a)    $ (0.20


Basic and diluted weighted average shares outstanding of Founder Shares

     7,187,500      —         7,187,500


Basic and diluted net loss per share, Founder Shares

   $ (0.01    $ (0.19 )(a)    $ (0.20


     For the three months ended September 30, 2020  
     As Reported      Restatement
Adjustments
    As Restated  

General and administrative expenses

   $ 1,058,292    $ —       $ 1,058,292


Loss from operations

     (1,058,292      —         (1,058,292

Loss on revaluation of warrant liability

     —          (1,106,250 )(a)      (1,106,250

Gain on marketable securities, dividends and interest held in Trust Account

     86,803      —         86,803


Net loss

   $ (971,489    $ (1,106,250   $ (2,077,739


Basic and diluted weighted average shares outstanding of Public Shares

     28,750,000      —         28,750,000


Basic and diluted net loss per share, Public Shares

   $ —        $ (0.06 )(a)    $ (0.06


Basic and diluted weighted average shares outstanding of Founder Shares

     7,187,500      —         7,187,500


Basic and diluted net loss per share, Founder Shares

   $ (0.15    $ (0.09 )(a)    $ (0.06


F-216


Table of Contents

REPLAY ACQUISITION CORP.

NOTES TO FINANCIAL STATEMENTS


     For the six months ended June 30, 2020  
     As Reported      Restatement
Adjustments
    As Restated  

General and administrative expenses

   $ 263,181    $ —       $ 263,181


Loss from operations

     (263,181      —         (263,181

Loss on revaluation of warrant liability

     —          (1,172,500 )(a)      (1,172,500

Gain on marketable securities, dividends and interest held in Trust Account

     1,114,579      —         1,114,579


Net income (loss)

   $ 851,398    $ (1,172,500   $ (321,102


Basic and diluted weighted average shares outstanding of Public Shares

     28,750,000      —         28,750,000


Basic and diluted net income (loss) per share, Public Shares

   $ 0.04    $ (0.04 )(a)    $ 0.00


Basic and diluted weighted average shares outstanding of Founder Shares

     7,187,500      —         7,187,500


Basic and diluted net loss per share, Founder Shares

   $ (0.04    $ —   (a)    $ (0.04


     For the nine months ended September 30, 2020  
     As Reported      Restatement
Adjustments
    As Restated  

General and administrative expenses

   $ 1,321,473    $ —       $ 1,321,473


Loss from operations

     (1,321,473      —         (1,321,473

Loss on revaluation of warrant liability

     —          (2,278,750 )(a)      (2,278,750

Gain on marketable securities, dividends and interest held in Trust Account

     1,201,382      —         1,201,382


Net loss

   $ (120,091    $ (2,278,750   $ (2,398,841


Basic and diluted weighted average shares outstanding of Public Shares

     28,750,000      —         28,750,000


Basic and diluted net income (loss) per share, Public Shares

   $ 0.04    $ (0.10 )(a)    $ (0.06


Basic and diluted weighted average shares outstanding of Founder Shares

     7,187,500      —         7,187,500


Basic and diluted net loss per share, Founder Shares

   $ (0.18    $ 0.08 (a)    $ (0.10


F-217


Table of Contents

REPLAY ACQUISITION CORP.

NOTES TO FINANCIAL STATEMENTS


     For the three months ended June 30, 2019  
     As Reported      Restatement
Adjustments
    As Restated  

General and administrative expenses

   $ 120,491    $ —       $ 120,491


Loss from operations

     (120,491      —         (120,491

Issuance costs allocated to Public Warrants

     —          (648,239 )(a)      (648,239

Gain on revaluation of warrant liability

     —          3,617,500 (a)      3,617,500  

Gain on marketable securities, dividends and interest held in Trust Account

     1,760,594      —         1,760,594


Net income

   $ 1,640,103    $ 2,969,261   $ 4,609,364


Basic and diluted weighted average shares outstanding of Public Shares

     28,750,000      —         28,750,000


Basic and diluted net income per share, Public Shares

   $ 0.06    $ 0.27 (a)   $ 0.33


Basic and diluted weighted average shares outstanding of Founder Shares

     7,187,500      —         7,187,500


Basic and diluted net loss) per share, Founder Shares

   $ (0.02    $ (0.65 )(a)   $ (0.67 )


     For the three months ended September 30, 2019  
     As Reported      Restatement
Adjustments
    As Restated  

General and administrative expenses

   $ 111,750    $ —       $ 111,750


Loss from operations

     (111,750      —         (111,750

Loss on revaluation of warrant liability

     —          (951,250 )(a)      (951,250

Gain on marketable securities, dividends and interest held in Trust Account

     1,561,854      —         1,561,854


Net income (loss)

   $ 1,450,104    $ (951,250   $ 498,854


Basic and diluted weighted average shares outstanding of Public Shares

     28,750,000      —         28,750,000


Basic and diluted net income (loss) per share, Public Shares

   $ 0.05    $ (0.03 )(a)    $ 0.02


Basic and diluted weighted average shares outstanding of Founder Shares

     7,187,500      —         7,187,500


Basic and diluted net loss per share, Founder Shares

   $ (0.02    $ (0.01 )(a)    $ (0.03


F-218


Table of Contents

REPLAY ACQUISITION CORP.

NOTES TO FINANCIAL STATEMENTS


     For the six months ended June 30, 2019  
     As Reported      Restatement
Adjustments
    As Restated  

General and administrative expenses

   $ 134,230    $ —       $ 134,230


Loss from operations

     (134,230      —         (134,230

Issuance costs allocated to Public Warrants

     —          (648,239 )(a)      (648,239

Gain on revaluation of warrant liability

     —          3,617,500 (a)      3,617,500  

Gain on marketable securities, dividends and interest held in Trust Account

     1,760,594      —         1,760,594


Net income

   $ 1,626,364    $ 2,969,261   $ 4,595,625


Basic and diluted weighted average shares outstanding of Public Shares

     28,750,000      —         28,750,000


Basic and diluted net income per share, Public Shares

   $ 0.06    $ 0.27 (a)   $ 0.33


Basic and diluted weighted average shares outstanding of Founder Shares

     7,187,500      —         7,187,500


Basic and diluted net loss per share, Founder Shares

   $ (0.02    $ (0.65 )(a)   $ (0.67 )


     For the nine months ended September 30, 2019  
     As Reported      Restatement
Adjustments
    As Restated  

General and administrative expenses

   $ 245,980    $ —       $ 245,980


Loss from operations

     (245,980      —         (245,980

Issuance costs allocated to Public Warrants

     —          (648,239 )(a)      (648,239

Gain on revaluation of warrant liability

     —          2,666,250 (a)      2,666,250  

Gain on marketable securities, dividends and interest held in Trust Account

     3,322,448      —         3,322,448


Net income

   $ 3,076,468    $ 2,018,011   $ 5,094,479


Basic and diluted weighted average shares outstanding of Public Shares

     28,750,000      —         28,750,000


Basic and diluted net income per share, Public Shares

   $ 0.12    $ 0.23 (a)   $ 0.35


Basic and diluted weighted average shares outstanding of Founder Shares

     7,187,500      —         7,187,500


Basic and diluted net loss per share, Founder Shares

   $ (0.03    $ (0.67 )(a)   $ (0.70


F-219


Table of Contents

REPLAY ACQUISITION CORP.

NOTES TO FINANCIAL STATEMENTS


The following tables contain the restatement of previously reported unaudited Statements of Cash Flows for the three month period ended March 31, 2020, the three and six month periods ended June 30, 2020, the three and nine month periods ended September 30, 2020, the three and six month periods ended June 30, 2019 and the three and nine month periods ended September 30, 2019.


     For the three months ended March 31, 2020  
     As Reported      Restatement
Adjustments
    As Restated  

Cash Flows from Operating Activities:


Net income

   $ 961,618    $ 5,763,750 (a)   $ 6,725,368

Adjustments to reconcile net income to net cash used in operating activities:


Gain on marketable securities, dividends and interest held in Trust Account

     (1,128,747      —         (1,128,747

Gain on revaluation of warrant liability

     —          (5,763,750 )(a)      (5,763,750

Changes in operating assets and liabilities:


Prepaid expenses

     16,903      —         16,903

Accounts payable

     11,337      —         11,337

Accrued expenses

     41,140      —         41,140


Net cash used in operating activities

     (97,749      —         (97,749


Net change in cash

     (97,749      —         (97,749

Cash - beginning of period

     1,589,795      —         1,589,795


Cash - end of period

   $ 1,492,046    $ —       $ 1,492,046


Supplemental disclosure of noncash activities:


Prepaid expenses included in accounts payable

   $ 63,750    $ —       $ 63,750  

Remeasurement of ordinary shares subject to possible redemption

   $ 961,620      $ (961,620 )(a)    $ —    


     For the six months ended June 30, 2020  
     As Reported      Restatement
Adjustments
    As Restated  

Cash Flows from Operating Activities:


Net income (loss)

   $ 851,398    $ (1,172,500 )(a)    $ (321,102

Adjustments to reconcile net income (loss) to net cash used in operating activities:


Gain on marketable securities, dividends and interest held in Trust Account

     (1,114,579      —         (1,114,579

Loss on revaluation of warrant liability

     —          1,172,500 (a)     1,172,500

Changes in operating assets and liabilities:


Prepaid expenses

     (20,595      —         (20,595

Accounts payable

     (60,517      —         (60,517

Accrued expenses

     16,140      —         16,140


Net cash used in operating activities

     (328,153      —         (328,153


F-220


Table of Contents

REPLAY ACQUISITION CORP.

NOTES TO FINANCIAL STATEMENTS


     For the six months ended June 30, 2020  
     As Reported      Restatement
Adjustments
    As Restated  

Net change in cash

     (328,153      —         (328,153

Cash - beginning of period

     1,589,795      —         1,589,795


Cash - end of period

   $ 1,261,642    $ —       $ 1,261,642


Supplemental disclosure of noncash activities:


Remeasurement of ordinary shares subject to possible redemption

   $ 851,400    $ (851,400 )(a)    $ —    


     For the nine months ended September 30, 2020  
     As Reported      Restatement
Adjustments
    As Restated  

Cash Flows from Operating Activities:


Net loss

   $ (120,091    $ (2,278,750 )(a)    $ (2,398,841

Adjustments to reconcile net loss to net cash used in operating activities:


Gain on marketable securities, dividends and interest held in Trust Account

     (1,201,382      —         (1,201,382

Loss on revaluation of warrant liability

     —          2,278,750 (a)     2,278,750

Changes in operating assets and liabilities:


Prepaid expenses

     15,654      —         15,654

Accounts payable

     284,630      —         284,630

Accrued expenses

     405,711      —         405,711


Net cash used in operating activities

     (615,478      —         (615,478


Net change in cash

     (615,478      —         (615,478

Cash - beginning of period

     1,589,795      —         1,589,795


Cash - end of period

   $ 974,317    $ —       $ 974,317


Supplemental disclosure of noncash activities:


Remeasurement of ordinary shares subject to possible redemption

   $ (120,090    $ 120,090 (a)    $ —    


F-221


Table of Contents

REPLAY ACQUISITION CORP.

NOTES TO FINANCIAL STATEMENTS


    For the six months ended June 30, 2019  
    As Reported     Restatement
Adjustments
    As Restated  

Cash Flows from Operating Activities:


Net income

  $ 1,626,364   $ 2,969,261 (a)    $ 4,595,625  

Adjustments to reconcile net income to net cash used in operating activities:


General and administrative expenses paid by related party

    2,206     —         2,206

Gain on marketable securities, dividends and interest held in Trust Account

    (1,760,594     —         (1,760,594

Gain on revaluation of warrant liability

    —         (3,617,500 )(a)      (3,617,500

Changes in operating assets and liabilities:


Prepaid expenses

    (138,629     —         (138,629

Accrued expenses

    82,575     —         82,575


Net cash used in operating activities

    (188,078     (648,239     (836,317


Cash Flows from Investing Activities:


Cash deposited in Trust Account

    (287,500,000     —         (287,500,000


Net cash used in investing activities

    (287,500,000     —         (287,500,000


Cash Flows from Financing Activities:


Proceeds from note payable to related party

    250,000     —         250,000

Repayment of note payable and advances from related party

    (252,206     —         (252,206

Proceeds received from initial public offering

    287,500,000     —         287,500,000

Proceeds from private placement

    7,750,000     —         7,750,000

Offering costs paid

    (5,800,229     648,239 (a)     (5,151,990


Net cash provided by (used in) financing activities

    289,447,565     648,239     290,095,804


Net change in cash

    1,759,487     —         1,759,487

Cash - beginning of period

    25,000     —         25,000


Cash - end of period

  $ 1,784,487   $ —       $ 1,784,487


Supplemental disclosure of noncash activities:


Offering costs included in accrued expenses

  $ 85,000   $ —       $ 85,000

Offering costs included in accounts payable

  $ 2,600   $ —       $ 2,600

Remeasurement of ordinary shares subject to possible redemption

  $ 276,823,340   $ (250,033,750 )(a)    $ 26,789,590  

Deferred underwriting commissions

  $     $ 9,187,500 (a)    $ 9,187,500  


F-222


Table of Contents

REPLAY ACQUISITION CORP.

NOTES TO FINANCIAL STATEMENTS


    For the nine months ended September 30, 2019  
    As Reported     Restatement
Adjustments
    As Restated  

Cash Flows from Operating Activities:


Net income

  $ 3,076,468   $ 2,018,011 (a)    $ 5,094,479  

Adjustments to reconcile net income to net cash used in operating activities:


General and administrative expenses paid by related party

    2,206     —         2,206

Gain on marketable securities, dividends and interest held in Trust Account

    (3,322,448     —         (3,322,448

Gain on revaluation of warrant liability

    —         (2,666,250 )(a)      (2,666,250

Changes in operating assets and liabilities:


Prepaid expenses

    (101,988     —         (101,988

Accounts payable

    79,620     —         79,620

Accrued expenses

    (87,694     —         (87,694


Net cash used in operating activities

    (353,836     (648,239     (1,002,075


Cash Flows from Investing Activities:


Cash deposited in Trust Account

    (287,500,000     —         (287,500,000


Net cash used in investing activities

    (287,500,000     —         (287,500,000


Cash Flows from Financing Activities:


Proceeds from note payable to related party

    250,000     —         250,000

Repayment of note payable and advances from related party

    (252,206     —         (252,206

Proceeds received from initial public offering

    287,500,000     —         287,500,000

Proceeds from private placement

    7,750,000     —         7,750,000

Offering costs paid

    (5,800,229     648,239 (a)     (5,151,990


Net cash provided by financing activities

    289,447,565     648,239     290,095,804


Net change in cash

    1,593,729     —         1,593,729

Cash - beginning of period

    25,000     —         25,000


Cash - end of period

  $ 1,618,729   $ —       $ 1,618,729


Supplemental disclosure of noncash activities:


Offering costs included in accrued expenses

  $ 85,000   $ —       $ 85,000

Offering costs included in accounts payable

  $ 2,600   $ —       $ 2,600

Remeasurement of ordinary shares subject to possible redemption

  $ 278,273,440   $ (251,483,850 )(a)    $ 26,789,590  

Deferred underwriting commissions

  $     $ 9,187,500 (a)    $ 9,187,500  


F-223


Table of Contents

REPLAY ACQUISITION CORP.

NOTES TO FINANCIAL STATEMENTS


  (a)

The Restatement Adjustments reflect the entries to record the initial liability for the Public and Private Warrants issued as part of Replay’s initial public offering and private placement, respectively, and to account for the adjustment to fair value of this liability at the end of each period presented. The initial fair value of the Public and Private Warrants of $19.3 million was recorded in April 2019 as a warrant liability with an offset to additional paid-in capital. In addition, the initial adjusting entry was also to expense approximately $648 thousand of costs directly associated with the issuance of the Public Warrants. The proceeds received from the sale of private warrants in excess of their fair value of $775 thousand was recognized as additional paid-in capital. For each subsequent quarter end, starting with June 30, 2019, the liability was revalued and the change in fair value reflected in “Gain/loss on revaluation of warrant liability” in the Statement of Operations. The Restatement Adjustment also reflect the impact of the remeasurement as of June 30, 2019 of the redeemable shares classified in temporary equity to align with the expected redemption amount of $287.5 million, the impact of the remeasurement of approximately $26.8 million was recognized as increase to the temporary equity balance with the offset to additional paid in capital and accumulated deficit. Additionally, the redemption amount was increased by the gains on marketable securities, dividends and interest held in the trust account, which is also subject to redemption by the ordinary shareholders. Lastly, the earning per share for both the Public and Founder shares was adjusted to account for the measurement adjustment to the temporary equity in accordance with the two classes of shares method and the guidance in ASC 480-10-S99-3A.


NOTE 9.

SUBSEQUENT EVENTS

In accordance with ASC Topic 855, Subsequent Events, which establishes general standards of accounting for and disclosure of events that occur after the balance sheet date but before financial statements are issued, the Company evaluated subsequent events and transactions that occurred after December 31, 2020, the balance sheet date, up to the date that the audited financial statements were available to be issued. As a result, the following transactions were identified as subsequent events as of May 17, 2021.

On October 12, 2020, the Company, FoA, New Pubco, Replay Merger Sub, Blocker Merger Sub, Blocker, Blocker GP, the Sellers and BTO Urban and Family Holdings, solely in their joint capacity as the Seller Representative, entered into the Transaction Agreement, pursuant to which the Company agreed to combine with FoA in the Proposed Business Combination that will result in New Pubco becoming a publicly-traded company on the NYSE and controlling FoA in an “UP-C” structure.

The Proposed Business Combination encompasses a series of transactions to effect an “UP-C” structure, pursuant to which, among other things: (i) the Company will change its jurisdiction of incorporation from the Cayman Islands to the State of Delaware by deregistering as an exempted company in the Cayman Islands and continuing and domesticating as Finance of America Companies, Inc. a limited liability company formed under the laws of the State of Delaware (the “Domestication”).

On April 1, the Company consummated the Proposed Business Combination with New Pubco resulting in the Domestication, whereby the Company became a wholly owned consolidated subsidiary of New Pubco. The Business Combination will be accounted for using the acquisition method with New Pubco as the accounting acquirer. Under the acquisition method of accounting, the Company’s assets and liabilities will be recorded at carrying value and the assets and liabilities associated with FoA will be recorded at estimated fair value as of the acquisition date. The excess of the purchase price over the estimated fair values of FoA’s net assets acquired, if applicable, was recognized as goodwill. For accounting purposes, the acquirer is the entity that has obtained control of another entity and, thus, consummated a business combination. The determination of whether control


F-224


Table of Contents

REPLAY ACQUISITION CORP.

NOTES TO FINANCIAL STATEMENTS


has been obtained begins with the evaluation of whether control should be evaluated based on the variable interest or voting interest model pursuant to ASC Topic 810, Consolidation (“ASC 810”). If the acquiree is a variable interest entity, the primary beneficiary would be the accounting acquirer. FoA meets the definition of a variable interest entity and the New Pubco was determined to be the primary beneficiary.

Additional disclosures required by ASC 805, Business Combinations, with respect to the acquisition have been omitted because the information needed for the disclosures is not currently available due to the close proximity of closing of this transaction with the date these financial statements are being issued.


F-225


Table of Contents

REPLAY ACQUISITION CORP.

BALANCE SHEETS


     March 31,
2021
    December 31,
2020
 
     (Unaudited)        

Assets:


Current assets:


Cash

   $ 482,585   $ 849,909

Prepaid expenses

     70,849     10,833


Total current assets

     553,434     860,742

Investments held in Trust Account

     293,322,399       293,315,407


Total assets

   $ 293,875,833   $ 294,176,149


Liabilities and Shareholders’ Equity:


Current liabilities:


Accounts payable

   $ 9,920,729   $ 916,939

Accrued expenses

     607,100     779,411


Total current liabilities

     10,527,829     1,696,350

Warrant liability

     25,408,750     35,351,250

Deferred underwriting commissions

     9,187,500     9,187,500


Total liabilities

     45,124,079     46,235,100


Commitments and contingencies (Note 5)


Ordinary shares, $0.0001 par value; 28,750,000 shares subject to possible redemption at $10.00 per share at March 31, 2021 and December 31, 2020

     287,500,000     287,500,000

Shareholders’ Equity:


Preference shares, $0.0001 par value; 2,000,000 shares authorized; none issued and outstanding

     —         —    

Ordinary shares, $0.0001 par value; 200,000,000 shares authorized; 7,187,500 shares issued and outstanding (excluding 28,750,000 shares subject to possible redemption) at March 31, 2021 and December 31, 2020

     719     719

Accumulated deficit

     (38,748,965     (39,559,670


Total shareholders’ equity

     (38,748,246     (39,558,951


Total Liabilities and Shareholders’ Equity

   $ 293,875,833   $ 294,176,149


The accompanying notes are an integral part of these unaudited financial statements.


F-226


Table of Contents

REPLAY ACQUISITION CORP.

STATEMENTS OF OPERATIONS

(UNAUDITED)


     For the three months ended
March 31,
 
     2021     2020  

General and administrative expenses

   $ 9,138,787   $ 167,129


Loss from operations

     (9,138,787     (167,129

Gain on revaluation of warrant liability

     9,942,500       5,763,750

Gain on marketable securities, dividends and interest held in Trust Account

     6,992     1,128,747


Net income

   $ 810,705     $ 6,725,368


Basic and diluted weighted average shares outstanding of Public Shares

     28,750,000     28,750,000


Basic and diluted net income per share, Public Shares

   $ 0.02   $ 0.19


Basic and diluted weighted average shares outstanding of Founder Shares

     7,187,500     7,187,500


Basic and diluted net income per share, Founder Shares

   $ 0.02   $ 0.16


The accompanying notes are an integral part of these unaudited financial statements.


F-227


Table of Contents

REPLAY ACQUISITION CORP.

STATEMENTS OF CHANGES IN SHAREHOLDERS’ EQUITY

(UNAUDITED)


     For the three months ended March 31, 2021  
     Ordinary Shares      Additional
Paid-In
Capital
     Accumulated
Deficit
    Total
Shareholders’
Equity
 
     Shares      Amounts  

Balance—December 31, 2020

     7,187,500    $ 719    $ —      $ (39,559,670   $ (39,558,951


Net income

     —          —          —          810,705       810,705  


Balance—March 31, 2021

     7,187,500      719      —          (38,748,965     (38,748,246


     For the three months ended March 31, 2020  
     Ordinary Shares      Additional
Paid-In
Capital
     Accumulated
Deficit
    Total
Shareholders’
Equity
 
     Shares      Amounts  

Balance—December 31, 2019

     7,187,500      719      —          (21,894,483     (21,893,764


Net income

     —          —          —          6,725,368     6,725,368


Balance—March 31, 2020

     7,187,500    $ 719    $ —      $ (15,169,115   $ (15,168,396


The accompanying notes are an integral part of these unaudited financial statements.


F-228


Table of Contents

REPLAY ACQUISITION CORP.

STATEMENTS OF CASH FLOWS

(UNAUDITED)


     For the three months ended
March 31,
 
     2021     2020  

Cash Flows from Operating Activities:


Net income

   $ 810,705     $ 6,725,368

Adjustments to reconcile net income to net cash used in operating activities:


Gain on marketable securities, dividends and interest held in Trust Account

     (6,992     (1,128,747

Gain on revaluation of warrant liability

     (9,942,500 )     (5,763,750

Changes in operating assets and liabilities:


Prepaid expenses

     (60,016     16,903

Accounts payable

     9,003,790       11,337

Accrued expenses

     (172,311     41,140


Net cash used in operating activities

     (367,324     (97,749


Net change in cash      (367,324 )     (97,749
Cash—beginning of period      849,909     1,589,795


Cash—end of period    $ 482,585     $ 1,492,046


Supplemental disclosure of noncash activities:


Prepaid expenses included in accounts payable

   $ —       $ 63,750  

The accompanying notes are an integral part of these unaudited financial statements.


F-229


Table of Contents

REPLAY ACQUISITION CORP.

NOTES TO UNAUDITED FINANCIAL STATEMENTS

Note 1—Description of Organization and Business Operations

Replay Acquisition Corp. (the “Company”) was incorporated as a Cayman Islands exempted company on November 6, 2018. The Company was formed for the purpose of effecting a merger, amalgamation, share exchange, asset acquisition, share purchase, reorganization or similar business combination with one or more businesses (the “Business Combination”). Although the Company is not limited to a particular business, industry or geographical location for purposes of consummating a Business Combination, the Company intends to focus its search for a target in Argentina and/or Brazil focused on industries that the Company believes have favorable prospects and a high likelihood of generating strong risk-adjusted returns for its shareholders. These industries include, but are not limited to, the consumer, telecommunications and technology, energy, financial services and real estate sectors. The Company is an emerging growth company and, as such, the Company is subject to all of the risks associated with emerging growth companies.

As of March 31, 2021, the Company had not commenced any operations. All activity for the period from November 6, 2018 (inception) through March 31, 2021 relates to the Company’s formation, the Company’s initial public offering (the “Initial Public Offering”) described below, and since the Initial Public Offering, the search for a potential target. The Company will not generate any operating revenues until after the completion of its initial Business Combination, at the earliest. The Company generates non-operating income in the form of investment income on cash and cash equivalents from the proceeds derived from the Initial Public Offering.

The Company’s sponsor is Replay Sponsor, LLC, a Delaware limited liability company (the “Sponsor”). The Company’s ability to commence operations is contingent upon obtaining adequate financial resources. The registration statement for the Company’s Initial Public Offering was declared effective on April 3, 2019. On April 8, 2019, the Company consummated its Initial Public Offering of 28,750,000 units (“Units”), including the issuance of 3,750,000 Units as a result of the underwriters’ full exercise of their over-allotment option, at $10.00 per Unit, generating gross proceeds of $287.5 million, and incurring offering costs of approximately $15.0 million, inclusive of approximately $9.2 million in deferred underwriting commissions (Note 5).

Simultaneously with the closing of the Initial Public Offering, the Company consummated the private placement (“Private Placement”) of 7,750,000 warrants (each, a “Private Placement Warrant” and collectively, the “Private Placement Warrants”) at a price of $1.00 per Private Placement Warrant to the Sponsor, generating gross proceeds of $7.75 million (Note 4).

On August 15, 2019, the Company received a written notice (the “Notice”) from the staff of NYSE Regulation of the New York Stock Exchange (“NYSE”) indicating that the Company was not then in compliance with Section 802.01B of the NYSE Listed Company Manual (the “Manual”), which requires the Company to maintain a minimum of 300 public shareholders on a continuous basis.

Pursuant to the Notice, the Company was subject to the procedures set forth in Sections 801 and 802 of the Manual. The Company submitted a business plan that demonstrated how the Company expected to return to compliance with the minimum public shareholders requirement within 18 months of receipt of the Notice.

On October 24, 2019, the Company was notified by the staff of NYSE Regulation that the NYSE’s Listings Operations Committee agreed to accept the Company’s business plan, and the Company was subject to quarterly monitoring for compliance with such plan. On November 5, 2020, the Company was notified by the staff of NYSE Regulation that the Company is a “company back in compliance” with Section 802.10B of the Manual.

The Company’s ordinary shares, warrants and Units, which trade under the symbols “RPLA,” “RPLA WS” and “RPLA.U,” respectively, will continue to be listed and traded on the NYSE and will no longer bear the indicator “.BC” on the consolidated tape to indicate noncompliance with the NYSE’s continued listing standards.


F-230


Table of Contents

REPLAY ACQUISITION CORP.

NOTES TO UNAUDITED FINANCIAL STATEMENTS


Trust Account

Upon the closing of the Initial Public Offering and Private Placement, $287.5 million ($10.00 per Unit) of the net proceeds of the sale of the Units in the Initial Public Offering and the Private Placement was placed in a trust account (the “Trust Account”), located in the United States at J.P. Morgan Chase Bank, N.A., with Continental Stock Transfer & Trust Company acting as trustee, and invested only in U.S. government securities, within the meaning set forth in Section 2(a)(16) of the Investment Company Act 1940, as amended (the “Investment Company Act”), with a maturity of 180 days or less or in any open-ended investment company that holds itself out as a money market fund selected by the Company meeting the conditions of paragraphs (d)(2), (d)(3) and (d)(4) of Rule 2a-7 of the Investment Company Act, as determined by the Company, until the earlier of: (i) the completion of a Business Combination and (ii) the distribution of the Trust Account as described below.

Initial Business Combination

The Company’s management has broad discretion with respect to the specific application of the net proceeds of the Initial Public Offering and the sale of Private Placement Warrants, although substantially all of the net proceeds are intended to be applied generally toward consummating a Business Combination. There is no assurance that the Company will be able to complete a Business Combination successfully. The Company must complete one or more initial Business Combinations having an aggregate fair market value of at least 80% of the assets held in the Trust Account (excluding the deferred underwriting commissions and taxes payable on income earned on the Trust Account) at the time of the agreement to enter into the initial Business Combination. However, the Company will only complete a Business Combination if the post-transaction company owns or acquires 50% or more of the outstanding voting securities of the target or otherwise acquires a controlling interest in the target sufficient for it not to be required to register as an investment company under the Investment Company Act.

The Company will provide its holders (the “Public Shareholders”) of its ordinary shares, par value $0.0001 per share, sold in the Initial Public Offering (the “Public Shares”), with the opportunity to redeem all or a portion of their Public Shares upon the completion of a Business Combination either (i) in connection with a shareholder meeting called to approve the Business Combination or (ii) by means of a tender offer. The decision as to whether the Company will seek shareholder approval of a Business Combination or conduct a tender offer will be made by the Company, solely in its discretion. The Public Shareholders will be entitled to redeem their Public Shares for a pro rata portion of the amount then in the Trust Account (initially anticipated to be $10.00 per Public Share). The per-share amount to be distributed to Public Shareholders who redeem their Public Shares will not be reduced by the deferred underwriting commissions the Company will pay to the underwriters (as discussed in Note 5). These Public Shares were classified as temporary equity upon the completion of the Initial Public Offering in accordance with the Financial Accounting Standards Board’s (“FASB”) Accounting Standards Codification (“ASC”) Topic 480, Distinguishing Liabilities from Equity (“ASC 480”). In such case, the Company will proceed with a Business Combination if the Company has net tangible assets of at least $5,000,001 upon such consummation of a Business Combination and a majority of the shares voted are voted in favor of the Business Combination. If a shareholder vote is not required by law and the Company does not decide to hold a shareholder vote for business or other legal reasons, the Company will, pursuant to its Amended and Restated Memorandum and Articles of Association (the “Amended and Restated Memorandum and Articles of Association”), conduct the redemptions pursuant to the tender offer rules of the U.S. Securities and Exchange Commission (“SEC”) and file tender offer documents with the SEC prior to completing a Business Combination. If, however, shareholder approval of the transactions is required by law, or the Company decides to obtain shareholder approval for business or legal reasons, the Company will offer to redeem shares in conjunction with a proxy solicitation pursuant to the proxy rules and not pursuant to the tender offer rules. Additionally, each Public Shareholder may elect to redeem their Public Shares irrespective of whether they vote for or against the


F-231


Table of Contents

REPLAY ACQUISITION CORP.

NOTES TO UNAUDITED FINANCIAL STATEMENTS


Business Combination. If the Company seeks shareholder approval in connection with a Business Combination, the initial shareholders (as defined below) agreed to vote their Founder Shares (as defined below in Note 4) and any Public Shares purchased during or after the Initial Public Offering in favor of a Business Combination. Subsequent to the consummation of the Initial Public Offering, the Company will adopt an insider trading policy which will require insiders to: (i) refrain from purchasing shares during certain blackout periods and when they are in possession of any material non-public information and (ii) to clear all trades with the Company’s legal counsel prior to execution. In addition, the initial shareholders agreed to waive their redemption rights with respect to their Founder Shares and Public Shares in connection with the completion of a Business Combination.

Notwithstanding the foregoing, the Amended and Restated Memorandum and Articles of Association provide that a Public Shareholder, together with any affiliate of such shareholder or any other person with whom such shareholder is acting in concert or as a “group” (as defined under Section 13 of the Securities Exchange Act of 1934, as amended (the “Exchange Act”)), will be restricted from redeeming its shares with respect to more than an aggregate of 15% or more of the ordinary shares sold in the Initial Public Offering, without the prior consent of the Company.

The Company’s Sponsor, officers and directors (the “initial shareholders”) agreed not to propose an amendment to the Amended and Restated Memorandum and Articles of Association (a) that would modify the substance or timing of the Company’s obligation to redeem 100% of its Public Shares if the Company does not complete a Business Combination within 24 months from the closing of the Initial Public Offering, or April 8, 2021, (the “Combination Period”) or (b) with respect to any other provision relating to shareholders’ rights or pre-initial Business Combination activity, unless the Company provides the Public Shareholders with the opportunity to redeem their ordinary shares in conjunction with any such amendment.

If the Company is unable to complete a Business Combination within the Combination Period, the Company will (1) cease all operations except for the purpose of winding up, (2) as promptly as reasonably possible but no more than 10 business days thereafter, subject to lawfully available funds therefor, redeem the Public Shares, at a per-share price, payable in cash, equal to the aggregate amount then on deposit in the Trust Account, including interest (less up to $100,000 of interest to pay dissolution expenses and which interest shall be net of taxes payable), divided by the number of then issued and outstanding Public Shares, which redemption will completely extinguish Public Shareholders’ rights as shareholders (including the right to receive further liquidating distributions, if any), subject to applicable law, and (3) as promptly as reasonably possible following such redemption, subject to the approval of the Company’s remaining shareholders and its board of directors, dissolve and liquidate, subject in each case to the Company’s obligations under Cayman Islands law to provide for claims of creditors and the requirements of other applicable law.

The initial shareholders agreed to waive their liquidation rights with respect to the Founder Shares if the Company fails to complete a Business Combination within the Combination Period. However, if the initial shareholders should acquire Public Shares in or after the Initial Public Offering, they will be entitled to liquidating distributions from the Trust Account with respect to such Public Shares if the Company fails to complete a Business Combination within the Combination Period. The underwriters agreed to waive their rights to their deferred underwriting commissions (see Note 5) held in the Trust Account in the event the Company does not complete a Business Combination within the Combination Period and, in such event, such amounts will be included with the other funds held in the Trust Account that will be available to fund the redemption of the Public Shares. In the event of such distribution, it is possible that the per share value of the residual assets remaining available for distribution (including Trust Account assets) will be less than the $10.00 per share initially held in the Trust Account. In order to protect the amounts held in the Trust Account, the Sponsor agreed to be liable to the Company if and to the extent any claims by a third party (other than the Company’s independent auditors) for services rendered or products sold to the Company, or a prospective target business


F-232


Table of Contents

REPLAY ACQUISITION CORP.

NOTES TO UNAUDITED FINANCIAL STATEMENTS


with which the Company has discussed entering into a transaction agreement, reduce the amount of funds in the Trust Account below (1) $10.00 per Public Share or (2) such lesser amount per Public Share held in the Trust Account as of the date of the liquidation of the Trust Account due to reductions in the value of the trust assets, in each case net of the interest which may be withdrawn to pay taxes. This liability will not apply with respect to any claims by a third party who executed a waiver of any right, title, interest or claim of any kind in or to any monies held in the Trust Account or to any claims under the Company’s indemnity of the underwriters of the Initial Public Offering against certain liabilities, including liabilities under the Securities Act of 1933, as amended (the “Securities Act”).

Moreover, in the event that an executed waiver is deemed to be unenforceable against a third party, the Sponsor will not be responsible to the extent of any liability for such third-party claims. The Company will seek to reduce the possibility that the Sponsor will have to indemnify the Trust Account due to claims of creditors by endeavoring to have all vendors, service providers (other than the Company’s independent auditors), prospective target businesses or other entities with which the Company does business, execute agreements with the Company waiving any right, title, interest or claim of any kind in or to monies held in the Trust Account.

Proposed Business Combination

On October 12, 2020, the Company; Finance of America Equity Capital LLC, a Delaware limited liability company (“FoA”),; Finance of America Companies Inc., a Delaware corporation and wholly owned subsidiary of the Company (“New Pubco”); RPLY Merger Sub LLC, a Delaware limited liability company and wholly owned subsidiary of New Pubco (“Replay Merger Sub”); RPLY BLKR Merger Sub LLC, a Delaware limited liability company and wholly owned subsidiary of New Pubco (“Blocker Merger Sub”); Blackstone Tactical Opportunities Fund (Urban Feeder) – NQ L.P., a Delaware limited partnership (“Blocker”); Blackstone Tactical Opportunities Associates – NQ L.L.C., a Delaware limited liability company; BTO Urban Holdings L.L.C., a Delaware limited liability company (“BTO Urban”), Blackstone Family Tactical Opportunities Investment Partnership – NQ – ESC L.P., a Delaware limited partnership (“ESC”), Libman Family Holdings LLC, a Connecticut limited liability company (“Family Holdings”), The Mortgage Opportunity Group LLC, a Connecticut limited liability company(“TMO”), L and TF, LLC, a North Carolina limited liability company (“L&TF”), UFG Management Holdings LLC, a Delaware limited liability company (“Management Holdings”), and Joe Cayre (each of BTO Urban, ESC, Family Holdings, TMO, L&TF, Management Holdings and Joe Cayre, a “Seller” and, collectively, the “Sellers”); and BTO Urban and Family Holdings, solely in their joint capacity as the representative of the Sellers pursuant to Section 12.18 of the Transaction Agreement (as defined below) (the “Seller Representative”), entered into a Transaction Agreement (the “Transaction Agreement”), pursuant to which the Company agreed to combine with FoA in a series of transactions (collectively, the “Proposed Business Combination”) that will result in New Pubco becoming a publicly-traded company on the New York Stock Exchange (“NYSE”) and controlling FoA in an “UP-C” structure. See Note 8.

Going Concern Consideration

As of March 31, 2021, the Company had approximately $480,000 outside of the Trust Account and working capital deficit of approximately $18.7 million.

Through March 31, 2021, the Company’s liquidity needs have been satisfied through receipt of a $25,000 capital contribution from the Sponsor in exchange for the issuance of the Founder Shares (Note 4) to the Sponsor, $250,000 in note payable to the Sponsor and approximately $2,000 of general and administrative expenses paid by a related party on behalf of the Company. Subsequent to the consummation of the Initial Public Offering, the Company received the net proceeds from the consummation of the Private Placement not held in the Trust Account of $2.0 million. The Company fully repaid the note and the advances to the Sponsor and the related party in May 2019.


F-233


Table of Contents

REPLAY ACQUISITION CORP.

NOTES TO UNAUDITED FINANCIAL STATEMENTS


In addition, in order to finance transaction costs in connection with a Business Combination, the Sponsor or an affiliate of the Sponsor, or certain of the Company’s officers and directors may, but are not obligated to, loan the Company Working Capital Loans (Note 4). Except for the foregoing, the terms of such Working Capital Loans, if any, have not been determined and no written agreements exist with respect to such loans. The Working Capital Loans would either be repaid upon consummation of a Business Combination, without interest, or, at the lender’s discretion, up to $1.5 million of such Working Capital Loans may be convertible into warrants at a price of $1.00 per warrant. The warrants would be identical to the Private Placement Warrants. As of March 31, 2021, the Company has no borrowings under the Working Capital Loans.

Based on the foregoing, management believes that the Company will have sufficient working capital and borrowing capacity from the Sponsor or an affiliate of the Sponsor, or certain of the Company’s officers and directors to meet its needs through the earlier of the consummation of a Business Combination or one year from this filing. Over this time period, the Company will be using these funds for paying existing accounts payable, identifying and evaluating prospective initial Business Combination candidates, performing due diligence on prospective target businesses, paying for travel expenditures, selecting the target business to merge with or acquire, and structuring, negotiating and consummating the Business Combination.

Note 2—Summary of Significant Accounting Policies

Basis of Presentation

The accompanying unaudited financial statements of the Company have been prepared in accordance with United States generally accepted accounting principles (“GAAP”) for interim financial information and Article 8 of Regulation S-X. Accordingly, they do not include all of the information and footnotes required by GAAP. In the opinion of management, all adjustments (consisting of normal accruals) considered for a fair presentation have been included. Operating results for the three months ended March 31, 2021 are not necessarily indicative of the results that may be expected for the year ending December 31, 2021.

The accompanying unaudited financial statements should be read in conjunction with the audited financial statements and notes thereto included on Form 10-K/A filed by the Company with the U.S. Securities and Exchange Commission (the “SEC”) on May 17, 2021.

Emerging Growth Company

The Company is an “emerging growth company,” as defined in Section 2(a) of the Securities Act, as modified by the “JOBS Act, and it may take advantage of certain exemptions from various reporting requirements that are applicable to other public companies that are not emerging growth companies including, but not limited to, not being required to comply with the auditor attestation requirements of Section 404 of the Sarbanes-Oxley Act of 2002, reduced disclosure obligations regarding executive compensation in its periodic reports and proxy statements, and exemptions from the requirements of holding a nonbinding advisory vote on executive compensation and stockholder approval of any golden parachute payments not previously approved.

Further, Section 102(b)(1) of the JOBS Act exempts emerging growth companies from being required to comply with new or revised financial accounting standards until private companies (that is, those that have not had a Securities Act registration statement declared effective or do not have a class of securities registered under the Exchange Act) are required to comply with the new or revised financial accounting standards. The JOBS Act provides that an emerging growth company can elect to opt out of the extended transition period and comply with the requirements that apply to non-emerging growth companies but any such an election to opt out is irrevocable. The Company has elected not to opt out of such extended transition period, which means that when a standard is


F-234


Table of Contents

REPLAY ACQUISITION CORP.

NOTES TO UNAUDITED FINANCIAL STATEMENTS


issued or revised and it has different application dates for public or private companies, the Company, as an emerging growth company, can adopt the new or revised standard at the time private companies adopt the new or revised standard.

This may make comparison of the Company’s unaudited financial statements with another public company that is neither an emerging growth company nor an emerging growth company that has opted out of using the extended transition period difficult or impossible because of the potential differences in accounting standards used.

Use of Estimates

The preparation of unaudited financial statements in conformity with GAAP requires the Company’s management to make estimates and assumptions that affect the reported amounts of assets and liabilities and disclosure of contingent assets and liabilities at the date of the unaudited financial statements and the reported amounts of revenues and expenses during the reporting period. Making estimates requires management to exercise significant judgment. It is at least reasonably possible that the estimate of the effect of a condition, situation or set of circumstances that existed at the date of the unaudited financial statements, which management considered in formulating its estimate, could change in the near term due to one or more future confirming events. Accordingly, the actual results could differ significantly from those estimates.

Concentrations of Credit Risk

Financial instruments that potentially subject the Company to credit risk consist principally of cash and investments held in the Trust Account. Cash is maintained in accounts with financial institutions, which, at times may exceed the Federal depository insurance coverage of $250,000. The Company has not experienced losses on its cash accounts and management believes, based upon the quality of the financial institutions, that the credit risk with regard to these deposits is not significant. The Company’s investments held in the Trust Account consists entirely of U.S. government securities with an original maturity of 180 days or less.

Cash and Cash Equivalents

The Company considers all short-term investments with an original maturity of three months or less when purchased to be cash equivalents. The Company did not have any cash equivalents as of March 31, 2021 and December 31, 2020.

Investments Held in Trust Account

The Company’s portfolio of investments held in the Trust Account are comprised solely of U.S. government securities, within the meaning set forth in Section 2(a)(16) of the Investment Company Act, with a maturity of 180 days or less, classified as trading securities. Trading securities are presented on the Balance Sheets at fair value at the end of each reporting period. Gains and losses resulting from the change in fair value of these securities is included in gain on marketable securities, dividends and interest held in the Trust Account in the accompanying Statements of Operations. The fair value for trading securities is determined using quoted market prices in active markets.

Warrant Liability

The Company accounts for warrants for the Company’s ordinary shares as liabilities at fair value on the Balance Sheets because the warrants do not meet the criteria for classification within equity. Offering costs were allocated


F-235


Table of Contents

REPLAY ACQUISITION CORP.

NOTES TO UNAUDITED FINANCIAL STATEMENTS


to the Ordinary Shares and Public Warrants and the amounts allocated to the Public Warrants were expensed immediately. The warrants are subject to remeasurement at each balance sheet date and any change in fair value is recognized in the Statements of Operations. The Company will continue to adjust the liability for changes in fair value until the earlier of the exercise or expiration of the Warrants. At that time, the portion of the warrant liability related to the Warrants will be reclassified to additional paid-in capital.

Fair Value Measurements

ASC 820, Fair Value Measurement, defines fair value and requires disclosures about fair value measurements. Fair value is defined as the price that would be received for sale of an asset or paid for transfer of a liability in an orderly transaction between market participants at the measurement date. GAAP establishes a three-tier fair value hierarchy, which prioritizes the inputs used in measuring fair value.

The hierarchy gives the highest priority to unadjusted quoted prices in active markets for identical assets or liabilities (Level 1 measurements) and the lowest priority to unobservable inputs (Level 3 measurements). These tiers include:


Level 1, defined as observable inputs such as quoted prices for identical instruments in active markets;


Level 2, defined as inputs other than quoted prices in active markets that are either directly or indirectly observable such as quoted prices for similar instruments in active markets or quoted prices for identical or similar instruments in markets that are not active; and


Level 3, defined as unobservable inputs in which little or no market data exists, therefore requiring an entity to develop its own assumptions, such as valuations derived from valuation techniques in which one or more significant inputs or significant value drivers are unobservable.

As of March 31, 2021 and December 31, 2020, the recorded values of cash, prepaid expenses, accrued expenses and accounts payable approximate the fair values due to the short-term nature of the instruments. The Company’s investments held in the Trust Account are comprised of investments in U.S. government securities with an original maturity of 180 days or less. The fair value for trading securities is determined using quoted market prices in active markets.

Offering Costs Associated with the Initial Public Offering

Offering costs incurred in connection with preparation of the Initial Public Offering, of approximately $15.1 million, consisted principally of underwriter discounts of $14.4 million (including $9.2 million of which payment is deferred) and approximately $638,000 of professional, printing, filing, regulatory and other costs. These expenses, together with the underwriting discounts and commissions, were allocated to the ordinary shares and the public warrants. Amounts allocated to the ordinary shares were recognized as a reduction to the ordinary shares carrying value and the amounts allocated to the public warrants were expensed immediately.

Ordinary Shares Subject to Possible Redemption

The Company accounts for its ordinary shares subject to possible redemption in accordance with the guidance in ASC 480. Ordinary shares subject to mandatory redemption (if any) are classified as liability instruments and are measured at redemption value. Conditionally redeemable ordinary shares (including ordinary shares that feature redemption rights that are either within the control of the holder or subject to redemption upon the occurrence of uncertain events not solely within the Company’s control) are classified as temporary equity. At all other times, ordinary shares are classified as shareholders’ equity. The Company’s ordinary shares feature certain redemption


F-236


Table of Contents

REPLAY ACQUISITION CORP.

NOTES TO UNAUDITED FINANCIAL STATEMENTS


rights that are considered to be outside of the Company’s control and subject to the occurrence of uncertain future events. Accordingly, at March 31, 2021 and December 31, 2020, 28,750,000 ordinary shares subject to possible redemption are presented as temporary equity outside of the shareholders’ equity section of the Company’s Balance Sheets.

The ordinary shares subject to possible redemption are subject to the subsequent measurement guidance in ASC 480. Under such guidance, the Company must subsequently measure the shares to their redemption amount because, as a result of the allocation of net proceeds to the Public Warrants, the initial carrying amount of the Ordinary Shares is less than $10.00 per share. In accordance with the guidance, the Company has elected to measure the Ordinary Shares subject to possible redemption to their redemption amount (i.e., $10.00 per share) immediately as if the end of the first reporting period after the IPO, June 30, 2019, was the redemption date.

Net Income (Loss) Per Ordinary Share

The Company complies with accounting and disclosure requirements of FASB ASC Topic 260, Earnings Per Share. The Statements of Operations include a presentation of income (loss) per public share and income (loss) per founder share following the two-class method of income per share. In order to determine the Net income (loss) attributable to both the public and founder shares, the Company first considered the total income (loss) allocable to both sets of shares. This is calculated using the total net income (loss) less any dividends paid. For purposes of calculating net income (loss) per share, any Remeasurement of the ordinary shares subject to possible redemption was considered to be dividends paid to the public shareholders. Subsequent to calculating the total income (loss) allocable to both sets of shares, the company split the amount to be allocated using a ratio of 80% for the public shares and 20% for the founder shares, reflective of the respective participation rights.

For the three months ended March 31, 2021, basic and diluted net income per share of Public Shares, were calculated by dividing 80% of the total income allocable to all shares of approximately $800,000, by the weighted average number of 28,750,000 Public Shares outstanding for the period. For the three months ended March 31, 2021, basic and diluted net loss per share of Founder Shares were calculated by dividing 20% of the total income allocable to all shares of approximately $800,000, by the weighted average number of 7,187,500 Founder Shares outstanding for the period.

For the three months ended March 31, 2020, basic and diluted net income per share of Public Shares, were calculated by dividing 80% of the total income allocable to all shares of approximately $5.6 million, by the weighted average number of 28,750,000 Public Shares outstanding for the period. For the three months ended March 31, 2020, basic and diluted net income per share of Founder Shares were calculated by dividing 20% of the total income allocable to all shares of approximately $5.6 million, by the weighted average number of 7,187,500 Founder Shares outstanding for the period.

At March 31, 2021 and March 31, 2020, the Company did not have any dilutive securities and other contracts that could, potentially, be exercised or converted into ordinary shares and then share in our earnings. As a result, diluted loss per share is the same as basic loss per share for the periods presented.

Income Taxes

FASB ASC 740, Income Taxes, prescribes a recognition threshold and a measurement attribute for the financial statement recognition and measurement of tax positions taken or expected to be taken in a tax return. For those benefits to be recognized, a tax position must be more likely than not to be sustained upon examination by taxing authorities. There were no unrecognized tax benefits as of March 31, 2021 and December 31, 2020. The Company’s management determined that the Cayman Islands is the Company’s only major tax jurisdiction. The


F-237


Table of Contents

REPLAY ACQUISITION CORP.

NOTES TO UNAUDITED FINANCIAL STATEMENTS


Company recognizes accrued interest and penalties related to unrecognized tax benefits as income tax expense. No amounts were accrued for the payment of interest and penalties at March 31, 2021 and December 31, 2020. The Company is currently not aware of any issues under review that could result in significant payments, accruals or material deviation from its position. The Company is subject to income tax examinations by major taxing authorities since inception. There is currently no taxation imposed on income by the Government of the Cayman Islands. In accordance with Cayman income tax regulations, income taxes are not levied on the Company. Consequently, income taxes are not reflected in the Company’s financial statements.

There is currently no taxation imposed on income by the Government of the Cayman Islands. In accordance with Cayman income tax regulations, income taxes are not levied on the Company. Consequently, income taxes are not reflected in the Company’s financial statements.

Risks and Uncertainties

Management continues to evaluate the impact of the COVID-19 pandemic on the industry and has concluded that while it is reasonably possible that the virus could have a negative effect on the Company’s financial position, results of its operations and/or search for a target company, the specific impact is not readily determinable as of the date of these unaudited financial statements. The unaudited financial statements do not include any adjustments that might result from the outcome of this uncertainty.

Recent Accounting Pronouncements

In August 2020, the FASB issued ASU No. 2020-06, Debt—Debt with Conversion and Other Options (Subtopic 470-20) and Derivatives and Hedging—Contracts in Entity’s Own Equity (Subtopic 815-40): Accounting for Convertible Instruments and Contracts in an Entity’s Own Equity (“ASU 2020-06”), which simplifies accounting for convertible instruments by removing major separation models required under current GAAP. The ASU also removes certain settlement conditions that are required for equity-linked contracts to qualify for the derivative scope exception, and it simplifies the diluted earnings per share calculation in certain areas. The Company adopted ASU 2020-06 on January 1, 2021. Adoption of the ASU did not impact the Company’s financial position, results of operations or cash flows.

Note 3—Initial Public Offering

On April 8, 2019, the Company sold 28,750,000 Units, including the issuance of 3,750,000 Units as a result of the underwriters’ full exercise of their over-allotment option, at a purchase price of $10.00 per Unit in the Initial Public Offering. Of these, an aggregate of 2,500,000 Units in the Initial Public Offering (“Affiliate Units”) were purchased by certain affiliates of the Sponsor for gross proceeds of $25.0 million.

Each Unit consists of one ordinary share and one-half of one redeemable warrant (each, a “Public Warrant”). Each whole Public Warrant entitles the holder to purchase one ordinary share at a price of $11.50 per share, subject to adjustment (see Note 6).

Note 4—Related Party Transactions

Founder Shares and Private Placement Warrants

In December 2018, the Sponsor purchased 7,187,500 ordinary shares, par value $0.0001 per share (the “Founder Shares”), for an aggregate price of $25,000. In March 2019, the Sponsor transferred to the Company’s independent directors an aggregate of 90,000 Founder Shares for an aggregate purchase price of $313. The Sponsor agreed to forfeit up to 937,500 Founder Shares to the extent that the over-allotment option was not


F-238


Table of Contents

REPLAY ACQUISITION CORP.

NOTES TO UNAUDITED FINANCIAL STATEMENTS


exercised in full by the underwriters. The forfeiture was to be adjusted to the extent that the over-allotment option was not exercised in full by the underwriters so that the Founder Shares would represent 20.0% of the Company’s issued and outstanding shares after the Initial Public Offering. On April 5, 2019, the underwriters fully exercised their over-allotment option which closed simultaneously with the Initial Public Offering; thus, the 937,500 Founder Shares were no longer subject to forfeiture.

The initial shareholders agreed, subject to limited exceptions, not to transfer, assign or sell any of their Founder Shares until the earlier to occur of: (A) one year after the completion of the initial Business Combination or (B) subsequent to the initial Business Combination, (x) if the last reported sale price of the ordinary shares equals or exceeds $12.00 per share (as adjusted for share splits, share dividends, rights issuances, subdivisions, reorganizations, recapitalizations and the like) for any 20 trading days within any 30-trading day period commencing at least 150 days after the initial Business Combination, or (y) the date on which the Company completes a liquidation, merger, amalgamation, share exchange, reorganization or other similar transaction that results in all of the Company’s shareholders having the right to exchange their ordinary shares for cash, securities or other property.

Simultaneously with the closing of the Initial Public Offering on April 8, 2019, the Company sold 7,750,000 Private Placement Warrants to the Sponsor at a price of $1.00 per Private Placement Warrant, generating gross proceeds of $7.75 million. Each Private Placement Warrant is exercisable for one ordinary share at a price of $11.50 per share. The Private Placement Warrants have been accounted for as liabilities, with an initial fair value of $6,975,000. The difference between the proceeds received and the fair value was recognized as a capital contribution in additional paid-in capital on the Statements of Changes in Shareholders’ Equity. A portion of the net proceeds from the Private Placement Warrants was added to the proceeds from the Initial Public Offering held in the Trust Account. If the Company does not complete a Business Combination within the Combination Period, the Private Placement Warrants will expire worthless. The Private Placement Warrants will be non-redeemable and exercisable on a cashless basis so long as they are held by the Sponsor or its permitted transferees.

The Sponsor and the Company’s officers and directors agreed, subject to limited exceptions, not to transfer, assign or sell any of their Private Placement Warrants until 30 days after the completion of the initial Business Combination.

Contemporaneously with the execution of the Transaction Agreement, the initial shareholders entered into an amendment and restatement of the existing Sponsor Agreement (as amended and restated, the “Sponsor Agreement”) with New Pubco, the Company and FoA, pursuant to which, among other things, (i) immediately prior to the Domestication (as defined below), all of the Private Placement Warrants owned by the Sponsor will be exchanged for ordinary shares and (ii) excluding the Founder Shares held by the Company’s independent directors (unless transferred to any other initial shareholder or permitted transferee thereof), 40% of the Founder Shares held by the Sponsor will be vested and wholly owned by the Sponsor as of the closing of the Proposed Business Combination and 60% of the Founder Shares held by the Sponsor will be subject to vesting and forfeiture in accordance with certain terms and conditions. See Note 8.

Pursuant to the Sponsor Agreement, the initial shareholders have agreed to (i) vote or cause to be voted at the general meeting all of their Founder Shares and all other equity securities that they hold in the Company in favor of each proposal in connection with the Proposed Business Combination and the Transaction Agreement and any other matters reasonably necessary for consummation of the Proposed Business Combination, (ii) use reasonable best efforts to cause to be done all reasonably necessary, proper or advisable actions to consummate the Proposed Business Combination, (iii) waive all redemption rights and certain other rights in connection with the Proposed Business Combination and (iv) be bound by the same exclusivity obligations that bind the purchaser-side parties in the Transaction Agreement.


F-239


Table of Contents

REPLAY ACQUISITION CORP.

NOTES TO UNAUDITED FINANCIAL STATEMENTS


PIPE Agreements

Concurrently with the execution of the Transaction Agreement, the Company entered into the Replay PIPE Agreements (as defined below) with various investors, including an affiliate of the Sponsor, pursuant to which such investors agreed to purchase ordinary shares (which ordinary shares will be converted into Replay LLC Units pursuant to the Domestication and then will be converted into the right to receive shares of Class A Common Stock pursuant to the Replay Merger (as defined below)). In the aggregate, the PIPE Investors (as defined below) have committed to purchase $250.0 million of PIPE Shares (as defined below), at a purchase price of $10.00 per PIPE Share, including $10.0 million of PIPE Shares to be purchased by an affiliate of the Sponsor.

Related Party Loans

On December 1, 2018, the Sponsor agreed to loan the Company an aggregate of up to $250,000 to cover expenses related to the Initial Public Offering pursuant to a promissory note (the “Note”). This loan was non-interest bearing and payable on the earlier of June 30, 2019 or the completion of the Initial Public Offering. The Company borrowed $250,000 under the Note, and fully repaid on May 6, 2019.

In addition to the Note, the Company borrowed approximately $2,000 from a related party for general and administrative expenses. The Company repaid this amount on May 7, 2019.

Working Capital Loans

In addition, in order to finance transaction costs in connection with a Business Combination, the Sponsor or an affiliate of the Sponsor, or certain of the Company’s officers and directors may, but are not obligated to, loan the Company funds as may be required (“Working Capital Loans”). If the Company completes a Business Combination, the Company would repay the Working Capital Loans out of the proceeds of the Trust Account released to the Company. Otherwise, the Working Capital Loans would be repaid only out of funds held outside the Trust Account. In the event that a Business Combination does not close, the Company may use a portion of proceeds held outside the Trust Account to repay the Working Capital Loans but no proceeds held in the Trust Account would be used to repay the Working Capital Loans. Except for the foregoing, the terms of such Working Capital Loans, if any, have not been determined and no written agreements exist with respect to such loans. The Working Capital Loans would either be repaid upon consummation of a Business Combination, without interest, or, at the lender’s discretion, up to $1.5 million of such Working Capital Loans may be convertible into warrants at a price of $1.00 per warrant. The warrants would be identical to the Private Placement Warrants. To date, the Company had no borrowings under the Working Capital Loans.

Reimbursement

The Sponsor, officers and directors, or any of their respective affiliates, will be reimbursed for any out-of-pocket expenses incurred in connection with activities on the Company’s behalf such as identifying potential target businesses and performing due diligence on suitable Business Combinations. The Company’s Audit Committee will review on a quarterly basis all payments that were made to the Sponsor, officers, directors or the Company’s or any of their affiliates and will determine which expenses and the amount of expenses that will be reimbursed. There is no cap or ceiling on the reimbursement of out-of-pocket expenses incurred by such persons in connection with activities on the Company’s behalf.


F-240


Table of Contents

REPLAY ACQUISITION CORP.

NOTES TO UNAUDITED FINANCIAL STATEMENTS


Note 5—Commitments and Contingencies

Registration Rights

The holders of Founder Shares, Private Placement Warrants and warrants that may be issued upon conversion of Working Capital Loans, if any, and any ordinary shares underlying such securities, are entitled to registration rights pursuant to a Registration Rights Agreement entered into on April 3, 2019. These holders will be entitled to certain demand and “piggyback” registration rights. However, the Registration Rights Agreement provides that the Company will not permit any registration statement filed under the Securities Act to become effective until the termination of the applicable lock-up period for the securities to be registered. The Company will bear the expenses incurred in connection with the filing of any such registration statements.

Underwriting Agreement

The Company granted the underwriters a 45-day option from the date of the final prospectus relating to the Initial Public Offering to purchase up to 3,750,000 additional Units to cover over-allotments, if any, at the Initial Public Offering price less the underwriting discounts and commissions. On April 5, 2019, the underwriters fully exercised their over-allotment option which closed simultaneously with the Initial Public Offering.

Except on the Affiliate Units, the underwriters were entitled to an underwriting discount of $0.20 per Unit, or $5.25 million in the aggregate, paid upon the closing of the Initial Public Offering. In addition, $0.35 per Unit, or approximately $9.19 million in the aggregate will be payable to the underwriters for deferred underwriting commissions. The deferred fee will become payable to the underwriters from the amounts held in the Trust Account solely in the event that the Company completes a Business Combination, subject to the terms of the underwriting agreement.

Note 6—Shareholders’ Equity

Ordinary Shares—The Company is currently authorized to issue 200,000,000 ordinary shares with a par value of $0.0001 per share. Holders of ordinary shares are entitled to one vote for each share. The Company sold 28,750,000 Units in the Initial Public Offering, and 7,187,500 ordinary shares to the Sponsors (Founders Shares). As a result, as of March 31, 2021 and December 31, 2020, there were 35,937,500 ordinary shares issued and outstanding, including 28,750,000 ordinary shares subject to possible redemption, respectively.

Preference Shares—The Company is authorized to issue 2,000,000 preference shares with such designations, voting and other rights and preferences as may be determined from time to time by the Company’s board of directors. As of March 31, 2021 and December 31, 2020, there were no preference shares issued or outstanding.

Warrants—Public Warrants may only be exercised for a whole number of shares. No fractional Public Warrants will be issued upon separation of the Units and only whole Public Warrants will trade. The Public Warrants will become exercisable 30 days after the completion of a Business provided that the Company has an effective registration statement under the Securities Act covering the ordinary shares issuable upon exercise of the Public Warrants and a current prospectus relating to them is available (or the Company permits holders to exercise their Public Warrants on a cashless basis and such cashless exercise is exempt from registration under the Securities Act). The Company has agreed that as soon as practicable, but in no event later than 15 business days, after the closing of a Business Combination, the Company will use its best efforts to file with the SEC a registration statement for the registration, under the Securities Act, of the ordinary shares issuable upon exercise of the Public Warrants. If the shares issuable upon exercise of the warrants are not registered under the Securities Act, the Company will be required to permit holders to exercise their warrants on a cashless basis. However, no warrant will be exercisable for cash or on a cashless basis, and the Company will not be obligated to issue any shares to


F-241


Table of Contents

REPLAY ACQUISITION CORP.

NOTES TO UNAUDITED FINANCIAL STATEMENTS


holders seeking to exercise their warrants, unless the issuance of the shares upon such exercise is registered or qualified under the securities laws of the state of the exercising holder, or an exemption from registration is available. Notwithstanding the above, if the Company’s ordinary shares are at the time of any exercise of a warrant not listed on a national securities exchange such that it satisfies the definition of a “covered security” under Section 18(b)(1) of the Securities Act, the Company may, at its option, require holders of Public Warrants who exercise their warrants to do so on a “cashless basis” in accordance with Section 3(a)(9) of the Securities Act and, in the event the Company so elects, the Company will not be required to file or maintain in effect a registration statement, but the Company will use its best efforts to register or qualify the shares under applicable blue sky laws to the extent an exemption is not available.

The Public Warrants will expire five years after the completion of a Business Combination or earlier upon redemption or liquidation.

The Private Placement Warrants are identical to the Public Warrants underlying the Units sold in the Initial Public Offering, except that the Private Placement Warrants and the ordinary shares issuable upon exercise of the Private Placement Warrants will not be transferable, assignable or salable until 30 days after the completion of a Business Combination, subject to certain limited exceptions. Additionally, the Private Placement Warrants will be non-redeemable so long as they are held by the initial purchasers or such purchasers’ permitted transferees. If the Private Placement Warrants are held by someone other than the initial purchasers or their permitted transferees, the Private Placement Warrants will be redeemable by the Company and exercisable by such holders on the same basis as the Public Warrants.

The Company may call the Public Warrants for redemption (except with respect to the Private Placement Warrants):


in whole and not in part;


at a price of $0.01 per warrant;


upon a minimum of 30 days’ prior written notice of redemption; and


if, and only if, the last reported closing price of the ordinary shares equals or exceeds $18.00 per share for any 20 trading days within a 30-trading day period ending on the third trading day prior to the date on which the Company sends the notice of redemption to the warrant holders.

If the Company calls the Public Warrants for redemption, management will have the option to require all holders that wish to exercise the Public Warrants to do so on a “cashless basis,” as described in the warrant agreement.

The exercise price and number of ordinary shares issuable upon exercise of the warrants may be adjusted in certain circumstances including in the event of a share dividend, recapitalization, reorganization, merger or consolidation. In addition, if (x) the Company issues additional ordinary shares or equity-linked securities for capital raising purposes in connection with the closing of its initial Business Combination at an issue price or effective issue price of less than $9.20 per ordinary share (with such issue price or effective issue price to be determined in good faith by the Company’s board of directors and, in the case of any such issuance to the Sponsor or its affiliates, without taking into account any Founder Shares held by the Sponsor or such affiliates, as applicable, prior to such issuance) (the “Newly Issued Price”), (y) the aggregate gross proceeds from such issuances represent more than 60% of the total equity proceeds, and interest thereon, available for the funding of the Company’s initial Business Combination on the date of the consummation of such initial Business Combination (net of redemptions), and (z) the volume weighted average trading price of the Company’s ordinary shares during the 20 trading day period starting on the trading day prior to the day on which the Company consummates its initial Business Combination (such price, the “Market Value”) is below $9.20 per share, the


F-242


Table of Contents

REPLAY ACQUISITION CORP.

NOTES TO UNAUDITED FINANCIAL STATEMENTS


exercise price of the warrants will be adjusted (to the nearest cent) to be equal to 115% of the higher of the Market Value and the Newly Issued Price and the $18.00 per share redemption trigger price described above will be adjusted (to the nearest cent) to be equal to 180% of the higher of the Market Value and the Newly Issued Price. Additionally, in no event will the Company be required to net cash settle the warrant shares. If the Company is unable to complete a Business Combination within the Combination Period and the Company liquidates the funds held in the Trust Account, holders of warrants will not receive any of such funds with respect to their warrants, nor will they receive any distribution from the Company’s assets held outside of the Trust Account with the respect to such warrants. Accordingly, the warrants may expire worthless.

The Company accounts for the Public Warrants and Private Placement Warrants as liabilities in accordance with the guidance contained in ASC 815-40, Derivatives and Hedging — Contracts in Entity’s Own Equity. Because the Company does not control the occurrence of events, such as a tender offer or exchange, that may trigger cash settlement of the warrants where not all of the shareholders also receive cash, the warrants do not meet the criteria for equity treatment thereunder, as such, the warrants must be recorded as derivative liability.

Additionally, certain adjustments to the settlement amount of the Private Placement Warrants are based on a variable that is not an input to the fair value of a “fixed-for-fixed” option as defined under ASC 815-40, and thus the Private Placement Warrants are not considered indexed to the Company’s own stock and not eligible for an exception from derivative accounting.

The Company record a derivative liability upon the issuance of the warrants. Accordingly, the Company classifed each warrant as a liability at its fair value. The Public Warrants were allocated a portion of the proceeds from the issuance of the Units equal to its fair value determined by the Monte Carlo simulation. The warrant liability is subject to re measurement at each balance sheet date. With each such re-measurement, the warrant liability will be adjusted to fair value, with the change in fair value recognized in the Company’s Statements of Operations. The Company will reassess the classification of the warrants at each balance sheet date. If the classification changes as a result of events during the period, the warrants will be reclassified as of the date of the event that causes the reclassification.

Note 7—Fair Value Measurements

The following tables present information about the Company’s financial assets that are measured at fair value on a recurring basis as of March 31, 2021 and December 31, 2020 by level within the fair value hierarchy:

March 31, 2021


Description

   Quoted Prices
in Active
Markets
(Level 1)
     Significant
Other
Observable
Inputs

(Level 2)
     Significant
Other
Unobservable
Inputs

(Level 3)
 

Assets:


Investments held in Trust Account

   $ 293,322,399      $ —      $ —  

Liabilities:


Warrants

   $ —      $ 25,408,750    $ —  


F-243


Table of Contents

REPLAY ACQUISITION CORP.

NOTES TO UNAUDITED FINANCIAL STATEMENTS


December 31, 2020


Description

   Quoted Prices
in Active
Markets
(Level 1)
     Significant
Other
Observable
Inputs
(Level 2)
     Significant
Other
Unobservable
Inputs
(Level 3)
 

Assets:


Investments held in Trust Account

   $ 293,315,407    $ —      $ —  

Liabilities:


Warrants

   $ —      $ 35,351,250    $ —  

The Company has determined that the Warrants are subject to treatment as a Liability. As the transfer of the Private Placement Warrants to anyone other than the purchasers or their permitted transferees would result in the Private Placement Warrants having substantially the same terms as the Public Warrants issued in the Offering, the Company has determined that the fair value of each Warrant issued as part of the Private Placement Warrants is the same as that of a Warrant issued in the Offering, with an insignificant adjustment for short-term marketability restrictions. Accordingly, the Warrants are classified as Level 2 financial instruments.

Note 8—Subsequent Events

In accordance with ASC Topic 855, Subsequent Events, which establishes general standards of accounting for and disclosure of events that occur after the balance sheet date but before financial statements are issued, the Company evaluated subsequent events and transactions that occurred after March 31, 2021, the balance sheet date, up to the date that the financial statements were available to be issued. As a result, the following transactions were identified as subsequent events as of March 31, 2021.

On October 12, 2020, the Company, FoA, New Pubco, Replay Merger Sub, Blocker Merger Sub, Blocker, Blocker GP, the Sellers and BTO Urban and Family Holdings, solely in their joint capacity as the Seller Representative, entered into the Transaction Agreement, pursuant to which the Company agreed to combine with FoA in the Proposed Business Combination that will result in New Pubco becoming a publicly-traded company on the NYSE and controlling FoA in an “UP-C” structure.

The Proposed Business Combination encompasses a series of transactions to effect an “UP-C” structure, pursuant to which, among other things: (i) the Company will change its jurisdiction of incorporation from the Cayman Islands to the State of Delaware by deregistering as an exempted company in the Cayman Islands and continuing and domesticating as Replay Acquisition LLC a limited liability company formed under the laws of the State of Delaware (the “Domestication”).

On April 1, the Company consummated the Proposed Business Combination with New Pubco resulting in the Domestication, whereby the Company became a wholly owned consolidated subsidiary of New Pubco. The Business Combination will be accounted for using the acquisition method with New Pubco as the accounting acquirer. Under the acquisition method of accounting, the Company’s assets and liabilities will be recorded at carrying value and the assets and liabilities associated with FoA will be recorded at estimated fair value as of the acquisition date. The excess of the purchase price over the estimated fair values of FoA’s net assets acquired, if applicable, will be recognized as goodwill. For accounting purposes, the acquirer is the entity that has obtained control of another entity and, thus, consummated a business combination. The determination of whether control has been obtained begins with the evaluation of whether control should be evaluated based on the variable interest or voting interest model pursuant to ASC Topic 810, Consolidation (“ASC 810”). If the acquiree is a


F-244


Table of Contents

REPLAY ACQUISITION CORP.

NOTES TO UNAUDITED FINANCIAL STATEMENTS


variable interest entity, the primary beneficiary would be the accounting acquirer. FoA meets the definition of a variable interest entity and the New Pubco was determined to be the primary beneficiary.

Additional disclosures required by ASC 805, Business Combinations, with respect to the acquisition have been omitted because the information needed for the disclosures is not currently available due to the close proximity of closing of this transaction with the date these financial statements are being issued.


F-245