Filed by Replay Acquisition Corp.
pursuant to Rule 425 under the Securities Act of 1933
and deemed filed pursuant to Rule 14a-12
under the Securities Exchange Act of 1934
Subject Company:
Replay Acquisition Corp. (SEC File No. 001-38859)
Date: December 2, 2020
Finance of America Equity Capital LLC (“FoA”) prepared a presentation, which was first used by FoA on December 2, 2020 in presentations to analysts. A copy of the analyst day presentation is set forth below.
 |
Analyst Day Presentation December 2020 ©2020 Finance of America Equity Capital LLC |
 |
Disclaimer This presentation contemplates the proposed business combination involving Replay Acquisition Corp. (“Replay”) and Finance of America Equity Capital LLC (together with its subsidiaries and affiliates, “Finance of America”). Forward-Looking Statements This presentation includes “forward-looking statements” within the meaning of the “safe harbor” provisions of the United States Private Securities Litigation Reform Act of 1995. Replay Acquisition’s and Finance of America’s actual results may differ from their expectations, estimates, and projections and, consequently, you should not rely on these forward-looking statements as predictions of future events. Words such as “expect,” “estimate,” “project,” “budget,” “forecast,” “anticipate,” “intend,” “plan,” “may,” “will,” “could,” “should,” “believes,” “predicts,” “potential,” “continue,” and similar expressions (or the negative versions of such words or expressions) are intended to identify such forward-looking statements. These forward-looking statements include, without limitation, Replay Acquisition’s and Finance of America’s expectations with respect to future performance and anticipated financial impacts of the proposed business combination, the satisfaction or waiver of the closing conditions to the proposed business combination, and the timing of the completion of the proposed business combination. These forward-looking statements involve significant risks and uncertainties that could cause the actual results to differ materially, and potentially adversely, from those expressed or implied in the forward-looking statements. Most of these factors are outside Replay Acquisition’s and Finance of America’s control and are difficult to predict. Factors that may cause such differences include, but are not limited to: (1) the occurrence of any event, change, or other circumstances that could give rise to the termination of the definitive transaction agreement (the “Agreement”); (2) the outcome of any legal proceedings that may be instituted against Replay Acquisition, New Pubco (as defined below) and/or Finance of America following the announcement of the Agreement and the transactions contemplated therein; (3) the inability to complete the proposed business combination, including due to failure to obtain approval of the shareholders of Replay Acquisition, certain regulatory approvals, or satisfy other conditions to closing in the Agreement; (4) the occurrence of any event, change, or other circumstance that could give rise to the termination of the Agreement or could otherwise cause the transaction to fail to close; (5) the impact of COVID-19 on Finance of America’s business and/or the ability of the parties to complete the proposed business combination; (6) the inability to obtain or maintain the listing of New Pubco’s shares of common stock on the New York Stock Exchange following the proposed business combination; (7) the risk that the proposed business combination disrupts current plans and operations as a result of the announcement and consummation of the proposed business combination; (8) the ability to recognize the anticipated benefits of the proposed business combination, which may be affected by, among other things, competition, the ability of Finance of America to grow and manage growth profitably, and retain its key employees; (9) costs related to the proposed business combination; (10) changes in applicable laws or regulations; and (11) the possibility that Finance of America, Replay Acquisition or New Pubco may be adversely affected by other economic, business, and/or competitive factors. The foregoing list of factors is not exclusive. Additional information concerning certain of these and other risk factors is contained in Replay Acquisition’s most recent filings with the SEC and in the Form S-4, including the preliminary proxy statement/prospectus filed in connection with the proposed business combination and, when available, the definitive proxy statement/prospectus. All subsequent written and oral forward-looking statements concerning Replay Acquisition, Finance of America or New Pubco, the transactions described herein or other matters and attributable to Replay Acquisition, Finance of America, New Pubco or any person acting on their behalf are expressly qualified in their entirety by the cautionary statements above. Readers are cautioned not to place undue reliance upon any forward-looking statements, which speak only as of the date made. Each of Replay Acquisition, Finance of America and New Pubco expressly disclaims any obligations or undertaking to release publicly any updates or revisions to any forward-looking statements contained herein to reflect any change in their expectations with respect thereto or any change in events, conditions, or circumstances on which any statement is based, except as required by law. Statement Regarding Non-GAAP Financial Measures This presentation also contains non-GAAP financial information. Management uses this information in its internal analysis of results and believes that this information may be useful to investors in assessing Finance of America’s operating performance. Such non-GAAP financial information, including Finance of America’s definitions and methods of calculation, are not necessarily comparable to similarly titled measures of other companies. Reconciliations of these non-GAAP financial measures to their most directly comparable GAAP measures are set forth in the Appendix. For example, this presentation includes Adjusted EBITDA, which excludes items that are significant in understanding and assessing Finance of America’s financial results or position. Therefore, this measure should not be considered in isolation or as an alternative to net income, cash flows from operations or other measures of profitability, liquidity or performance under GAAP. No Offer or Solicitation This presentation is not a proxy statement or solicitation of a proxy, consent, or authorization with respect to any securities or in respect of the proposed business combination. This presentation shall also not constitute an offer to sell or the solicitation of an offer to buy any securities, nor shall there be any sale of securities in any states or jurisdictions in which such offer, solicitation, or sale would be unlawful prior to registration or qualification under the securities laws of any such jurisdiction. No offering of securities shall be made except by means of a prospectus meeting the requirements of Section 10 of the Securities Act of 1933, as amended, or an exemption therefrom. Important Information About the Proposed Business Combination and Where to Find It In connection with the proposed business combination, a registration statement on Form S-4 (the “Form S-4”) has been filed by Finance of America Companies Inc., a newly-formed holding company (“New Pubco”), with the U.S. Securities and Exchange Commission (“SEC”) that includes a preliminary proxy statement of Replay Acquisition that also constitutes a preliminary prospectus of New Pubco. Replay Acquisition, Finance of America and New Pubco urge investors, stockholders and other interested persons to read the Form S-4, including the preliminary proxy statement/prospectus and amendments thereto and, when available, the definitive proxy statement/prospectus and documents incorporated by reference therein, as well as other documents filed with the SEC in connection with the proposed business combination, as these materials will contain important information about Finance of America, Replay Acquisition, and the proposed business combination. Such persons can also read Replay Acquisition’s Annual Report on Form 10-K for the fiscal year ended December 31, 2019, for a description of the security holdings of Replay Acquisition’s officers and directors and their respective interests as security holders in the consummation of the proposed business combination. When available, the definitive proxy statement/prospectus will be mailed to Replay Acquisition’s stockholders as of a record date to be established for voting on the proposed business combination. Shareholders will also be able to obtain copies of such documents, without charge, once available, at the SEC’s website at www.sec.gov, or by directing a request to: Replay Acquisition Corp., 767 Fifth Avenue, 46th Floor, New York, New York 10153, or info@replayacquisition.com. These documents, once available, can also be obtained, without charge, at the SEC’s web site (http://www.sec.gov). Participants in the Solicitation Replay Acquisition, Finance of America, New Pubco and their respective directors, executive officers and other members of their management and employees, under SEC rules, may be deemed to be participants in the solicitation of proxies of Replay Acquisition’s shareholders in connection with the proposed business combination. Investors and security holders may obtain more detailed information regarding the names, affiliations and interests of Replay Acquisition’s directors and executive officers in Replay Acquisition’s Annual Report on Form 10-K for the fiscal year ended December 31, 2019, which was filed with the SEC on March 25, 2020. Information regarding the persons who may, under SEC rules, be deemed participants in the solicitation of proxies of Replay Acquisition’s shareholders in connection with the proposed business combination is set forth in the proxy statement/prospectus for the proposed business combination. Information concerning the interests of Replay Acquisition’s and Finance of America’s participants in the solicitation, which may, in some cases, be different than those of Replay Acquisition’s and Finance of America’s equity holders generally, is set forth in the proxy statement/prospectus relating to the proposed business combination. |
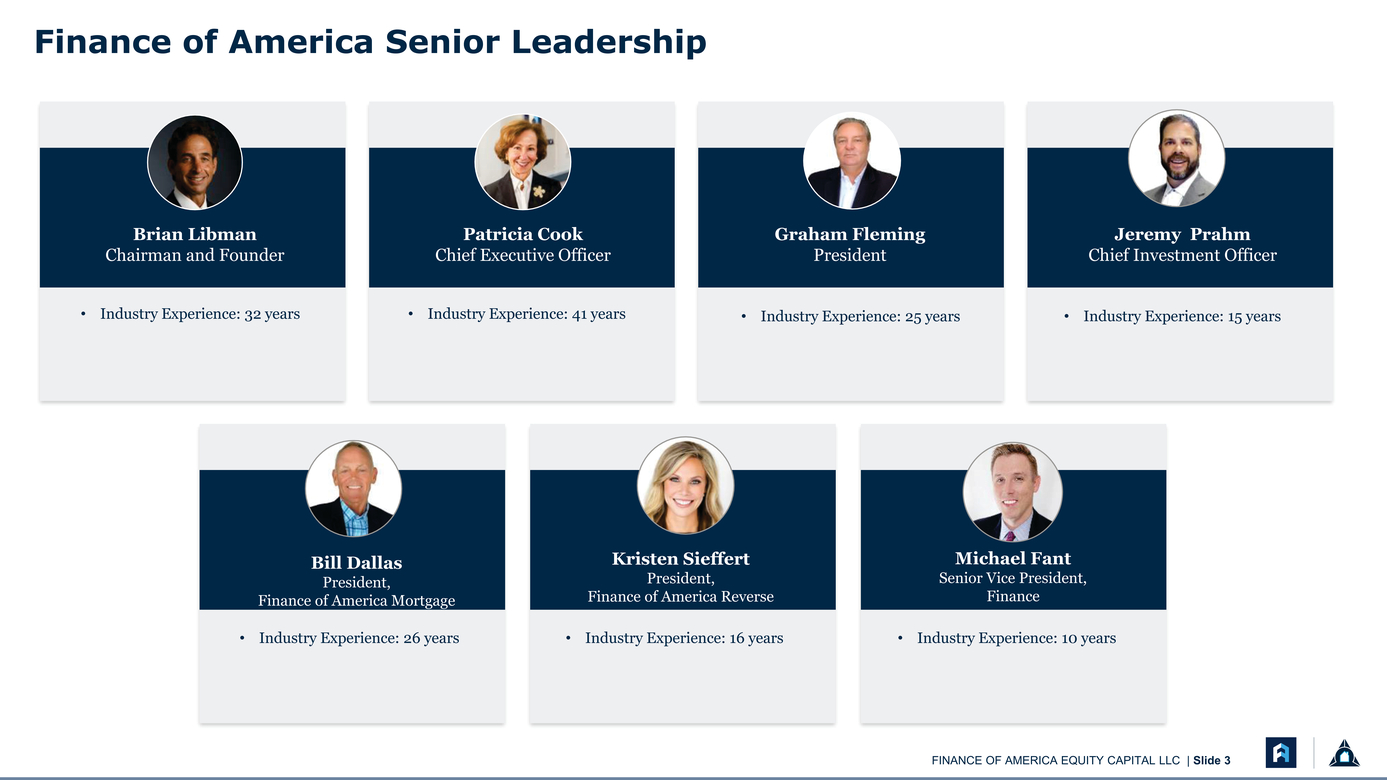 |
Finance of America Senior Leadership Brian Libman Chairman and Founder Industry Experience: 32 years Patricia Cook Chief Executive Officer Industry Experience: 41 years Graham Fleming President Industry Experience: 25 years Jeremy Prahm Chief Investment Officer Industry Experience: 15 years Bill Dallas President, Finance of America Mortgage Industry Experience: 26 years Kristen Sieffert President, Finance of America Reverse Industry Experience: 16 years Michael Fant Senior Vice President, Finance Industry Experience: 10 years |
 |
1 Business Overview |
 |
What We Have Built: A vertically integrated lending platform which seamlessly connects borrowers with investors Our Opportunity: Further expand our capabilities to serve the full lifecycle of borrower needs while achieving investor goals FINANCE OF AMERICA EQUITY CAPITAL LLC | Slide 5 |
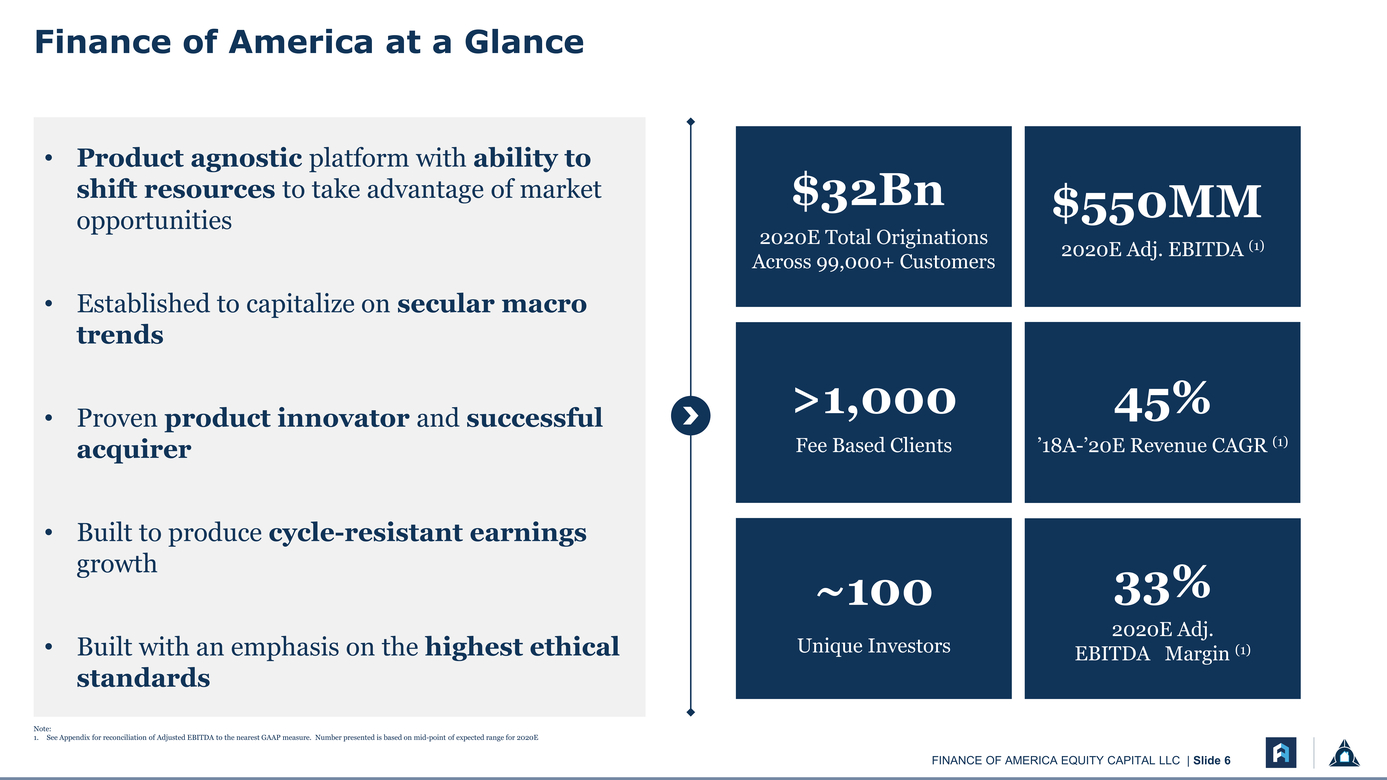 |
Product agnostic platform with ability to shift resources to take advantage of market opportunities Established to capitalize on secular macro trends Proven product innovator and successful acquirer Built to produce cycle-resistant earnings growth Built with an emphasis on the highest ethical standards $32Bn 2020E Total Originations Across 99,000+ Customers >1,000 Fee Based Clients ~100 Unique Investors $550MM 2020E Adj. EBITDA (1) 45% ’18A-’20E Revenue CAGR (1) 33% 2020E Adj. EBITDAMargin (1) Note: 1. See Appendix for reconciliation of Adjusted EBITDA to the nearest GAAP measure. Number presented is based on mid-point of expected range for 2020E |
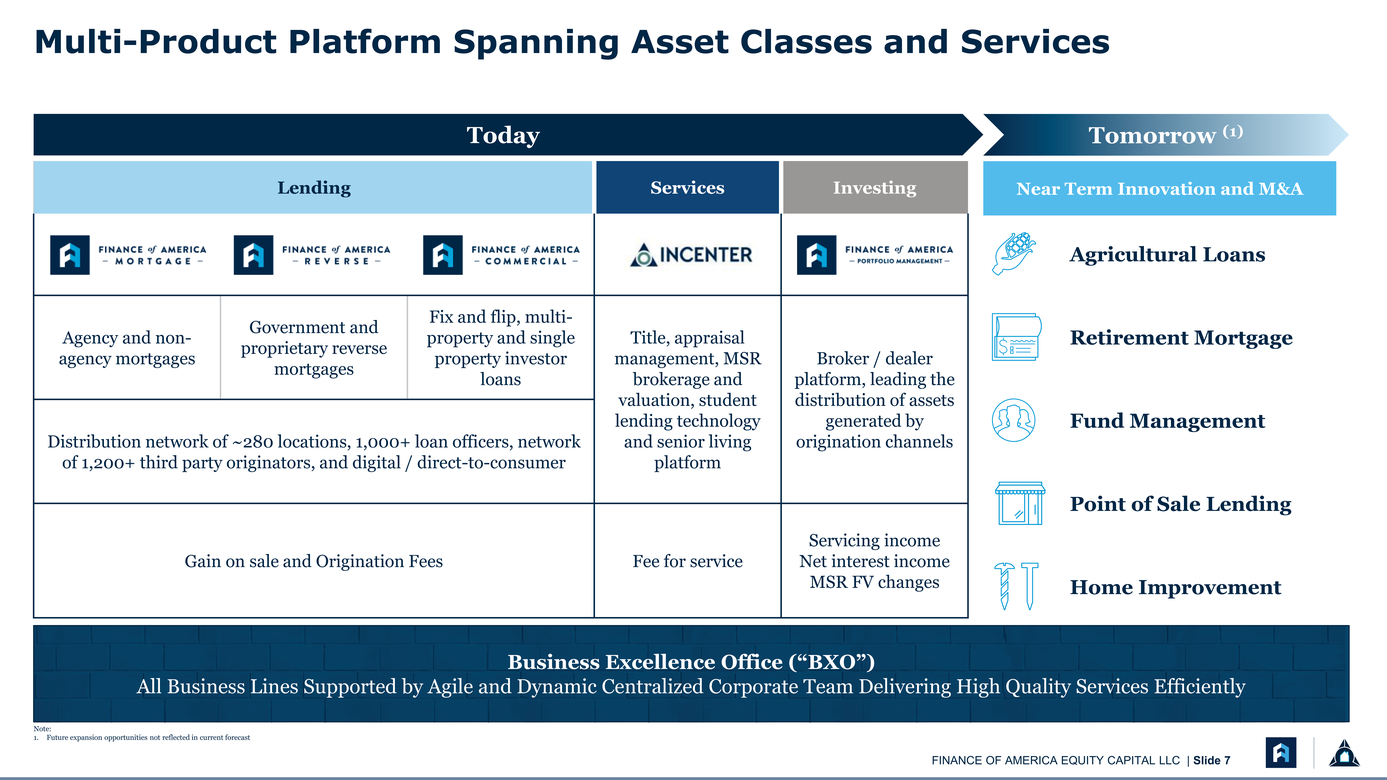 |
Today Tomorrow (1) Lending Services Investing Agency and non-agency mortgages Government and proprietary reverse mortgages Fix and flip, multi-property and single property investor loans Title, appraisal management, MSR brokerage and valuation, student lending technology and senior living platform Broker / dealer platform, leading the distribution of assets generated by origination channels Distribution network of ~280 locations, 1,000+ loan officers, network of 1,200+ third party originators, and digital / direct-to-consumer Gain on sale and Origination Fees Fee for service Servicing income Net interest income MSR FV changes Agricultural Loans Retirement Mortgage Fund Management Point of Sale Lending Home Improvement Business Excellence Office (“BXO”) All Business Lines Supported by Agile and Dynamic Centralized Corporate Team Delivering High Quality Services Efficiently Note: Future expansion opportunities not reflected in current forecast |
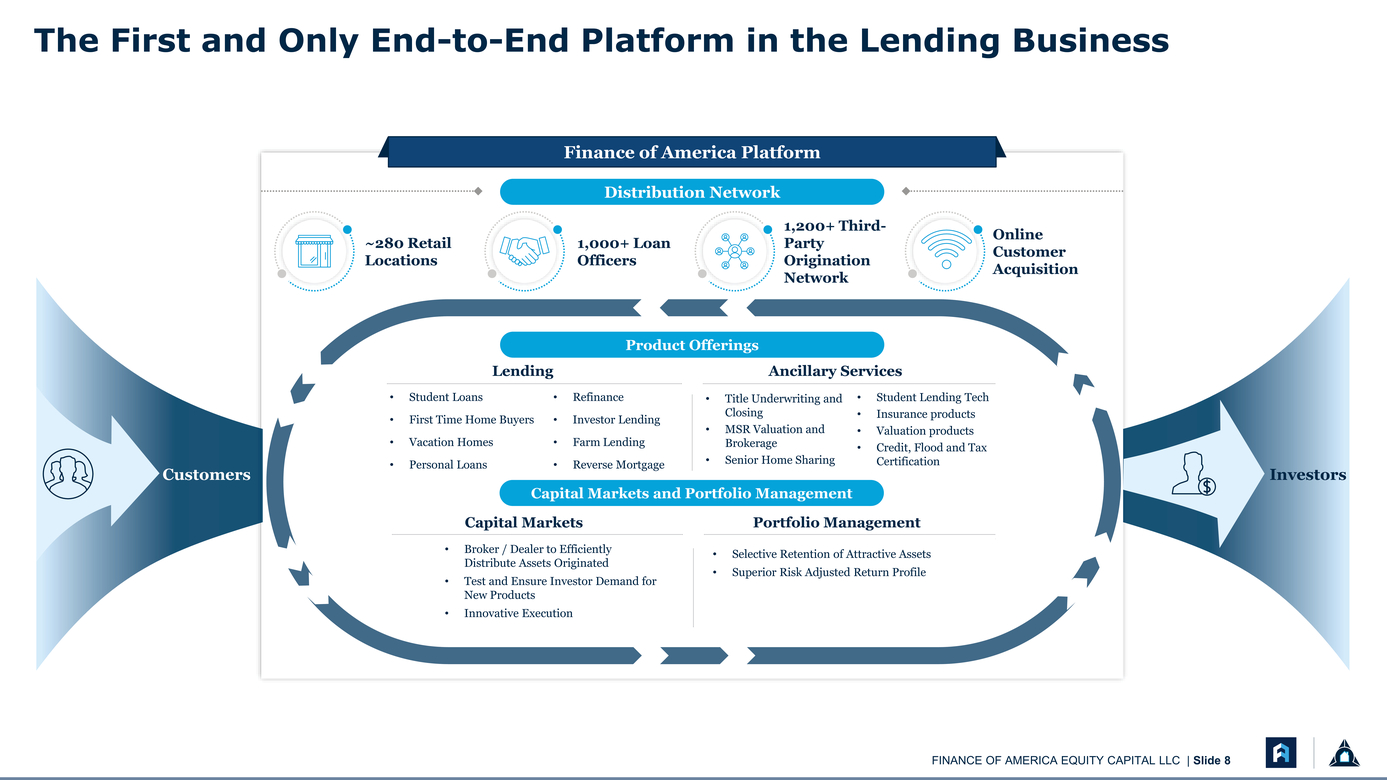 |
Finance of America Platform ~280 Retail Locations Distribution Network 1,000+ Loan Officers 1,200+ Third-Party Origination Network Online Customer Acquisition Product Offerings LendingAncillary Services Customers Student Loans First Time Home Buyers Vacation Homes Personal Loans Refinance Investor Lending Farm Lending Reverse Mortgage Title Underwriting and Closing MSR Valuation and Brokerage Senior Home Sharing Student Lending Tech Insurance products Valuation products Credit, Flood and Tax Certification Investors Capital Markets and Portfolio Management Capital Markets Broker / Dealer to Efficiently Distribute Assets Originated Test and Ensure Investor Demand for New Products Innovative Execution Portfolio Management Selective Retention of Attractive Assets Superior Risk Adjusted Return Profile |
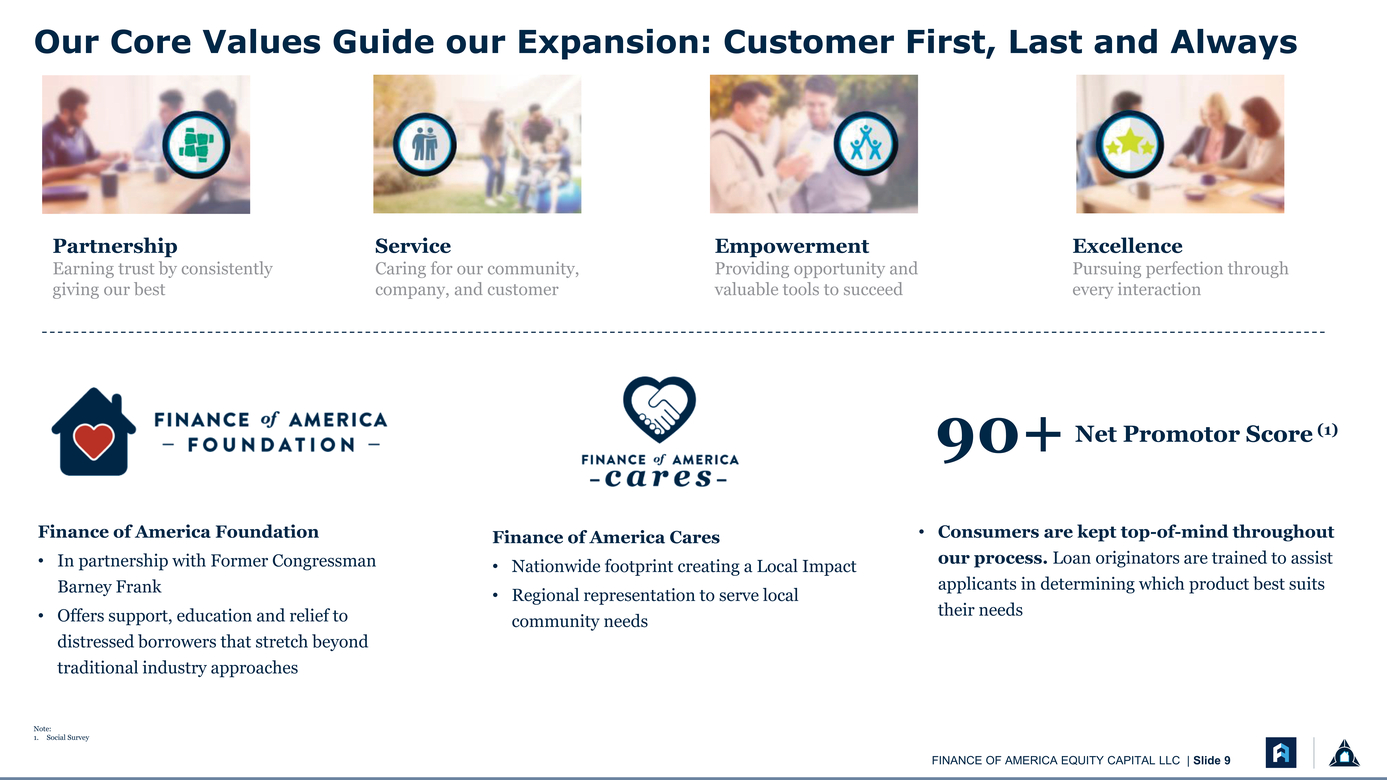 |
Partnership Earning trust by consistently giving our best Service Caring for our community, company, and customer Empowerment Providing opportunity and valuable tools to succeed Excellence Pursuing perfection through every interaction 90+ Net Promotor Score (1) Finance of America Foundation In partnership with Former Congressman Barney Frank Offers support, education and relief to distressed borrowers that stretch beyond traditional industry approaches Finance of America Cares Nationwide footprint creating a Local Impact Regional representation to serve local community needs Consumers are kept top-of-mind throughout our process. Loan originators are trained to assist applicants in determining which product best suits their needs Note: Social Survey |
 |
2 Highly Differentiated Company |
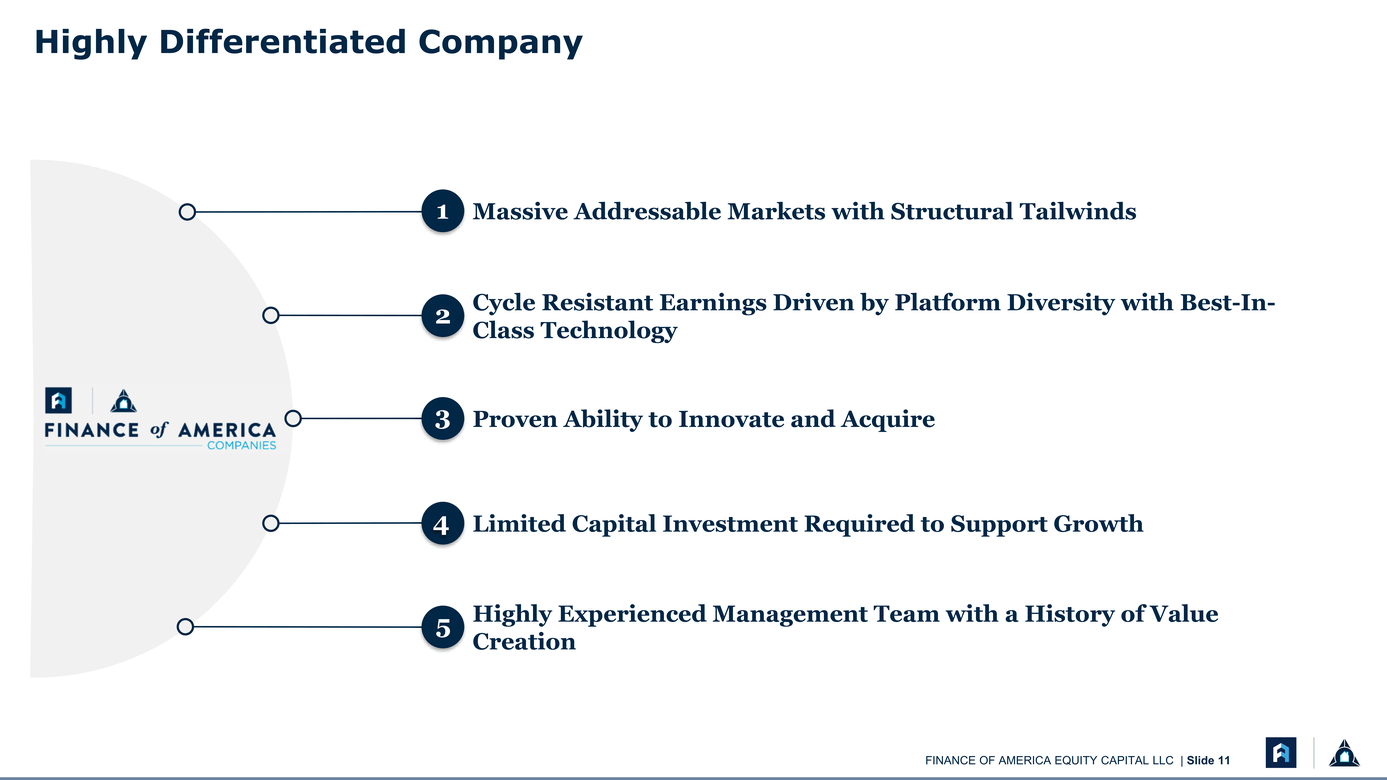 |
Massive Addressable Markets with Structural Tailwinds Cycle Resistant Earnings Driven by Platform Diversity with Best-In-Class Technology Proven Ability to Innovate and Acquire Limited Capital Investment Required to Support Growth Highly Experienced Management Team with a History of Value Creation |
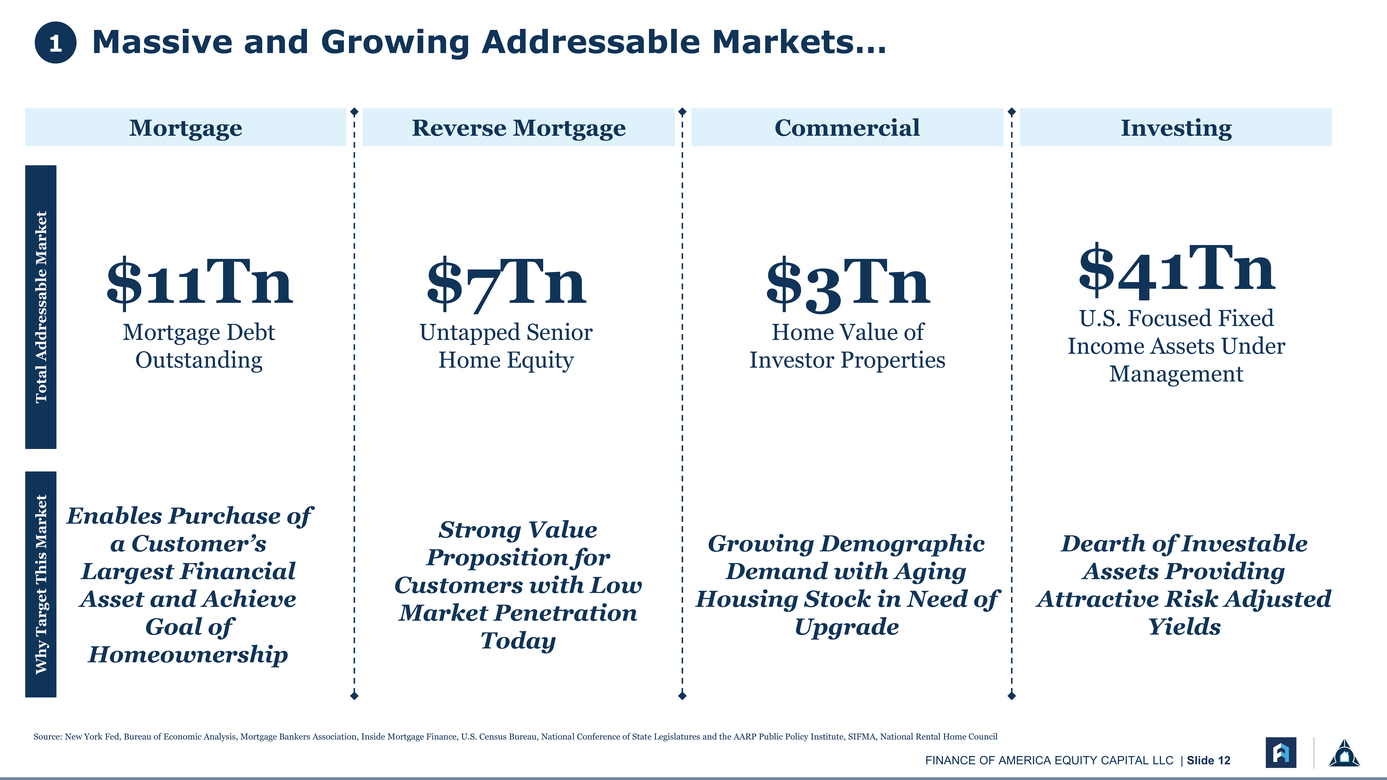 |
1Massive and Growing Addressable Markets… Mortgage Reverse Mortgage CommercialInvesting Total Addressable Market $7Tn Untapped Senior Home Equity $3Tn Home Value of Investor Properties $41Tn U.S. Focused Fixed Income Assets Under Management Why Target This Market Strong Value Proposition for Customers with Low Market Penetration Today Growing Demographic Demand with Aging Housing Stock in Need of Upgrade Dearth of Investable Assets Providing Attractive Risk Adjusted Yields Source: New York Fed, Bureau of Economic Analysis, Mortgage Bankers Association, Inside Mortgage Finance, U.S. Census Bureau, National Conference of State Legislatures and the AARP Public Policy Institute, SIFMA, National Rental Home Council |
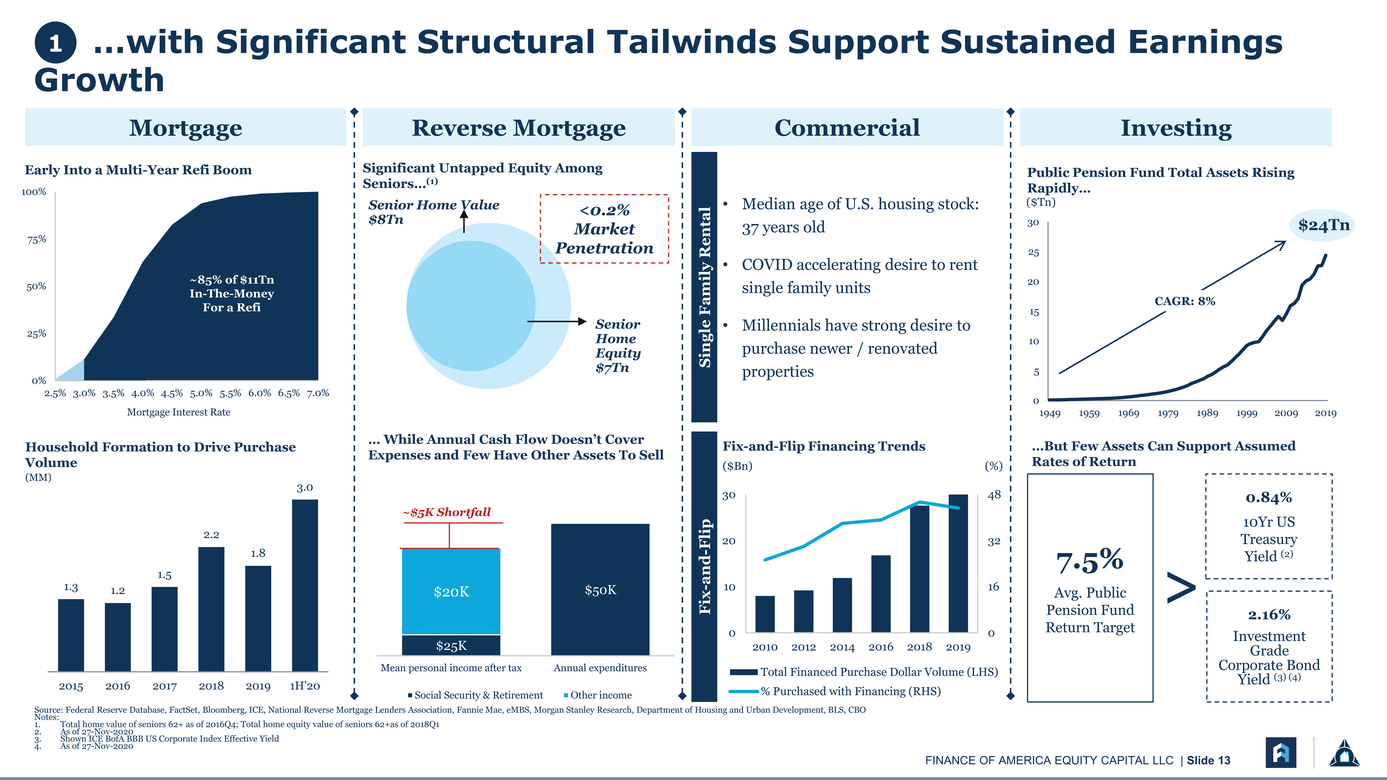 |
1…with Significant Structural Tailwinds Support Sustained Earnings Growth Mortgage Reverse Mortgage CommercialInvesting Early Into a Multi-Year Refi Boom 100% Significant Untapped Equity Among Seniors…(1) Public Pension Fund Total Assets Rising Rapidly… 75% 50% 25% 0% ~85% of $11Tn In-The-Money For a Refi Senior Home Value $8Tn <0.2% Market Penetration Senior Home Equity $7Tn Median age of U.S. housing stock: Single Family Rental COVID accelerating desire to rent single family units Millennials have strong desire to purchase newer / renovated properties ($Tn) 30 25 20 15 10 5 CAGR: 8% $24Tn 2.5% 3.0% 3.5% 4.0% 4.5% 5.0% 5.5% 6.0% 6.5% 7.0% Mortgage Interest Rate 0 19491959196919791989199920092019 Household Formation to Drive Purchase Volume (MM) … While Annual Cash Flow Doesn’t Cover Expenses and Few Have Other Assets To Sell Fix-and-Flip Financing Trends ($Bn)(%) …But Few Assets Can Support Assumed Rates of Return 1.31.2 1.5 2.2 1.8 3.0 ~$5K Shortfall $20K $25K $50K 3048 Fix-and-Flip 1016 00 2010 2012 2014 2016 2018 2019 > Avg. Public Pension Fund Return Target 0.84% 10Yr US Treasury Yield (2) 2.16% Investment Grade 201520162017201820191H'20 Mean personal income after taxAnnual expenditures Social Security & RetirementOther income Total Financed Purchase Dollar Volume (LHS) % Purchased with Financing (RHS) Corporate Bond Yield (3) (4) Source: Federal Reserve Database, FactSet, Bloomberg, ICE, National Reverse Mortgage Lenders Association, Fannie Mae, eMBS, Morgan Stanley Research, Department of Housing and Urban Development, BLS, CBO Notes: Total home value of seniors 62+ as of 2016Q4; Total home equity value of seniors 62+as of 2018Q1 As of 27-Nov-2020 Shown ICE BofA BBB US Corporate Index Effective Yield 4.As of 27-Nov-2020 |
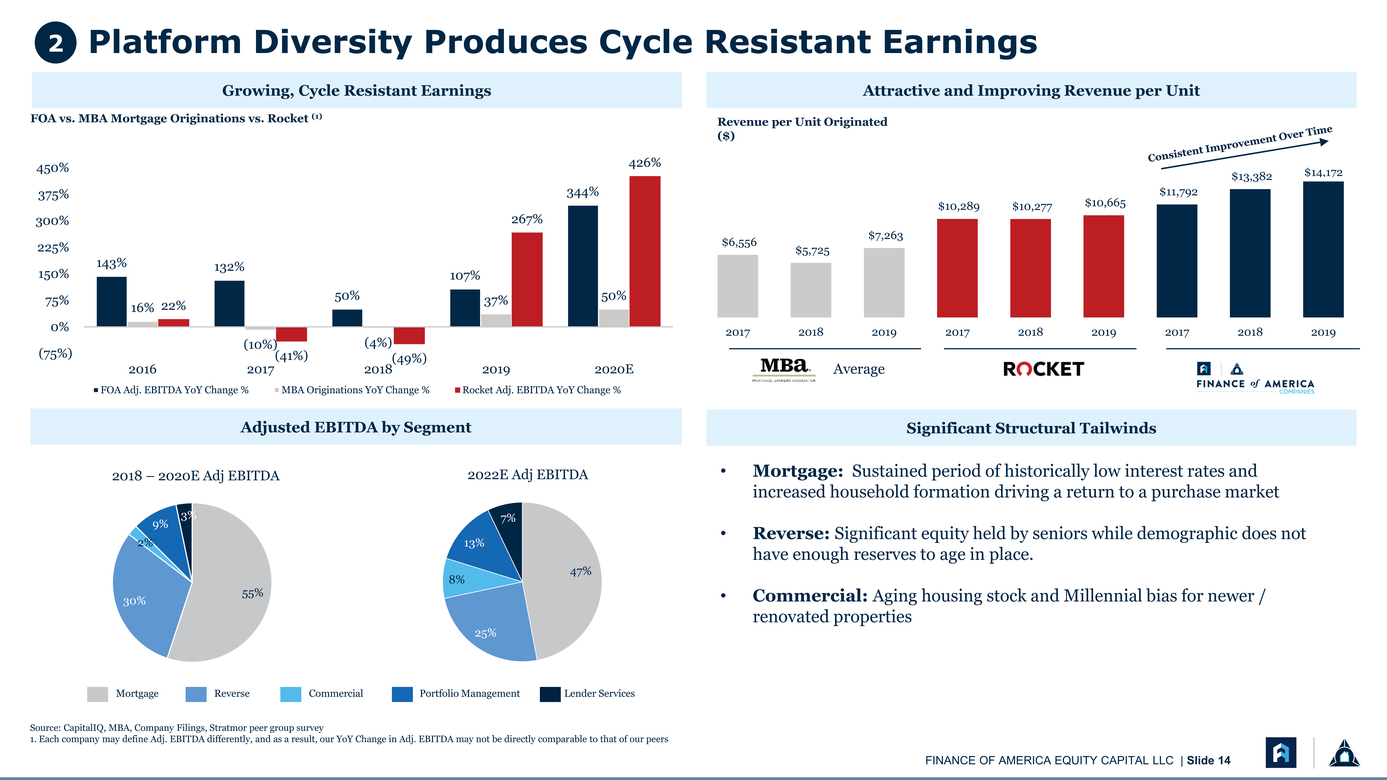 |
2Platform Diversity Produces Cycle Resistant Earnings Growing, Cycle Resistant Earnings FOA vs. MBA Mortgage Originations vs. Rocket (1) 450% 426% Attractive and Improving Revenue per Unit Revenue per Unit Originated ($) $13,382$14,172 375% 300% 225% 150% 143%132% 107% 267% 344% $6,556 $5,725 $7,263 $10,289$10,277$10,665 $11,792 75% 0% (75%) 16% 22% 50% 2016 ( 2017 41%)(49%) 2018 20192020E Average FOA Adj. EBITDA YoY Change % MBA Originations YoY Change % Rocket Adj. EBITDA YoY Change % Adjusted EBITDA by Segment 37%50% 201720182019201720182019201720182019 Significant Structural Tailwinds 2018 – 2020E Adj EBITDA 3% 9% 2022E Adj EBITDA 7% Mortgage: Sustained period of historically low interest rates and increased household formation driving a return to a purchase market Reverse: Significant equity held by seniors while demographic does not 2% 30% 55% 13% 8% 25% 47% have enough reserves to age in place. Commercial: Aging housing stock and Millennial bias for newer / renovated properties MortgageReverseCommercialPortfolio ManagementLender Services Source: CapitalIQ, MBA, Company Filings, Stratmor peer group survey Each company may define Adj. EBITDA differently, and as a result, our YoY Change in Adj. EBITDA may not be directly comparable to that of our peers |
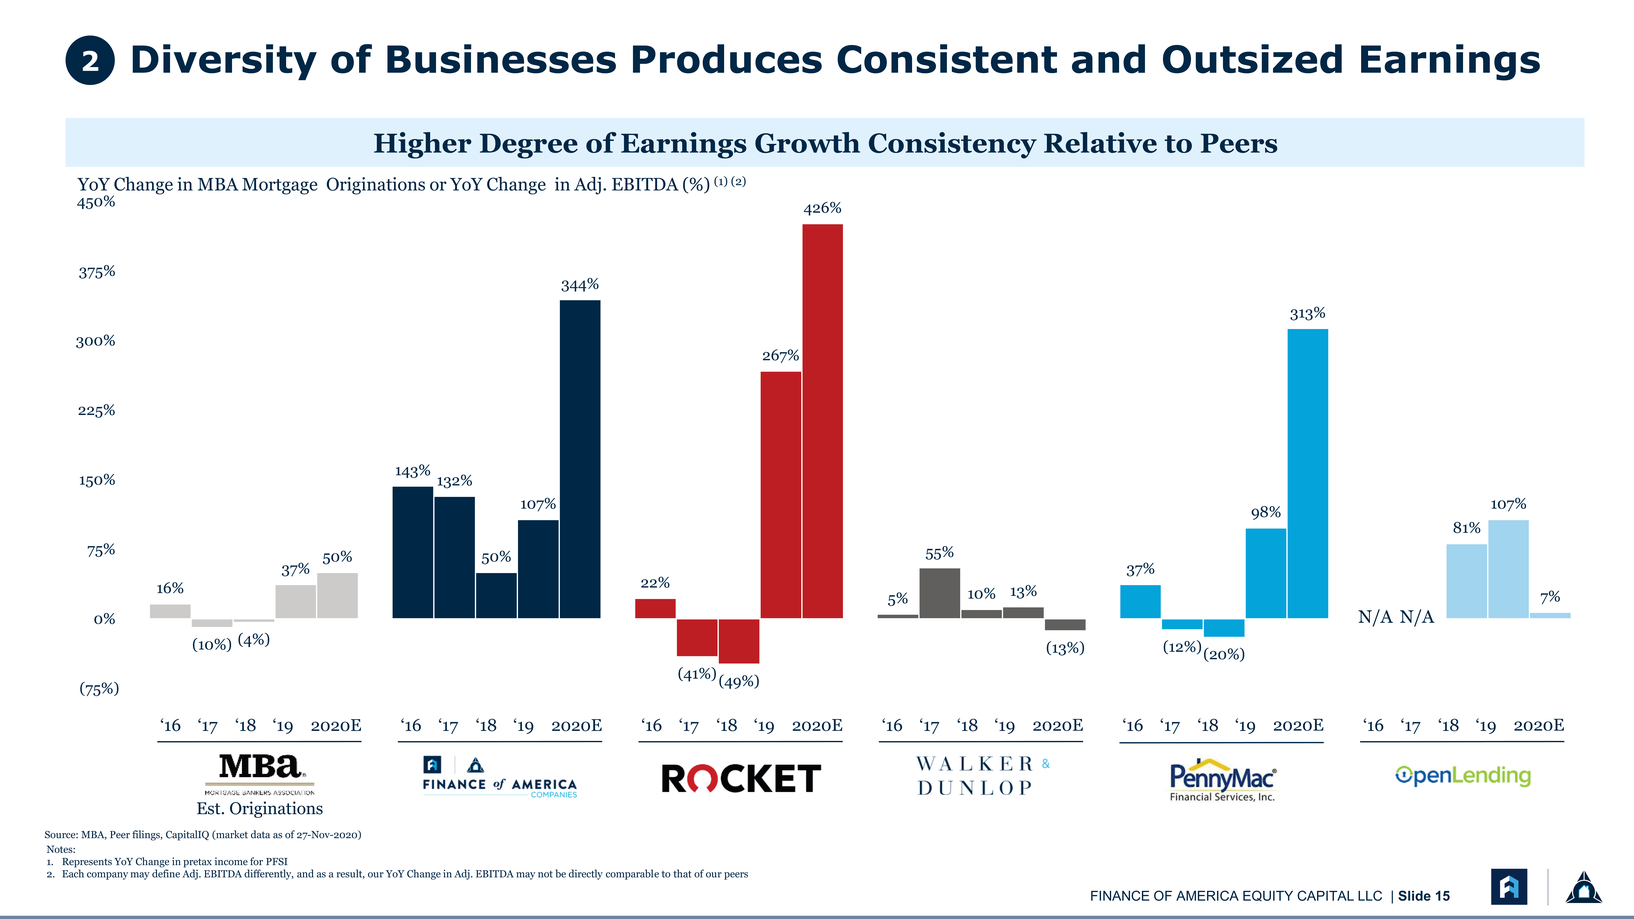 |
Diversity of Businesses Produces Consistent and Outsized Earnings Higher Degree of Earnings Growth Consistency Relative to Peers YoY Change in MBA Mortgage Originations or YoY Change in Adj. EBITDA (%) (1) (2) 450% 426% 375% 300% 344% 267% 313% 107% 50% 150% 143% 132% 98%107% 81% 0% (75%) (10%) (4%) 37% (41%) (49%) 5%10% 13% (13%) 37% (12%)(20%) 7% N/A N/A ‘16 ‘17‘18 ‘19 2020E Est. Originations ‘16 ‘17‘18 ‘19 2020E‘16 ‘17‘18 ‘19 2020E‘16 ‘17‘18 ‘19 2020E‘16 ‘17‘18 ‘19 2020E‘16 ‘17‘18 ‘19 2020E Source: MBA, Peer filings, CapitalIQ (market data as of 27-Nov-2020) Notes: Represents YoY Change in pretax income for PFSI Each company may define Adj. EBITDA differently, and as a result, our YoY Change in Adj. EBITDA may not be directly comparable to that of our peers |
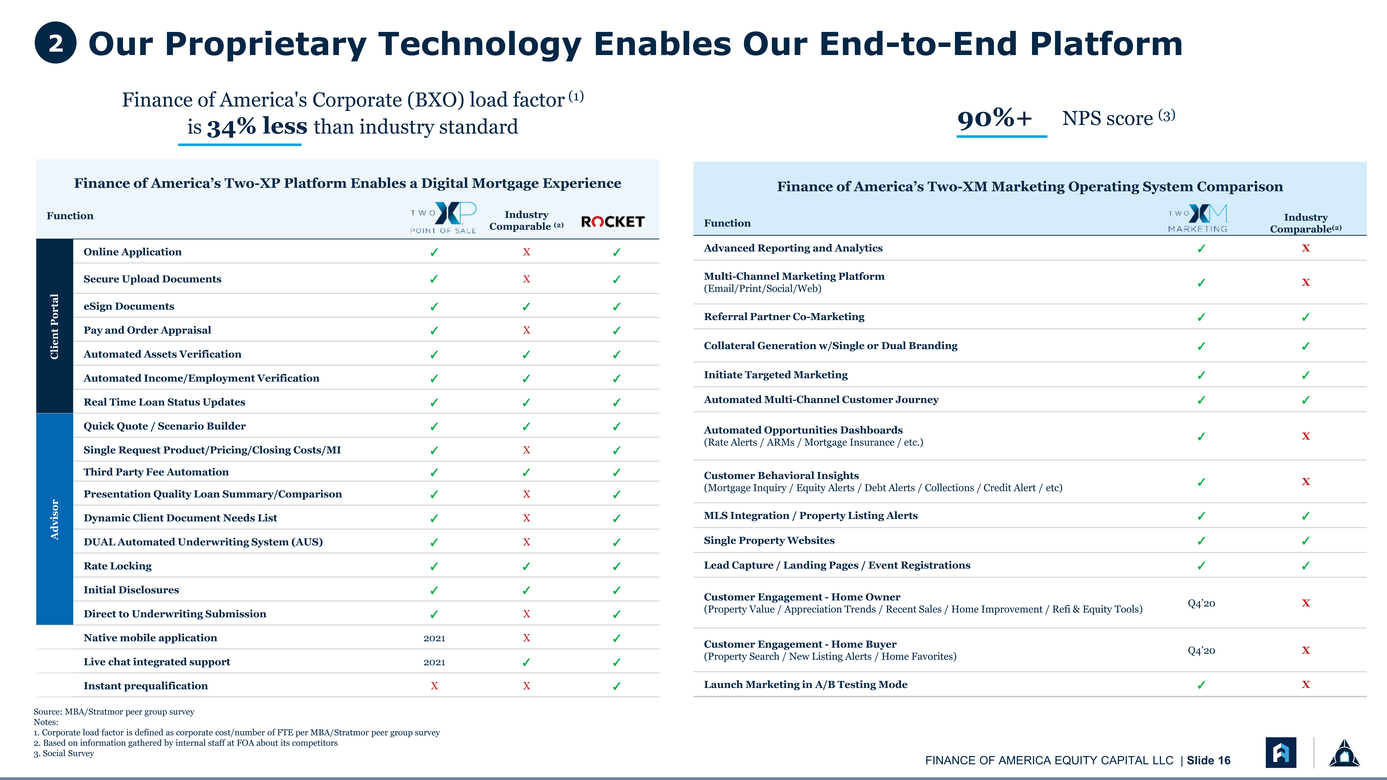 |
Finance of America's Corporate (BXO) load factor (1) is 34% less than industry standard 90%+ NPS score (3) Finance of America’s Two-XM Marketing Operating System Comparison Function Industry Comparable(2) Advanced Reporting and Analytics ✓ X Multi-Channel Marketing Platform (Email/Print/Social/Web) ✓ X Referral Partner Co-Marketing ✓ ✓ Collateral Generation w/Single or Dual Branding ✓ ✓ Initiate Targeted Marketing ✓ ✓ Automated Multi-Channel Customer Journey ✓ ✓ Automated Opportunities Dashboards (Rate Alerts / ARMs / Mortgage Insurance / etc.) ✓ X Customer Behavioral Insights (Mortgage Inquiry / Equity Alerts / Debt Alerts / Collections / Credit Alert / etc) ✓ X MLS Integration / Property Listing Alerts ✓ ✓ Single Property Websites ✓ ✓ Lead Capture / Landing Pages / Event Registrations ✓ ✓ Customer Engagement - Home Owner (Property Value / Appreciation Trends / Recent Sales / Home Improvement / Refi & Equity Tools) Q4’20 X Customer Engagement - Home Buyer (Property Search / New Listing Alerts / Home Favorites) Q4’20 X Launch Marketing in A/B Testing Mode ✓ X Source: MBA/Stratmor peer group survey Notes: Corporate load factor is defined as corporate cost/number of FTE per MBA/Stratmor peer group survey Based on information gathered by internal staff at FOA about its competitors Social Survey |
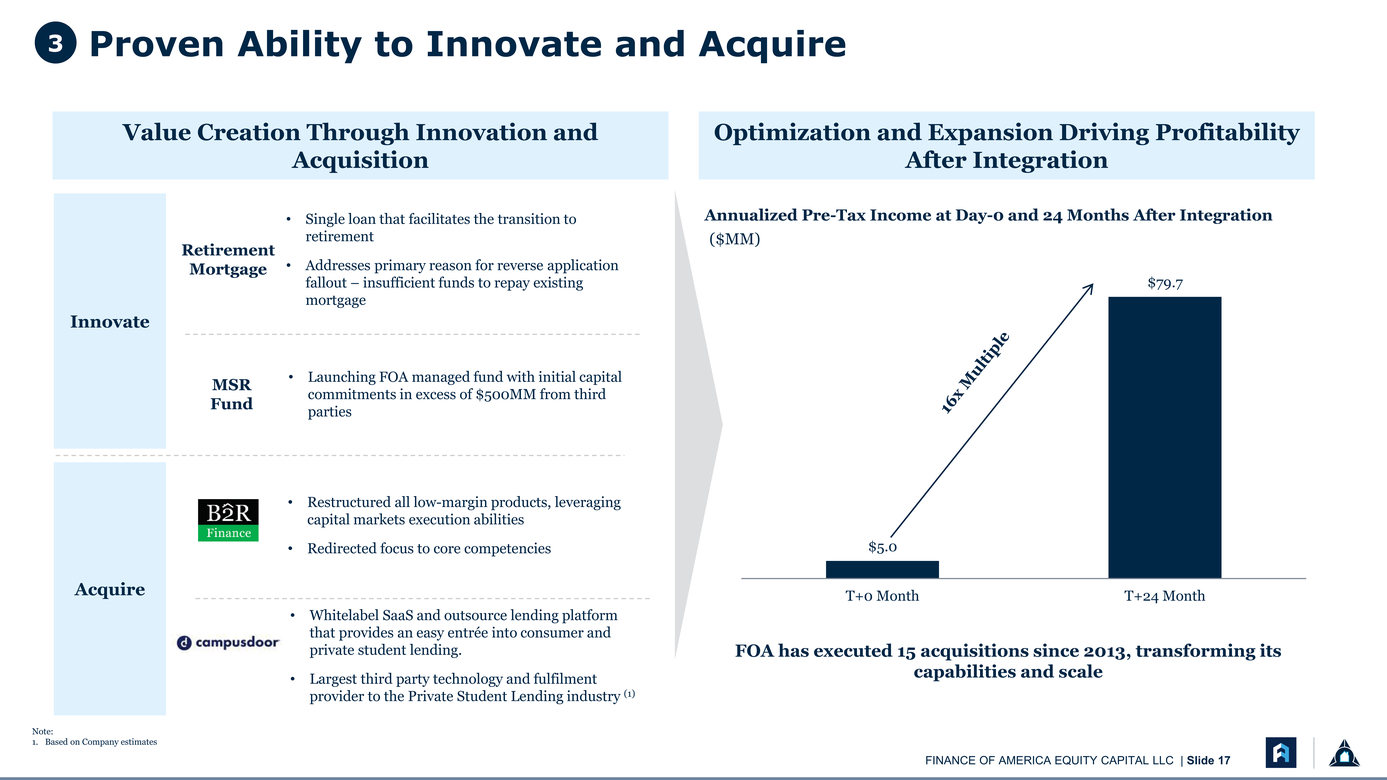 |
Value Creation Through Innovation and Acquisition Optimization and Expansion Driving Profitability After Integration Innovate Retirement Mortgage Single loan that facilitates the transition to retirement Addresses primary reason for reverse application fallout – insufficient funds to repay existing mortgage Annualized Pre-Tax Income at Day-0 and 24 Months After Integration ($MM) $79.7 MSR Fund Launching FOA managed fund with initial capital commitments in excess of $500MM from third parties Restructured all low-margin products, leveraging capital markets execution abilities Redirected focus to core competencies $5.0 Acquire Whitelabel SaaS and outsource lending platform that provides an easy entrée into consumer and private student lending. Largest third party technology and fulfilment provider to the Private Student Lending industry (1) T+0 MonthT+24 Month FOA has executed 15 acquisitions since 2013, transforming its capabilities and scale Note: 1. Based on Company estimates |
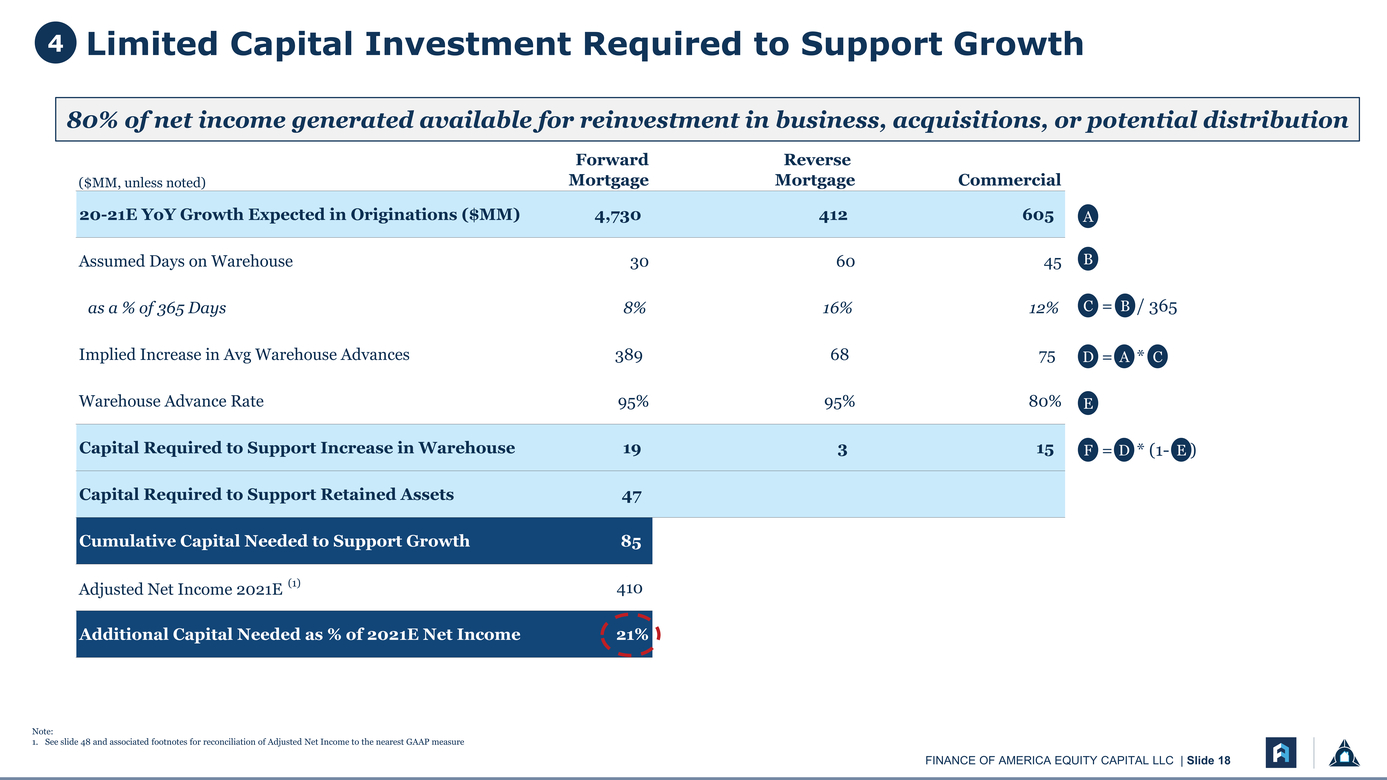 |
Capital Required to Support Increase in Warehouse 19 3 15 Capital Required to Support Retained Assets 47 Cumulative Capital Needed to Support Growth 85 80% of net income generated available for reinvestment in business, acquisitions, or potential distribution Note: 1. See slide 48 and associated footnotes for reconciliation of Adjusted Net Income to the nearest GAAP measure |
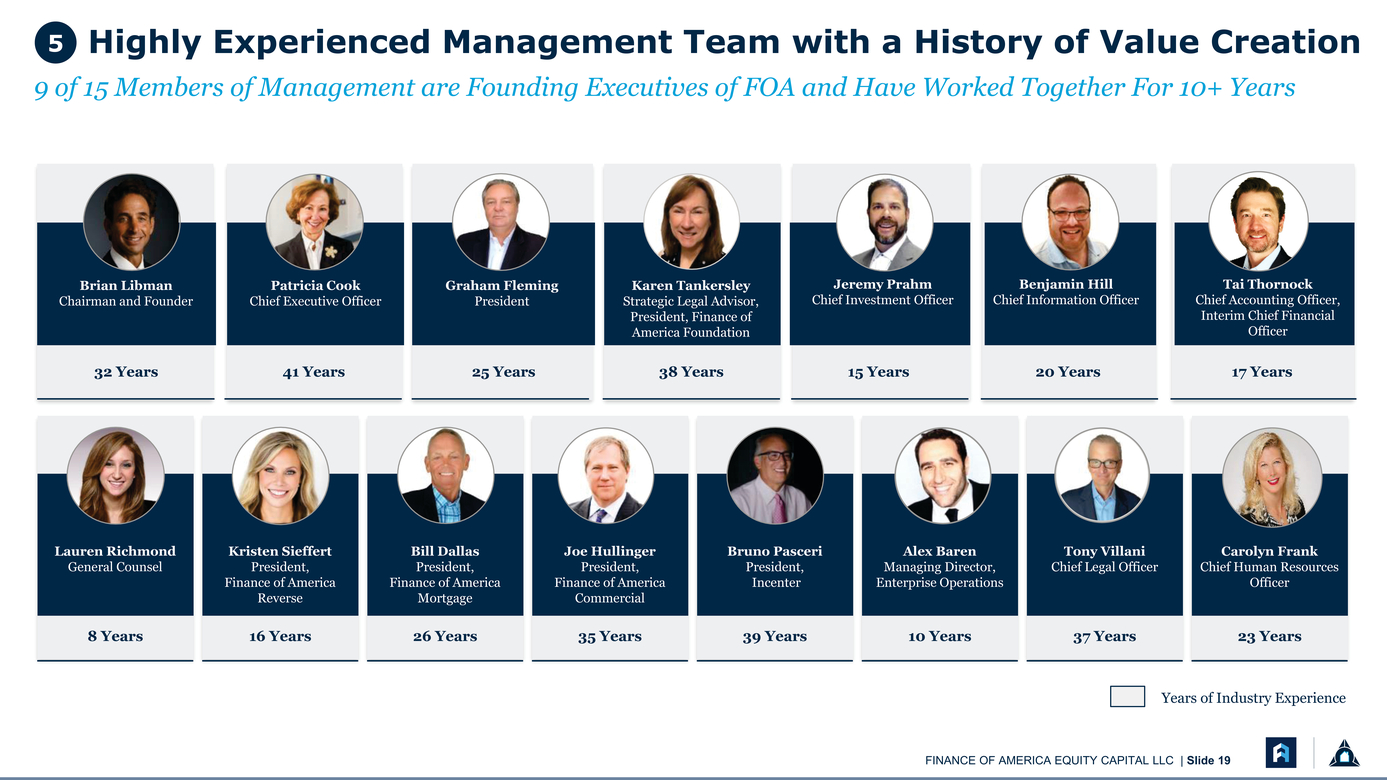 |
5Highly Experienced Management Team with a History of Value Creation 9 of 15 Members of Management are Founding Executives of FOA and Have Worked Together For 10+ Years Brian Libman Chairman and Founder Patricia Cook Chief Executive Officer Graham Fleming President Karen Tankersley Strategic Legal Advisor, President, Finance of America Foundation Jeremy Prahm Chief Investment Officer Benjamin Hill Chief Information Officer Tai Thornock Chief Accounting Officer, Interim Chief Financial Officer 32 Years 41 Years25 Years38 Years15 Years 20 Years 17 Years Lauren Richmond General Counsel Kristen Sieffert President, Finance of America Reverse Bill Dallas President, Finance of America Mortgage Joe Hullinger President, Finance of America Commercial Bruno Pasceri President, Incenter Alex Baren Managing Director, Enterprise Operations Tony Villani Chief Legal Officer Carolyn Frank Chief Human Resources Officer 8 Years 16 Years 26 Years 35 Years 39 Years 10 Years 37 Years 23 Years Years of Industry Experience |
 |
3 Business Segment Detail |
 |
Mortgage Overview |
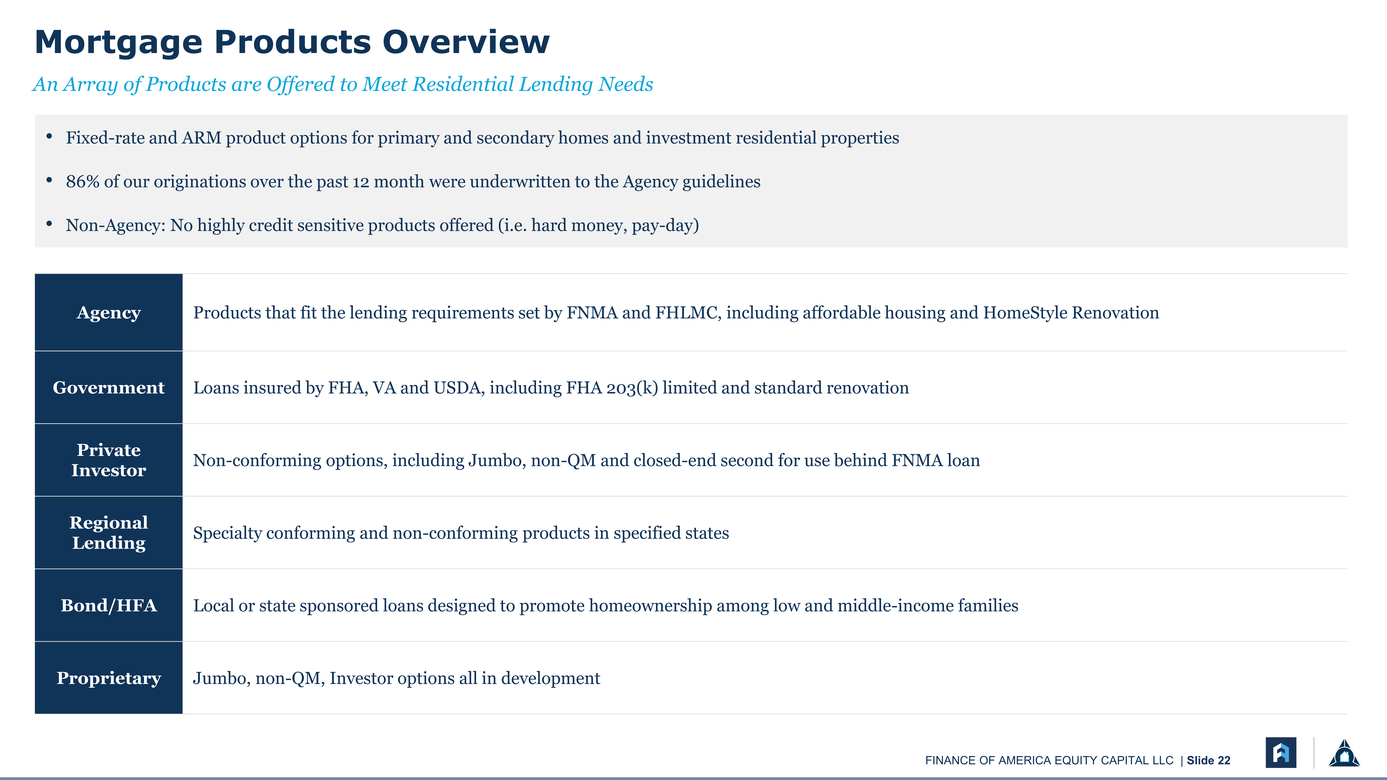 |
Mortgage Products Overview An Array of Products are Offered to Meet Residential Lending Needs Fixed-rate and ARM product options for primary and secondary homes and investment residential properties 86% of our originations over the past 12 month were underwritten to the Agency guidelines Non-Agency: No highly credit sensitive products offered (i.e. hard money, pay-day) |
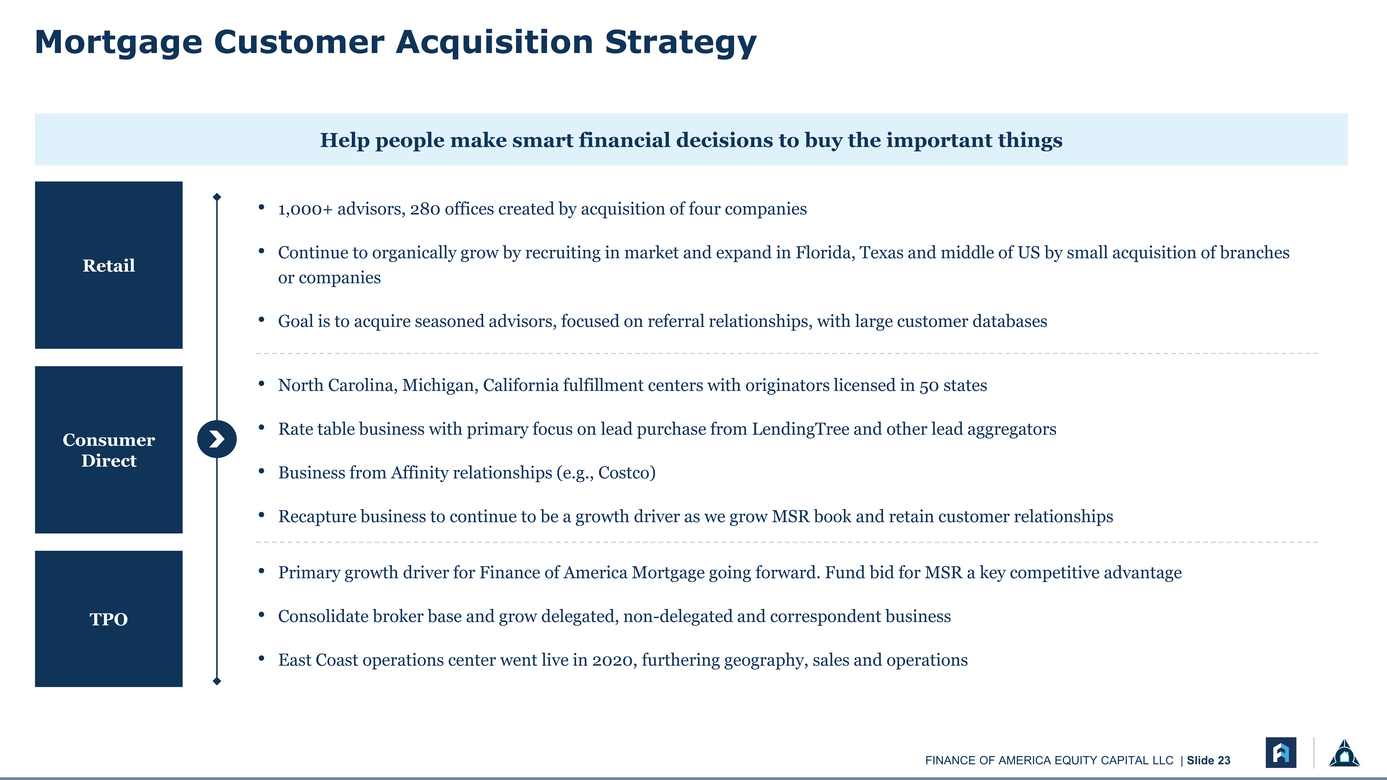 |
Help people make smart financial decisions to buy the important things 1,000+ advisors, 280 offices created by acquisition of four companies Retail Continue to organically grow by recruiting in market and expand in Florida, Texas and middle of US by small acquisition of branches or companies Goal is to acquire seasoned advisors, focused on referral relationships, with large customer databases North Carolina, Michigan, California fulfillment centers with originators licensed in 50 states Consumer Direct TPO Rate table business with primary focus on lead purchase from LendingTree and other lead aggregators Business from Affinity relationships (e.g., Costco) Recapture business to continue to be a growth driver as we grow MSR book and retain customer relationships Primary growth driver for Finance of America Mortgage going forward. Fund bid for MSR a key competitive advantage Consolidate broker base and grow delegated, non-delegated and correspondent business East Coast operations center went live in 2020, furthering geography, sales and operations |
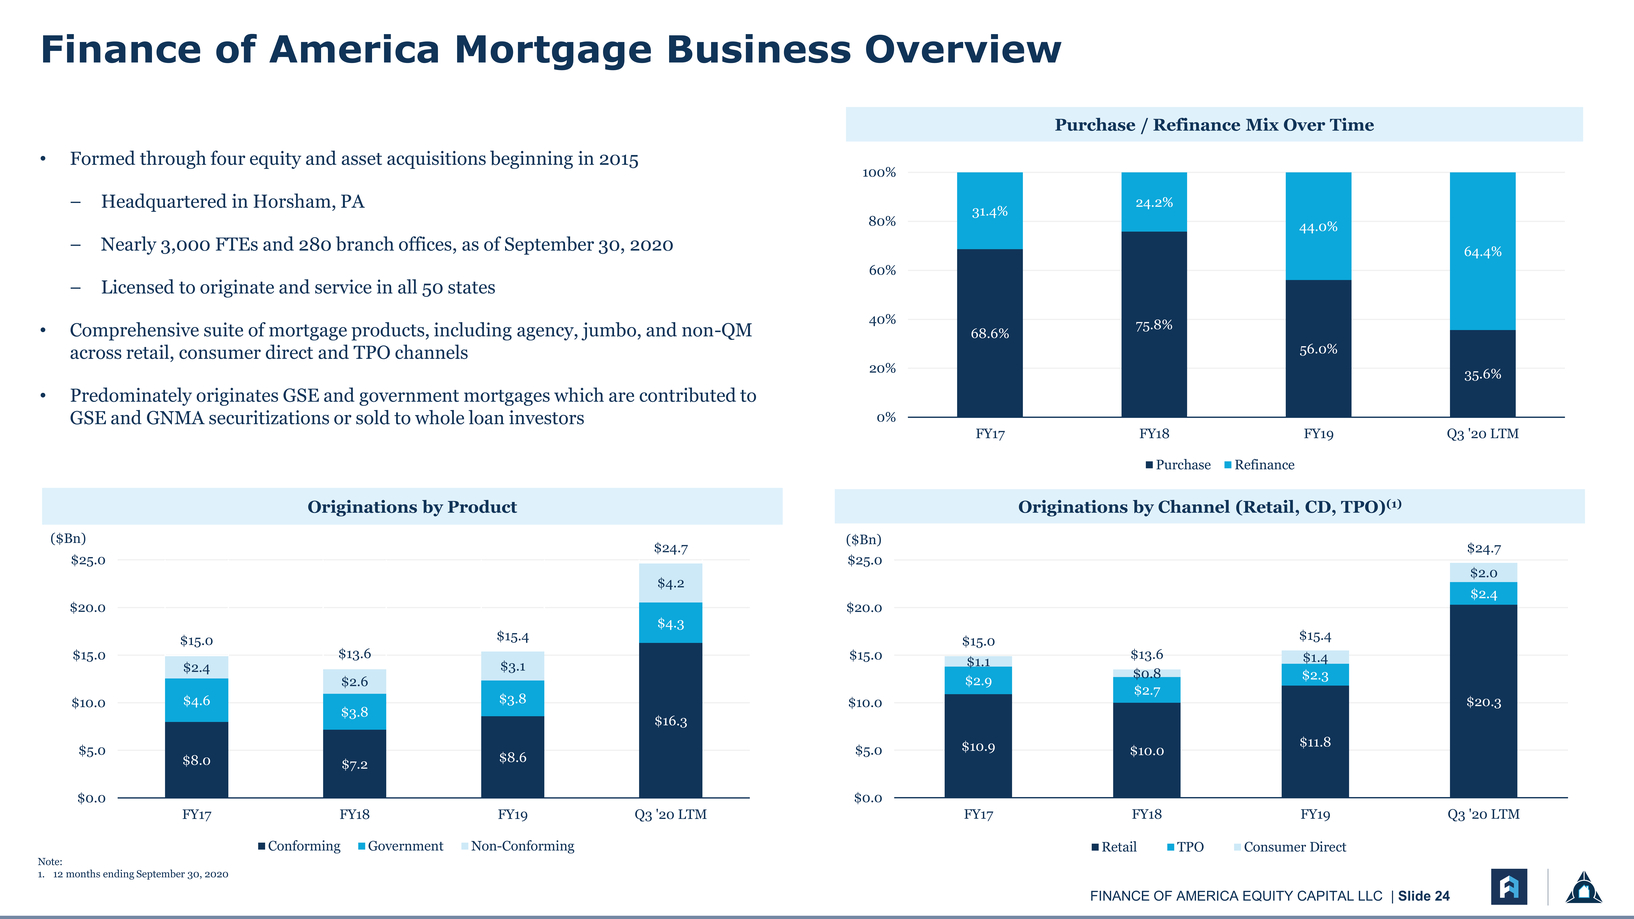 |
Formed through four equity and asset acquisitions beginning in 2015 Headquartered in Horsham, PANearly 3,000 FTEs and 280 branch offices, as of September 30, 2020 Licensed to originate and service in all 50 states Comprehensive suite of mortgage products, including agency, jumbo, and non-QM across retail, consumer direct and TPO channels Predominately originates GSE and government mortgages which are contributed to GSE and GNMA securitizations or sold to whole loan investors 100% 80% 60% 40% 20% 0% Purchase / Refinance Mix Over Time 31.4% 24.2% 44.0% 64.4% 75.8% 68.6% 56.0% 35.6% PurchaseRefinance Originations by Product Originations by Channel (Retail, CD, TPO)(1) ($Bn) $25.0 $20.0 $15.0 $10.0 $4.2 $4.3 $15.0 $13.6 $15.4 $16.3 $2.4 $3.1 $2.6 $4.6 $3.8 $3.8 $8.6 $8.0 $7.2 ($Bn) $25.0 $20.0 $15.0 $10.0 $15.0 $1.1 $2.9 $13.6 $0.8 $2.7 $15.4 $1.4 $2.3 $24.7 $2.0 $2.4 $20.3 $5.0 $5.0 $10.9$10.0$11.8 $0.0 FY17FY18FY19Q3 '20 LTM $0.0 FY17FY18FY19Q3 '20 LTM Note: 1. 12 months ending September 30, 2020 ConformingGovernmentNon-Conforming RetailTPOConsumer Direct |
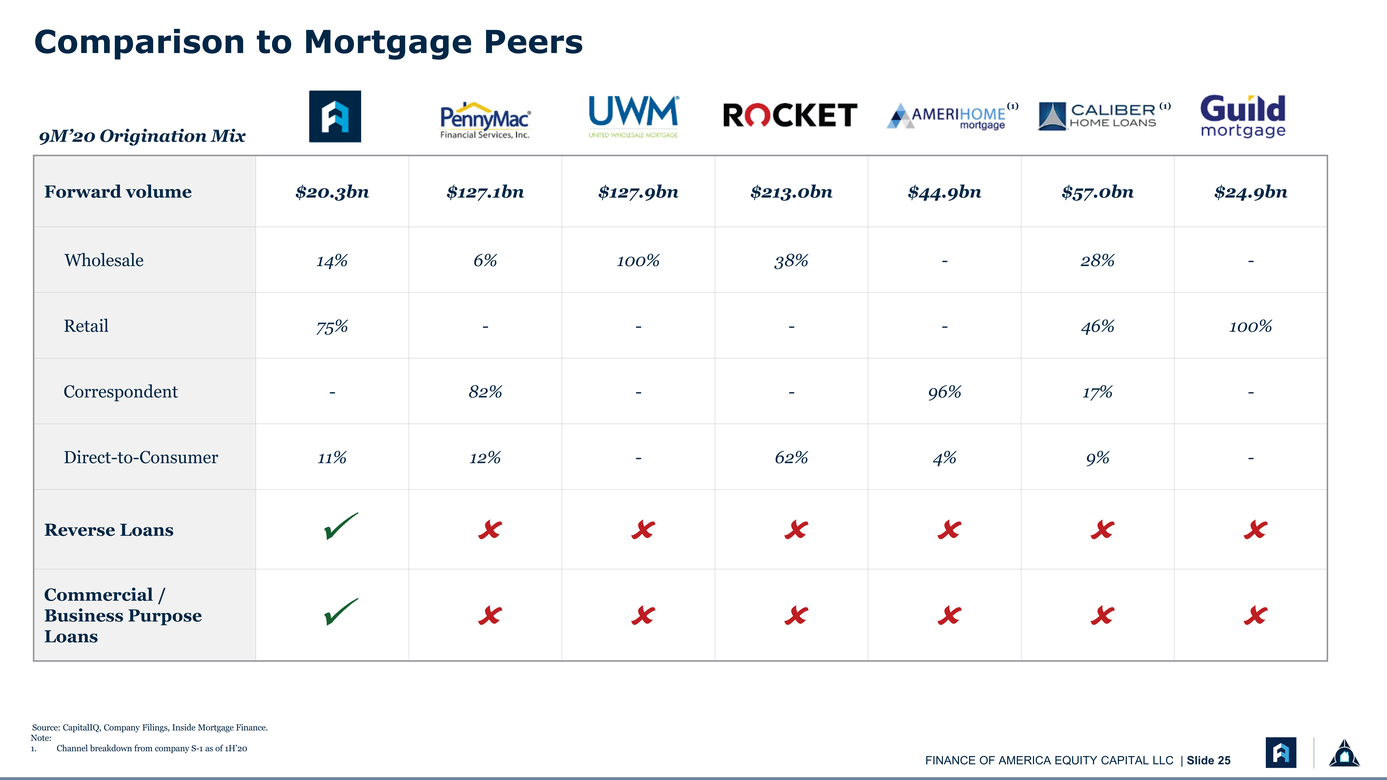 |
Forward volume $20.3bn $127.1bn $127.9bn $213.0bn $44.9bn $57.0bn $24.9bn Wholesale 14% 6% 100% 38% - 28% - Retail 75% - - - - 46% 100% Correspondent - 82% - - 96% 17% - Direct-to-Consumer 11% 12% - 62% 4% 9% - Reverse Loans Commercial / Business Purpose Loans Source: CapitalIQ, Company Filings, Inside Mortgage Finance. Note: Channel breakdown from company S-1 as of 1H’20 (1) |
 |
Reverse Mortgage Overview |
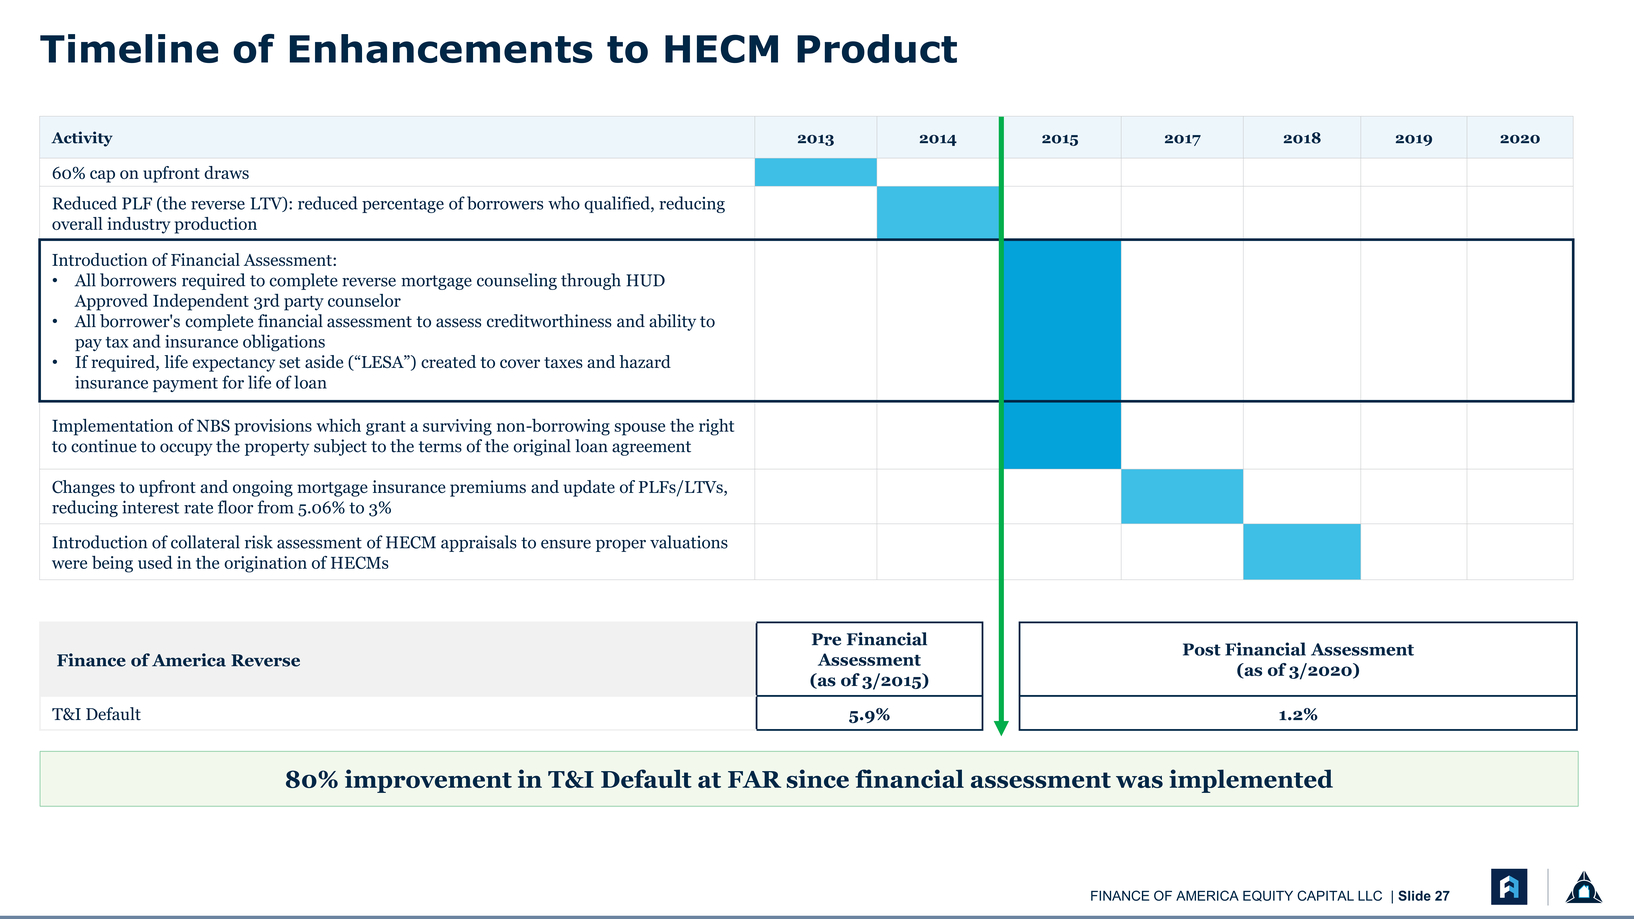 |
Timeline of Enhancements to HECM Product Finance of America Reverse Pre Financial Assessment (as of 3/2015) T&I Default 5.9% 1.2% 80% improvement in T&I Default at FAR since financial assessment was implemented |
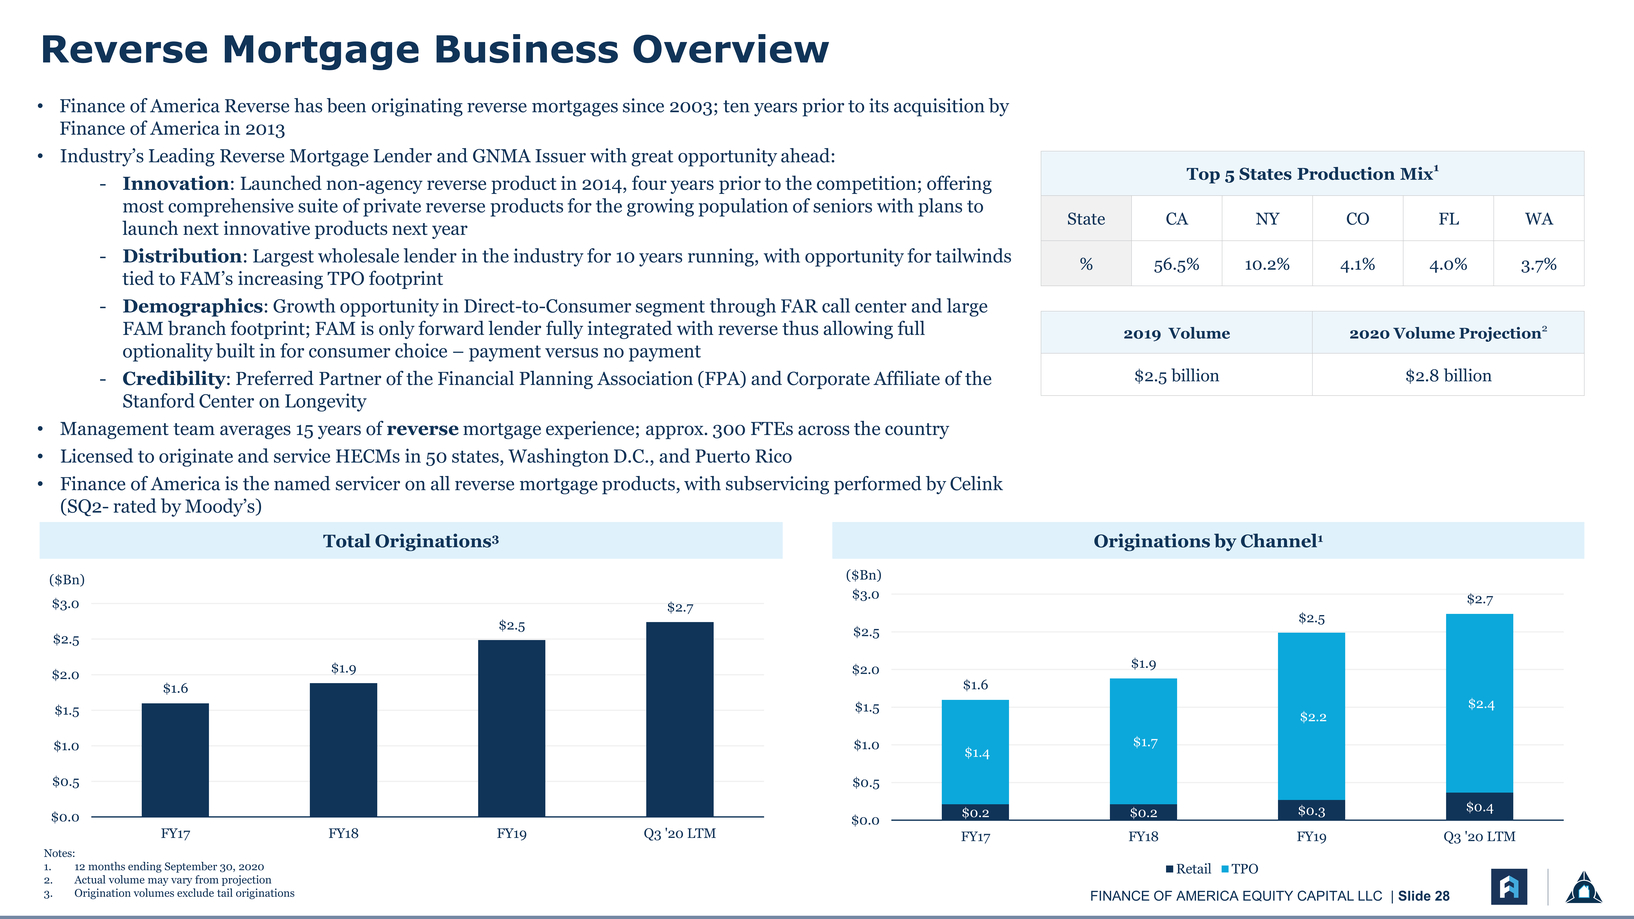 |
Reverse Mortgage Business Overview Finance of America Reverse has been originating reverse mortgages since 2003; ten years prior to its acquisition by Finance of America in 2013 Top 5 States Production Mix1 State CA NY CO FL WA % 56.5% 10.2% 4.1% 4.0% 3.7% Innovation: Launched non-agency reverse product in 2014, four years prior to the competition; offering most comprehensive suite of private reverse products for the growing population of seniors with plans to launch next innovative products next year Distribution: Largest wholesale lender in the industry for 10 years running, with opportunity for tailwinds tied to FAM’s increasing TPO footprint 2019 Volume 2020 Volume Projection2 $2.5 billion $2.8 billion Credibility: Preferred Partner of the Financial Planning Association (FPA) and Corporate Affiliate of the Stanford Center on Longevity Management team averages 15 years of reverse mortgage experience; approx. 300 FTEs across the country Licensed to originate and service HECMs in 50 states, Washington D.C., and Puerto Rico Finance of America is the named servicer on all reverse mortgage products, with subservicing performed by Celink (SQ2-rated by Moody’s) ($Bn) Total Originations3Originations by Channel1 ($Bn) $2.5 $2.0 $1.5 $1.6 $1.9 $2.5 $2.5 $2.0 $1.5 $1.6 $1.9 $2.5 $2.4 $2.2 $1.0 $1.0 $1.7 $1.4 $0.5 $0.0 Notes: FY17FY18FY19Q3 '20 LTM $0.5 $0.0 $0.2$0.2$0.3$0.4 FY17FY18FY19Q3 '20 LTM 12 months ending September 30, 2020 Actual volume may vary from projection Origination volumes exclude tail originations RetailTPO |
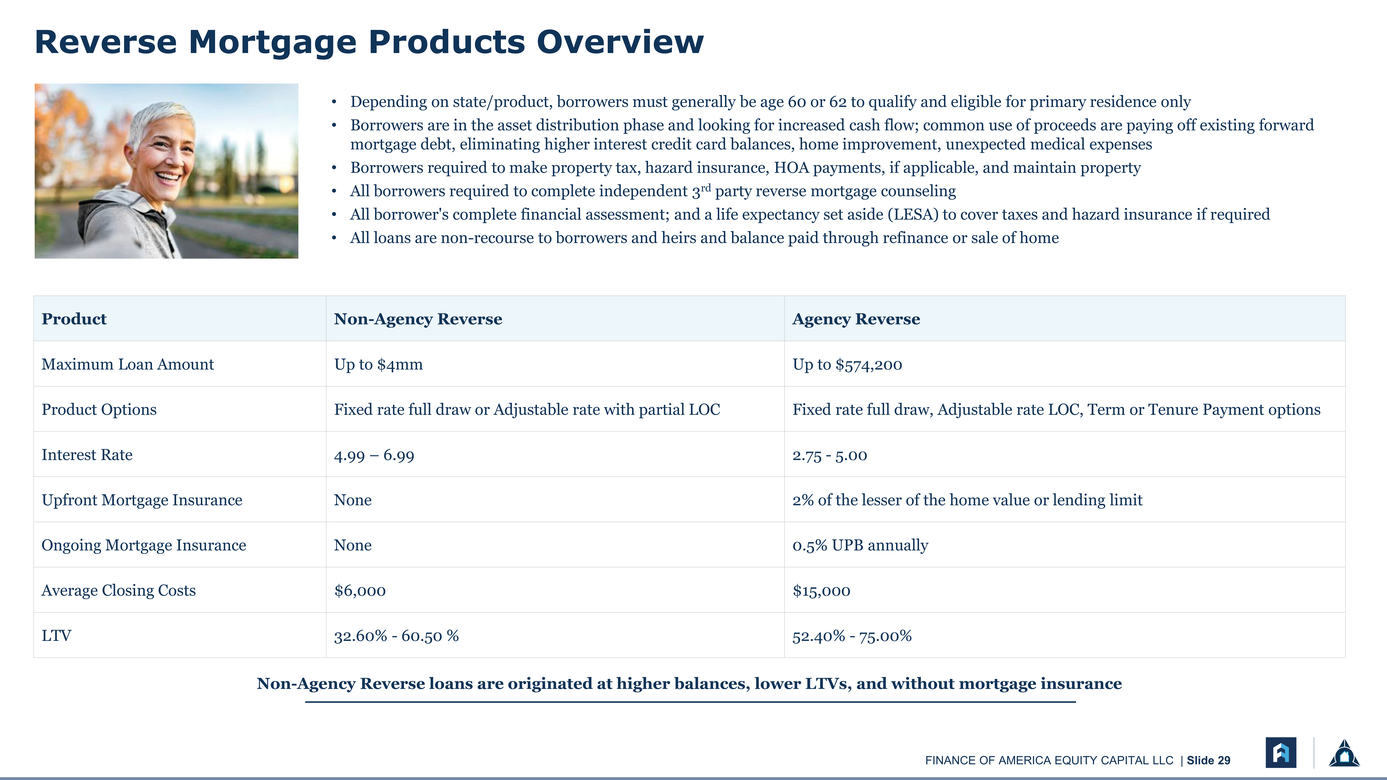 |
Reverse Mortgage Products Overview Depending on state/product, borrowers must generally be age 60 or 62 to qualify and eligible for primary residence only Borrowers are in the asset distribution phase and looking for increased cash flow; common use of proceeds are paying off existing forward mortgage debt, eliminating higher interest credit card balances, home improvement, unexpected medical expenses Borrowers required to make property tax, hazard insurance, HOA payments, if applicable, and maintain property All borrowers required to complete independent 3rd party reverse mortgage counseling All borrower's complete financial assessment; and a life expectancy set aside (LESA) to cover taxes and hazard insurance if required All loans are non-recourse to borrowers and heirs and balance paid through refinance or sale of home Non-Agency Reverse loans are originated at higher balances, lower LTVs, and without mortgage insurance |
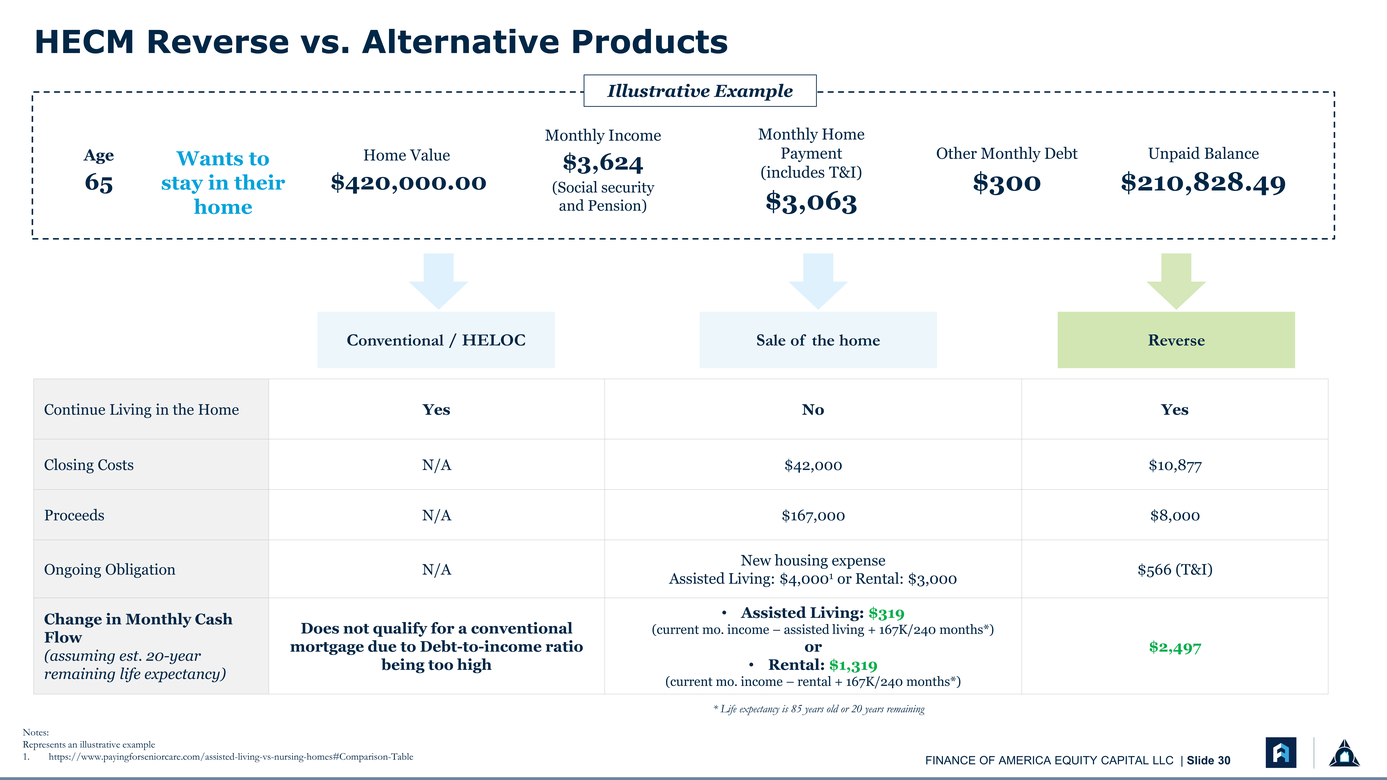 |
HECM Reverse vs. Alternative Products Illustrative Example Age 65 Wants to stay in their home Home Value $420,000.00 Monthly Income $3,624 (Social security and Pension) Monthly Home Payment (includes T&I) $3,063 Other Monthly Debt $300 Unpaid Balance $210,828.49 Conventional / HELOCSale of the homeReverse * Life expectancy is 85 years old or 20 years remaining Notes: Represents an illustrative example https://www.payingforseniorcare.com/assisted-living-vs-nursing-homes#Comparison-Table FINANCE OF AMERICA EQUITY CAPITAL LLC | Slide 30 |
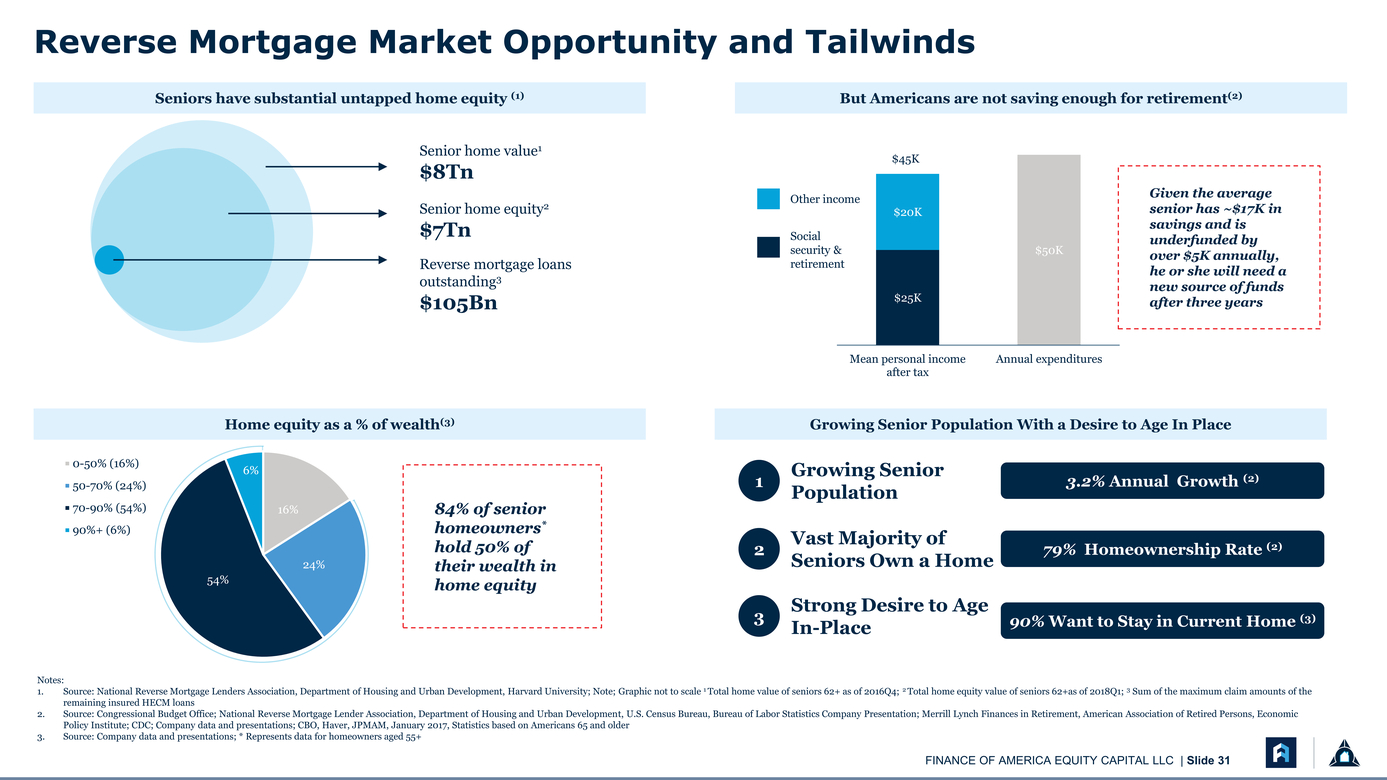 |
Reverse Mortgage Market Opportunity and Tailwinds Seniors have substantial untapped home equity (1) But Americans are not saving enough for retirement(2) $8Tn Senior home equity2 $7Tn Reverse mortgage loans outstanding3 $105Bn Other income Social security & retirement $45K $20K $25K $50K Given the average senior has ~$17K in savings and is over $5K annually, new source of funds after three years Mean personal income after tax Annual expenditures Home equity as a % of wealth(3) Growing Senior Population With a Desire to Age In Place 0-50% (16%) 50-70% (24%) 70-90% (54%) 90%+ (6%) 6% 16% 84% of senior homeowners* Growing Senior 13.2% Annual Growth (2) Population 54% 24% hold 50% of their wealth in home equity Vast Majority of Seniors Own a Home Strong Desire to Age In-Place 79% Homeownership Rate (2) 90% Want to Stay in Current Home (3) Notes: Source: National Reverse Mortgage Lenders Association, Department of Housing and Urban Development, Harvard University; Note; Graphic not to scale 1 Total home value of seniors 62+ as of 2016Q4; 2 Total home equity value of seniors 62+as of 2018Q1; 3 Sum of the maximum claim amounts of the remaining insured HECM loans Source: Congressional Budget Office; National Reverse Mortgage Lender Association, Department of Housing and Urban Development, U.S. Census Bureau, Bureau of Labor Statistics Company Presentation; Merrill Lynch Finances in Retirement, American Association of Retired Persons, Economic Policy Institute; CDC; Company data and presentations; CBO, Haver, JPMAM, January 2017, Statistics based on Americans 65 and older Source: Company data and presentations; * Represents data for homeowners aged 55+ |
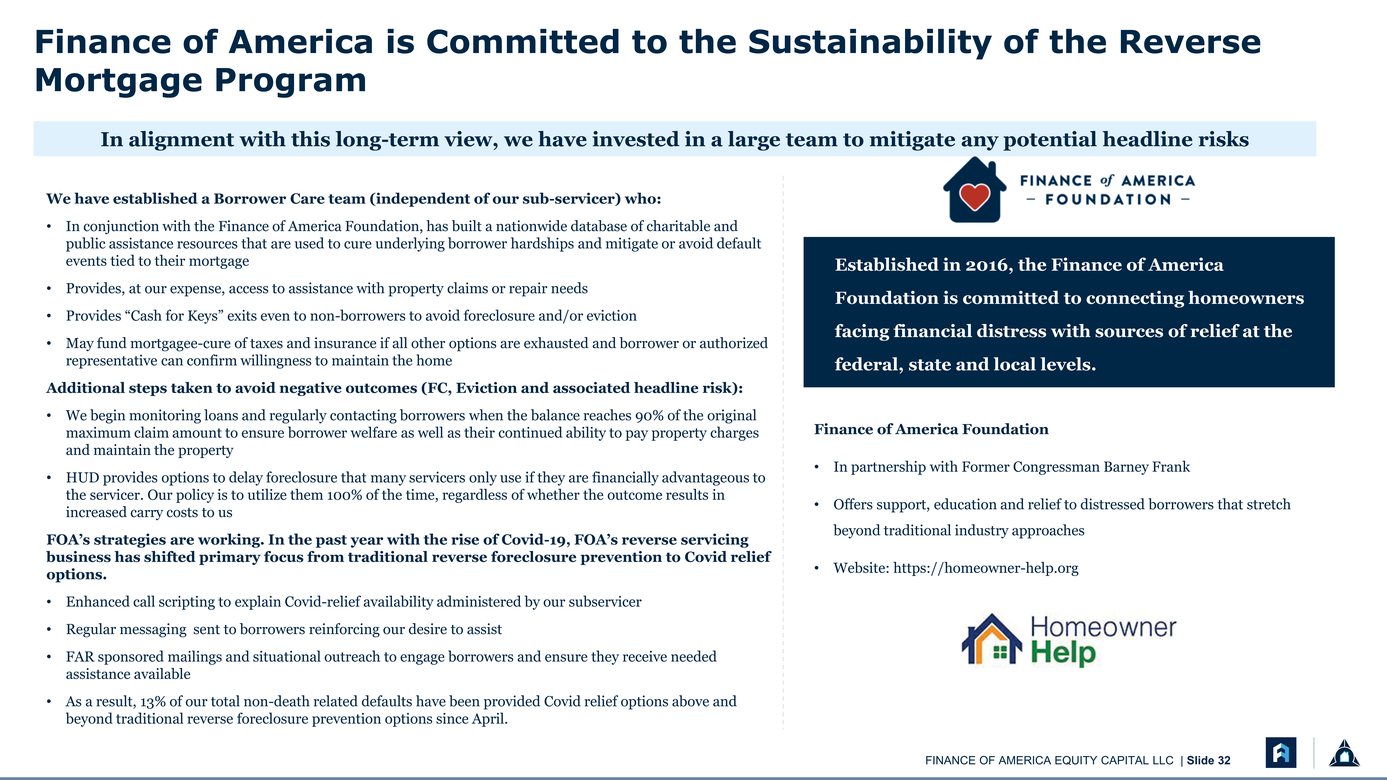 |
Finance of America is Committed to the Sustainability of the Reverse Mortgage Program In alignment with this long-term view, we have invested in a large team to mitigate any potential headline risks We have established a Borrower Care team (independent of our sub-servicer) who: In conjunction with the Finance of America Foundation, has built a nationwide database of charitable and public assistance resources that are used to cure underlying borrower hardships and mitigate or avoid default events tied to their mortgage Provides, at our expense, access to assistance with property claims or repair needs Provides “Cash for Keys” exits even to non-borrowers to avoid foreclosure and/or eviction May fund mortgagee-cure of taxes and insurance if all other options are exhausted and borrower or authorized representative can confirm willingness to maintain the home Additional steps taken to avoid negative outcomes (FC, Eviction and associated headline risk): We begin monitoring loans and regularly contacting borrowers when the balance reaches 90% of the original maximum claim amount to ensure borrower welfare as well as their continued ability to pay property charges and maintain the property HUD provides options to delay foreclosure that many servicers only use if they are financially advantageous to the servicer. Our policy is to utilize them 100% of the time, regardless of whether the outcome results in increased carry costs to us FOA’s strategies are working. In the past year with the rise of Covid-19, FOA’s reverse servicing business has shifted primary focus from traditional reverse foreclosure prevention to Covid relief options. Enhanced call scripting to explain Covid-relief availability administered by our subservicer Regular messaging sent to borrowers reinforcing our desire to assist FAR sponsored mailings and situational outreach to engage borrowers and ensure they receive needed assistance available As a result, 13% of our total non-death related defaults have been provided Covid relief options above and beyond traditional reverse foreclosure prevention options since April. Established in 2016, the Finance of America Foundation is committed to connecting homeowners facing financial distress with sources of relief at the federal, state and local levels. Finance of America Foundation In partnership with Former Congressman Barney Frank Offers support, education and relief to distressed borrowers that stretch beyond traditional industry approaches Website: https://homeowner-help.org |
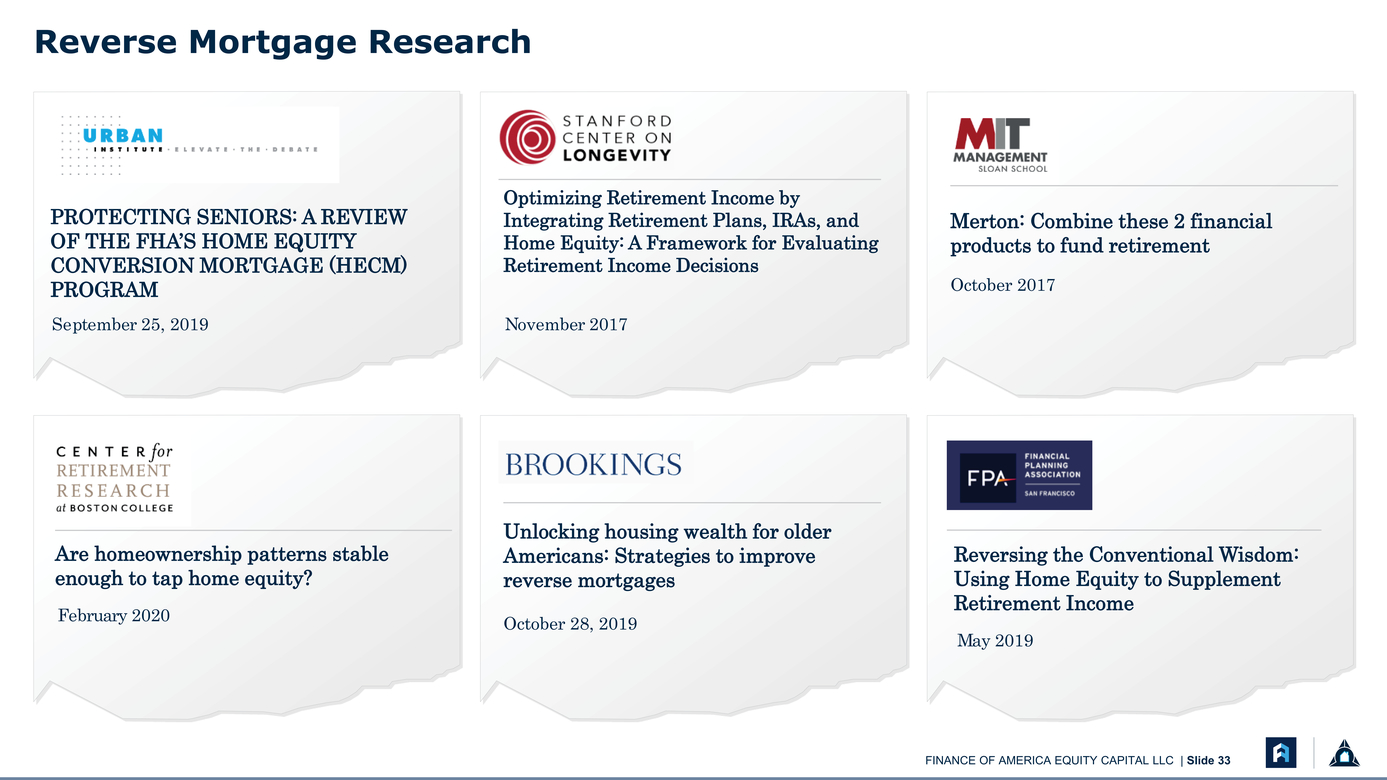 |
Reverse Mortgage Research PROTECTING SENIORS: A REVIEW OF THE FHA’S HOME EQUITY CONVERSION MORTGAGE (HECM) PROGRAM September 25, 2019 Optimizing Retirement Income by Integrating Retirement Plans, IRAs, and Home Equity: A Framework for Evaluating Retirement Income Decisions November 2017 Merton: Combine these 2 financial products to fund retirement October 2017 Are homeownership patterns stable enough to tap home equity? February 2020 Unlocking housing wealth for older Americans: Strategies to improve reverse mortgages October 28, 2019 Reversing the Conventional Wisdom: Using Home Equity to Supplement Retirement Income May 2019 |
 |
Commercial Lending Overview |
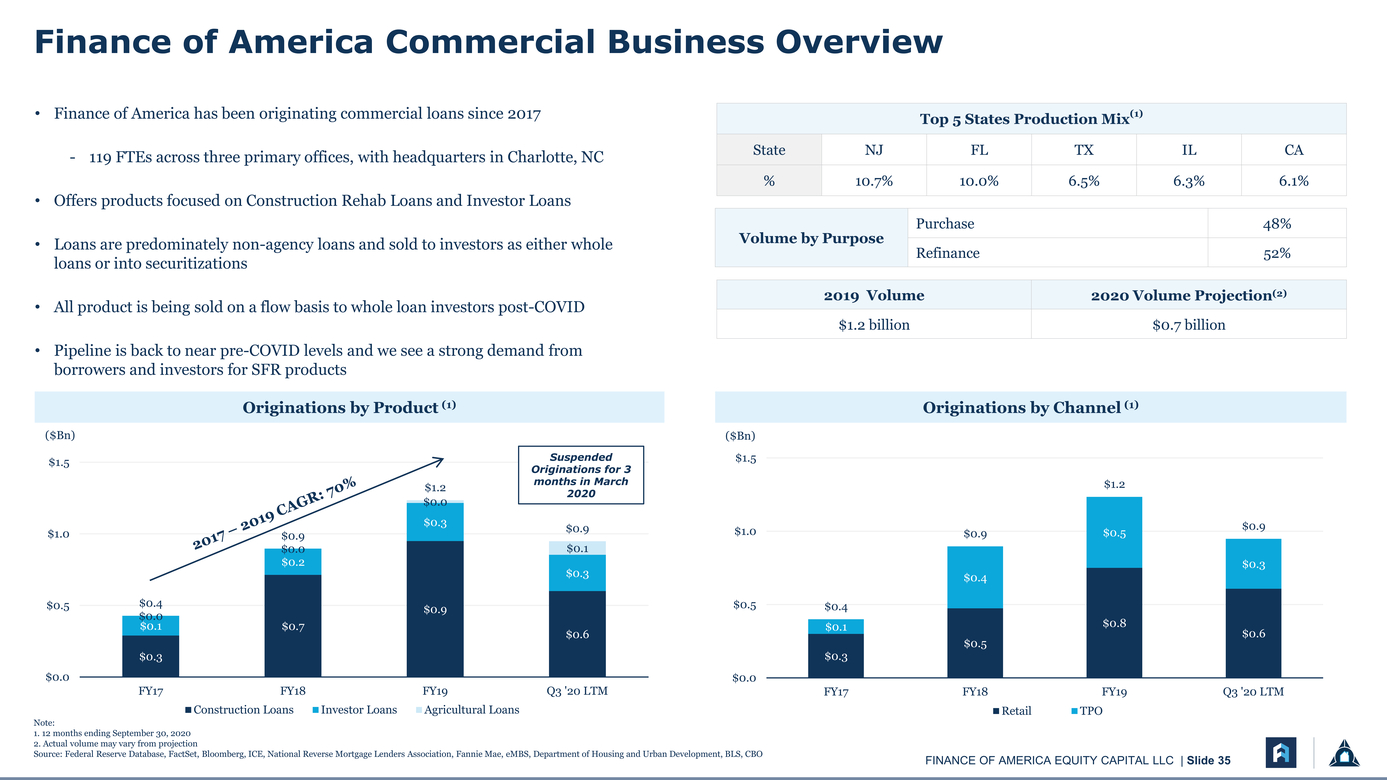 |
Finance of America Commercial Business Overview Top 5 States Production Mix(1) State NJ FL TX IL CA % 10.7% 10.0% 6.5% 6.3% 6.1% - 119 FTEs across three primary offices, with headquarters in Charlotte, NC Volume by Purpose Purchase 48% Refinance 52% Loans are predominately non-agency loans and sold to investors as either whole 2019 Volume 2020 Volume Projection(2) $1.2 billion $0.7 billion All product is being sold on a flow basis to whole loan investors post-COVID Pipeline is back to near pre-COVID levels and we see a strong demand from borrowers and investors for SFR products Originations by Product (1)Originations by Channel (1) ($Bn) $1.5 $1.0 $0.5 $0.0 $0.4 $0.0 $0.1 $0.3 $0.9 $0.0 $0.2 $0.7 $1.2 $0.0 $0.3 $0.9 Suspended Originations for 3 months in March 2020 $0.9 $0.1 $0.3 $0.6 ($Bn) $1.5 $1.0 $0.5 $0.0 $0.4 $0.1 $0.3 $0.9 $0.4 $0.5 $1.2 $0.5 $0.8 $0.9 $0.3 $0.6 Note: FY17FY18FY19Q3 '20 LTM Construction LoansInvestor LoansAgricultural Loans FY17FY18FY19Q3 '20 LTM RetailTPO 12 months ending September 30, 2020 Actual volume may vary from projection Source: Federal Reserve Database, FactSet, Bloomberg, ICE, National Reverse Mortgage Lenders Association, Fannie Mae, eMBS, Department of Housing and Urban Development, BLS, CBO |
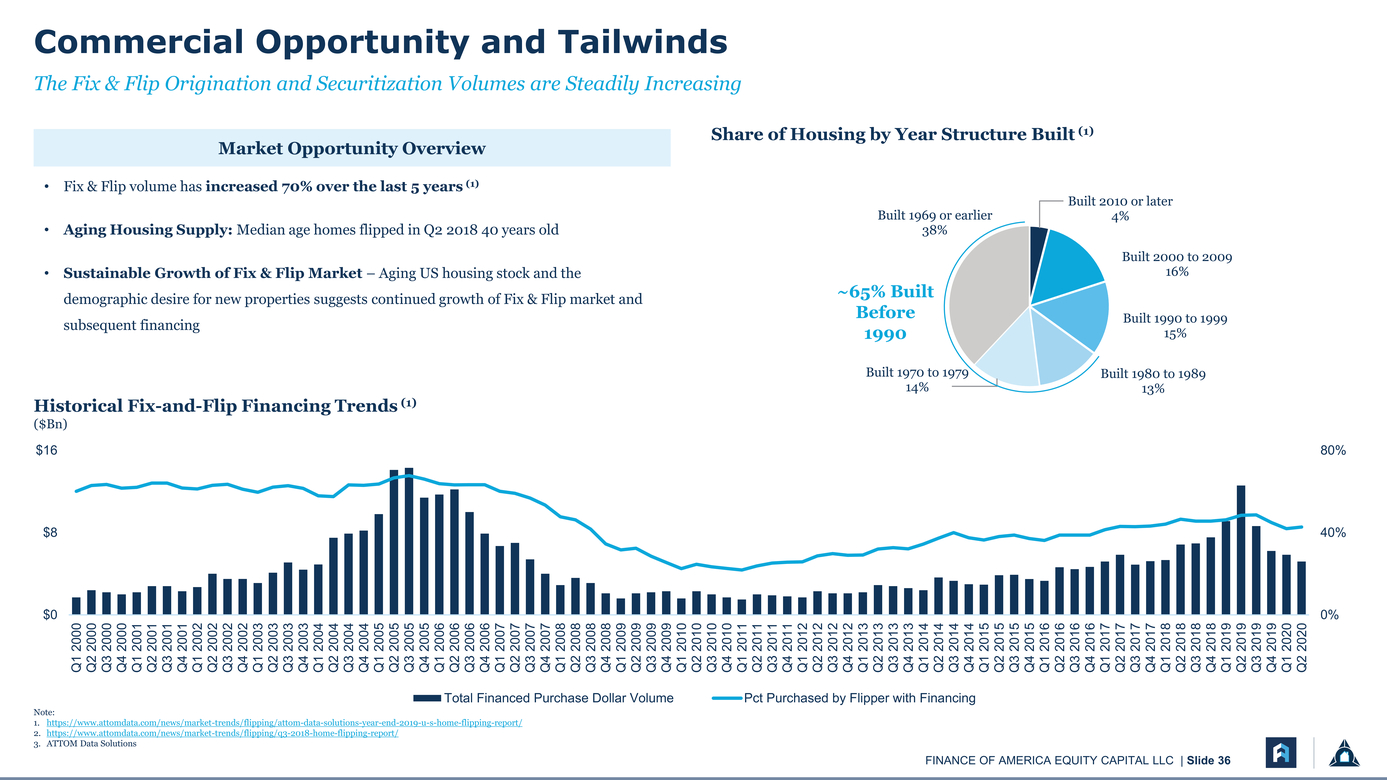 |
Commercial Opportunity and Tailwinds The Fix & Flip Origination and Securitization Volumes are Steadily Increasing Market Opportunity Overview Share of Housing by Year Structure Built (1) Fix & Flip volume has increased 70% over the last 5 years (1) Aging Housing Supply: Median age homes flipped in Q2 2018 40 years old Sustainable Growth of Fix & Flip Market – Aging US housing stock and the demographic desire for new properties suggests continued growth of Fix & Flip market and subsequent financing Historical Fix-and-Flip Financing Trends (1) ($Bn) Built 1969 or earlier 38% ~65% Built Before 1990 Built 1970 to 1979 14% Built 2010 or later 4% Built 2000 to 2009 16% Built 1990 to 1999 15% Built 1980 to 1989 13% $16 80% $840% Q1 2000 Q2 2000 Q3 2000 Q4 2000 Q1 2001 Q2 2001 Q3 2001 Q4 2001 Q1 2002 Q2 2002 Q3 2002 Q4 2002 Q1 2003 Q2 2003 Q3 2003 Q4 2003 Q1 2004 Q2 2004 Q3 2004 Q4 2004 Q1 2005 Q2 2005 Q3 2005 Q4 2005 Q1 2006 Q2 2006 Q3 2006 Q4 2006 Q1 2007 Q2 2007 Q3 2007 Q4 2007 Q1 2008 Q2 2008 Q3 2008 Q4 2008 Q1 2009 Q2 2009 Q3 2009 Q4 2009 Q1 2010 Q2 2010 Q3 2010 Q4 2010 Q1 2011 Q2 2011 Q3 2011 Q4 2011 Q1 2012 Q2 2012 Q3 2012 Q4 2012 Q1 2013 Q2 2013 Q3 2013 Q4 2013 Q1 2014 Q2 2014 Q3 2014 Q4 2014 Q1 2015 Q2 2015 Q3 2015 Q4 2015 Q1 2016 Q2 2016 Q3 2016 Q4 2016 Q1 2017 Q2 2017 Q3 2017 Q4 2017 Q1 2018 Q2 2018 Q3 2018 Q4 2018 Q1 2019 Q2 2019 Q3 2019 Q4 2019 Q1 2020 Q2 2020 Note: Total Financed Purchase Dollar VolumePct Purchased by Flipper with Financing https://www.attomdata.com/news/market-trends/flipping/attom-data-solutions-year-end-2019-u-s-home-flipping-report/ https://www.attomdata.com/news/market-trends/flipping/q3-2018-home-flipping-report/ ATTOM Data Solutions |
 |
[LOGO] |
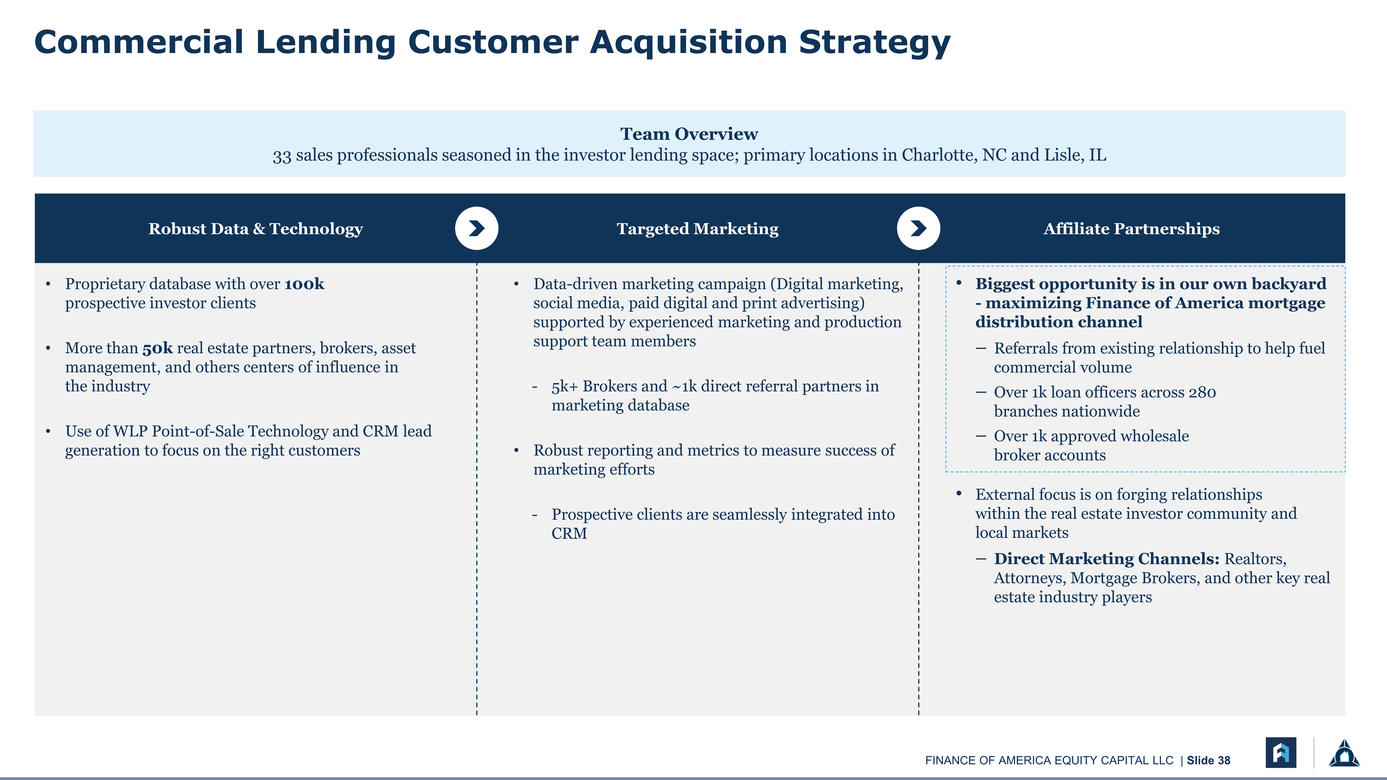 |
Team Overview 33 sales professionals seasoned in the investor lending space; primary locations in Charlotte, NC and Lisle, IL Robust Data & TechnologyTargeted MarketingAffiliate Partnerships Proprietary database with over 100k prospective investor clients More than 50k real estate partners, brokers, asset management, and others centers of influence in the industry Use of WLP Point-of-Sale Technology and CRM lead generation to focus on the right customers Data-driven marketing campaign (Digital marketing, social media, paid digital and print advertising) supported by experienced marketing and production support team members 5k+ Brokers and ~1k direct referral partners in marketing database Robust reporting and metrics to measure success of marketing efforts Prospective clients are seamlessly integrated into CRM Biggest opportunity is in our own backyard - maximizing Finance of America mortgage distribution channel Referrals from existing relationship to help fuel commercial volume Over 1k loan officers across 280 branches nationwide Over 1k approved wholesale broker accounts External focus is on forging relationships within the real estate investor community and local markets Direct Marketing Channels: Realtors, Attorneys, Mortgage Brokers, and other key real estate industry players |
 |
Lender Services Overview |
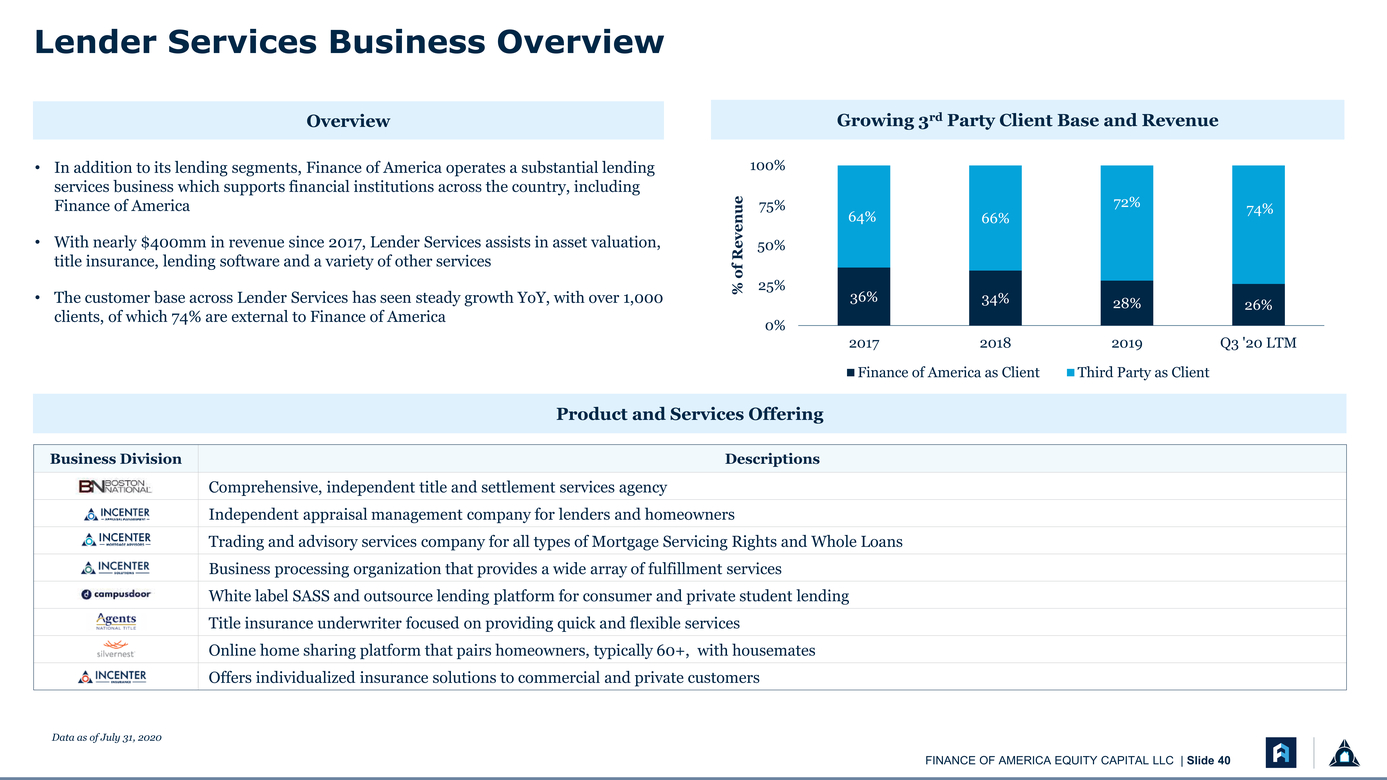 |
Lender Services Business Overview Overview Growing 3rd Party Client Base and Revenue In addition to its lending segments, Finance of America operates a substantial lending services business which supports financial institutions across the country, including Finance of America With nearly $400mm in revenue since 2017, Lender Services assists in asset valuation, title insurance, lending software and a variety of other services 100% % of Revenue 50% 25% 64%66% 72%74% The customer base across Lender Services has seen steady growth YoY, with over 1,000 clients, of which 74% are external to Finance of America 36%34%28%26% 0% 201720182019Q3 '20 LTM Finance of America as ClientThird Party as Client Product and Services Offering Data as of July 31, 2020 |
 |
Portfolio Management Overview |
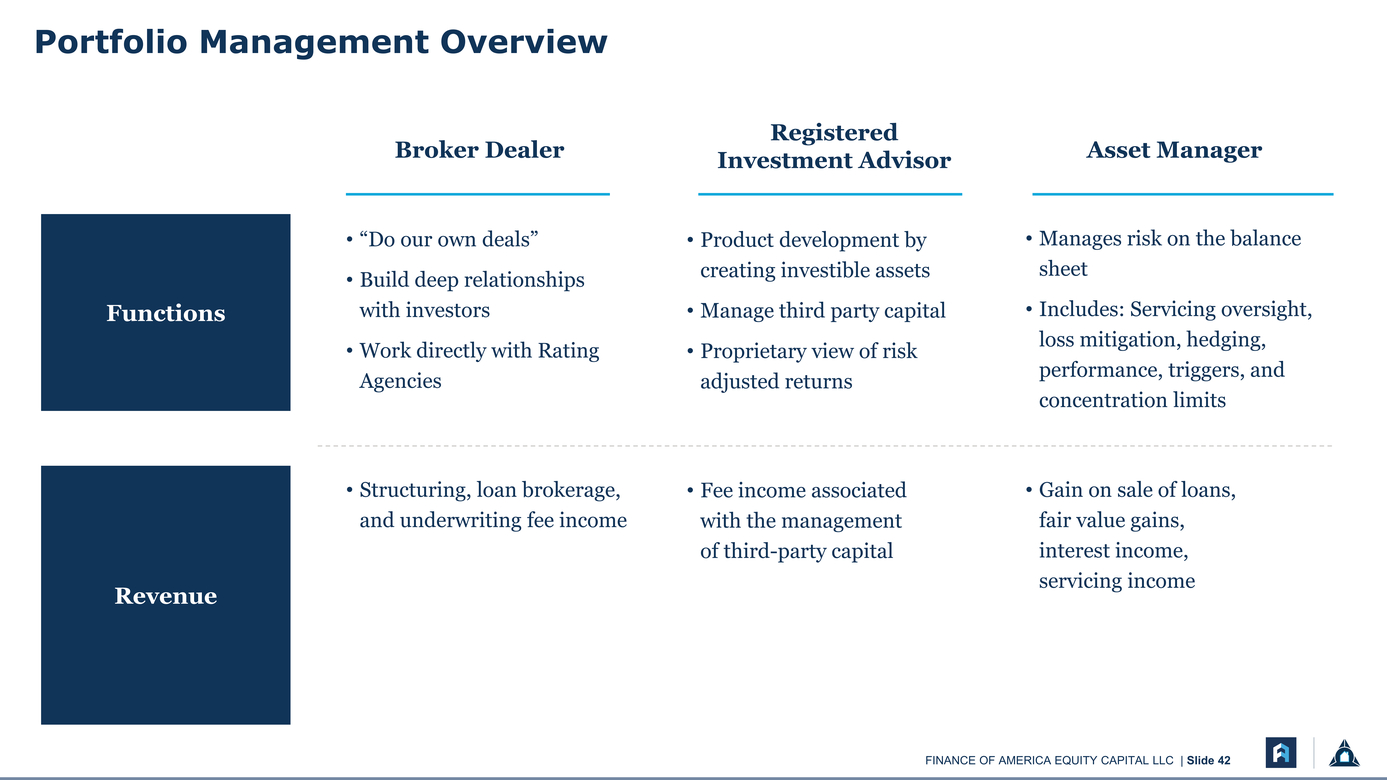 |
Portfolio Management Overview Broker Dealer Registered Investment Advisor Asset Manager Functions “Do our own deals” Build deep relationships with investors Work directly with Rating Agencies Product development by creating investible assets Manage third party capital Proprietary view of risk adjusted returns Manages risk on the balance sheet Includes: Servicing oversight, loss mitigation, hedging, performance, triggers, and concentration limits Revenue Structuring, loan brokerage, and underwriting fee income Fee income associated with the management of third-party capital Gain on sale of loans, fair value gains, interest income, servicing income |
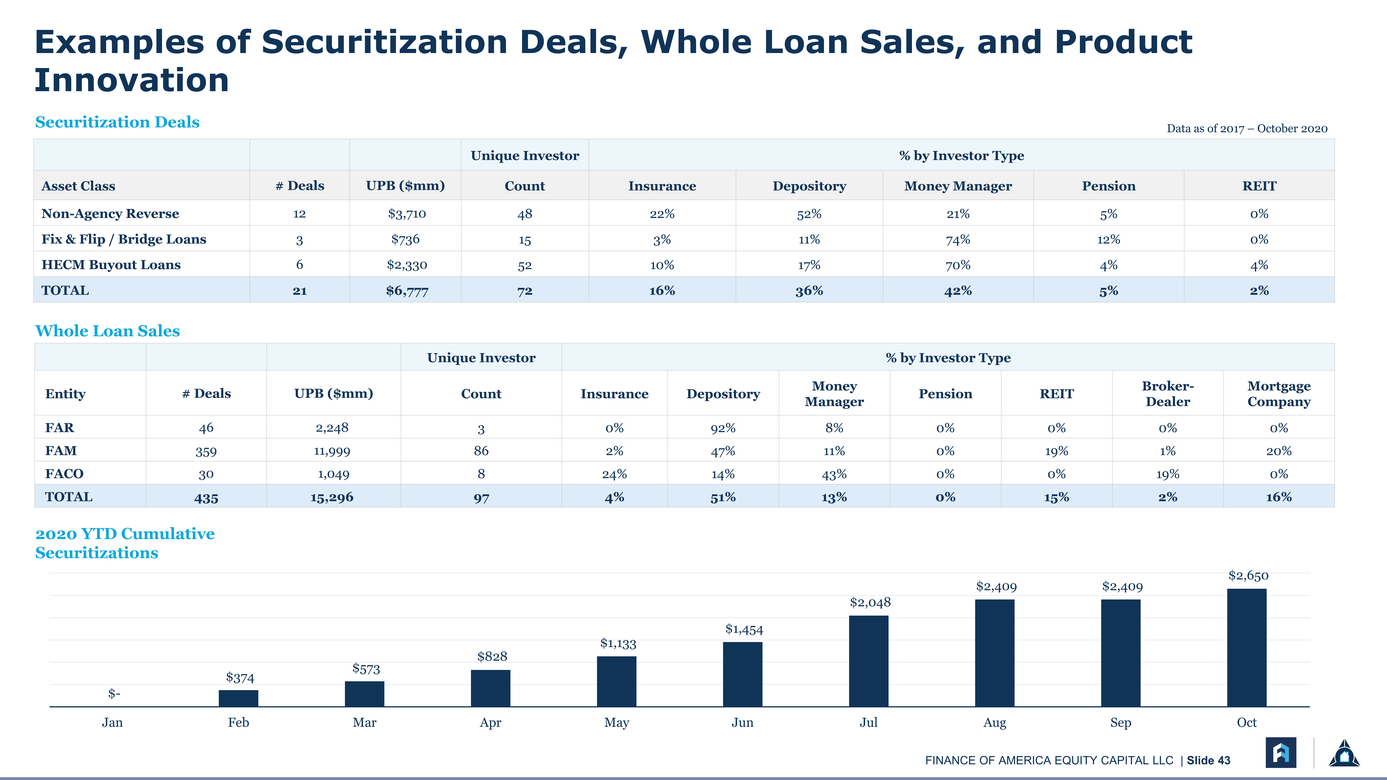 |
Examples of Securitization Deals, Whole Loan Sales, and Product Innovation Securitization Deals Data as of 2017 – October 2020 Whole Loan Sales 2020 YTD Cumulative Securitizations $2,650 $2,409$2,409 $2,048 $374 $-$573 $828 $1,133 $1,454 JanFebMarAprMayJunJulAugSepOct |
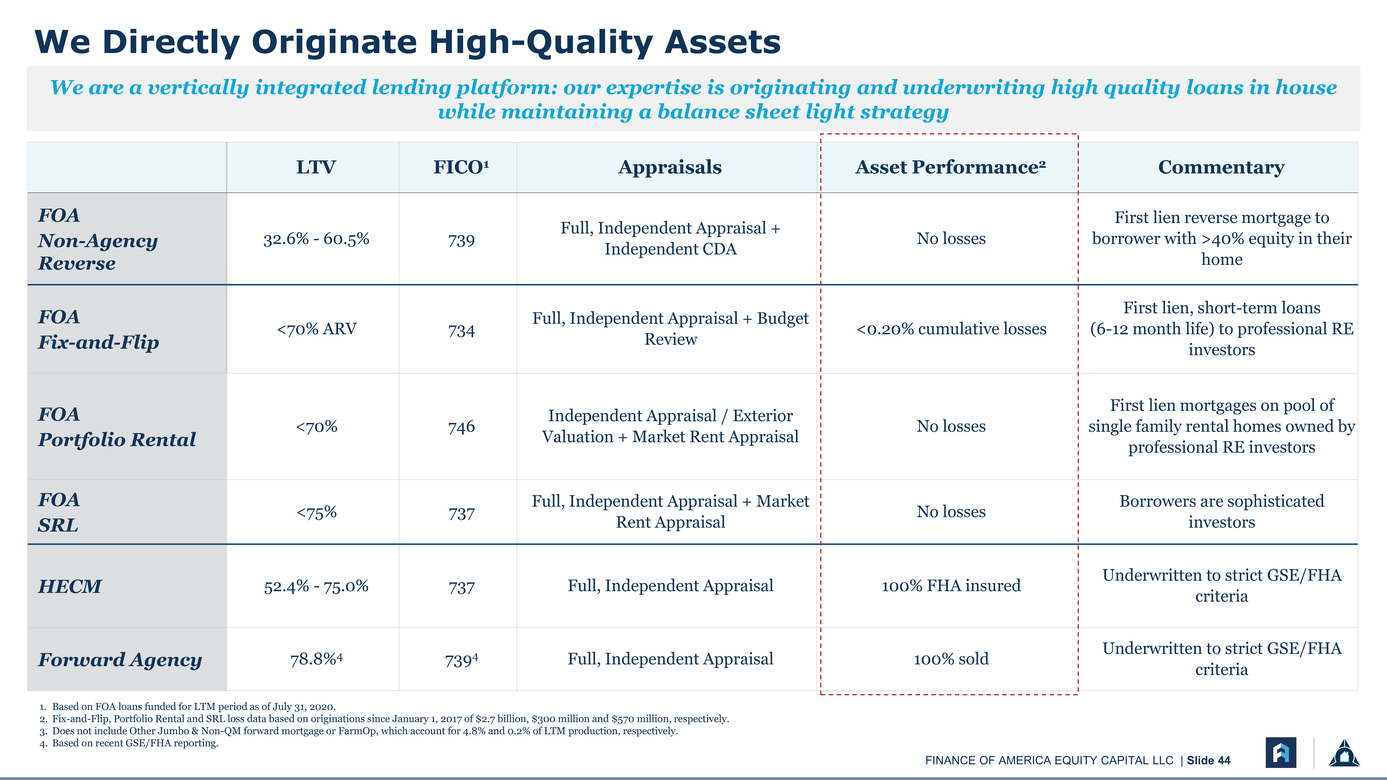 |
We Directly Originate High-Quality Assets Based on FOA loans funded for LTM period as of July 31, 2020. Fix-and-Flip, Portfolio Rental and SRL loss data based on originations since January 1, 2017 of $2.7 billion, $300 million and $570 million, respectively. Does not include Other Jumbo & Non-QM forward mortgage or FarmOp, which account for 4.8% and 0.2% of LTM production, respectively. Based on recent GSE/FHA reporting. |
 |
Future Opportunities |
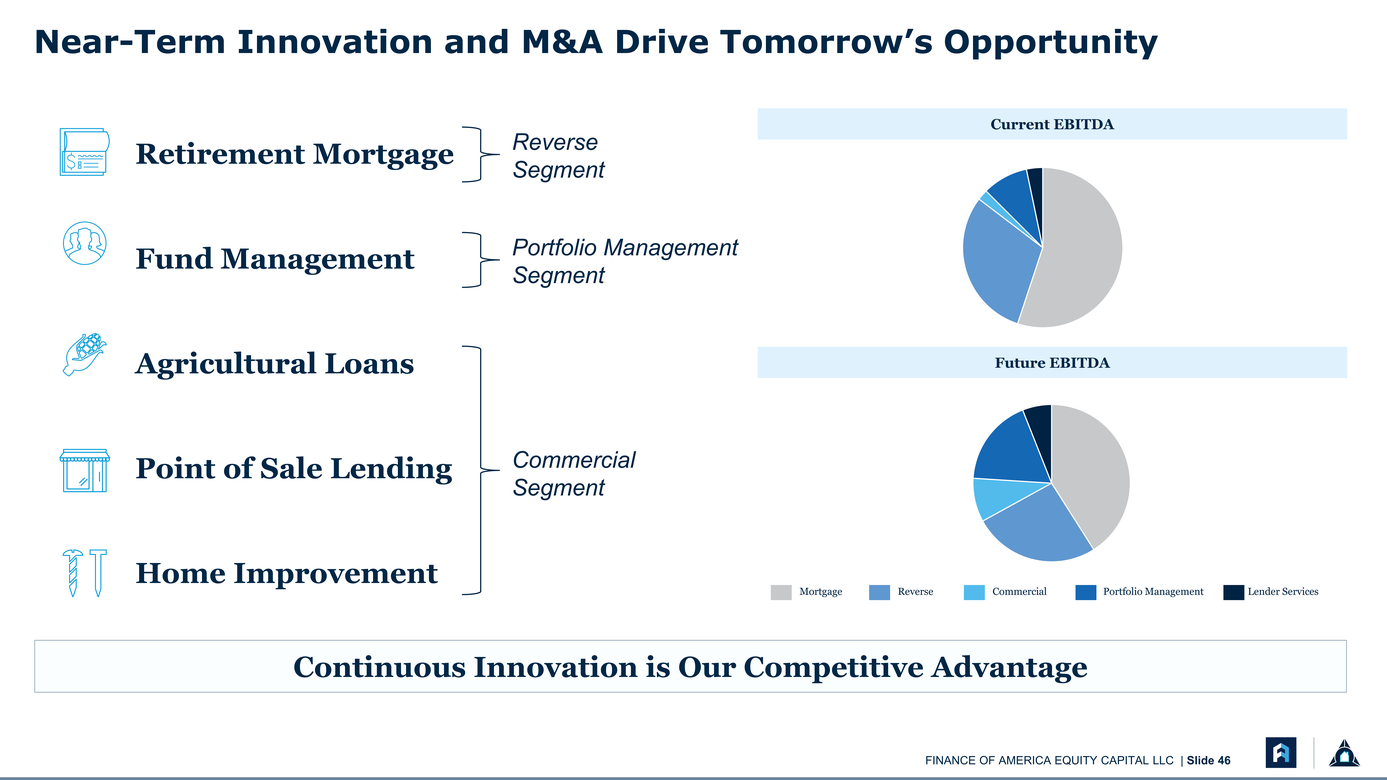 |
Near-Term Innovation and M&A Drive Tomorrow’s Opportunity Retirement Mortgage Reverse Segment Current EBITDA Fund Management Portfolio Management Segment Agricultural Loans Future EBITDA Point of Sale Lending Home Improvement Commercial Segment MortgageReverseCommercialPortfolio ManagementLender Services Continuous Innovation is Our Competitive Advantage |
 |
4 Financial Overview |
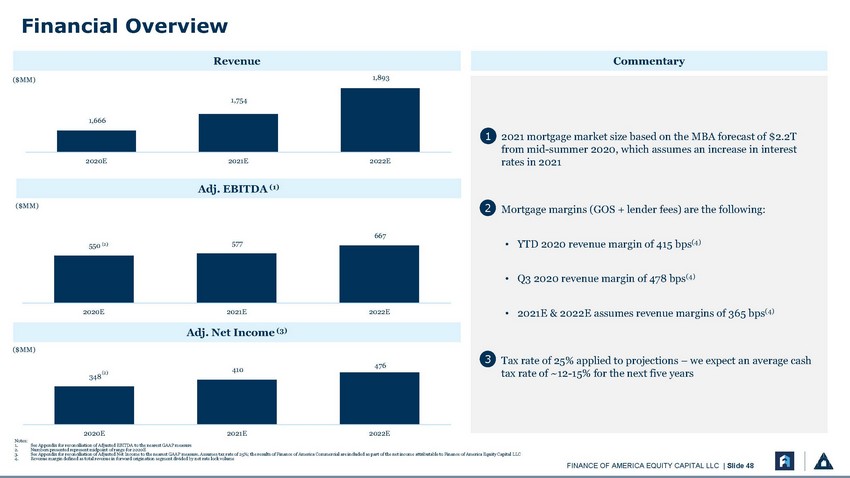 |
($MM) Revenue 1,893 Commentary 1,754 1,666 2020E2021E2022E 1• 2021 mortgage market size based on the MBA forecast of $2.2T from mid-summer 2020, which assumes an increase in interest rates in 2021 ($MM) Adj. EBITDA (1) 2• Mortgage margins (GOS + lender fees) are the following: 550 (2) 577 667 YTD 2020 revenue margin of 457 bps Q3 2020 revenue margin of 525 bps 2020E2021E2022E Adj. Net Income (3) 2021E & 2022E assumes revenue margins of 365 bps ($MM) (2) 348 410476 3• Tax rate of 25% applied to projections – we expect an average cash tax rate of ~12-15% for the next five years 2020E2021E2022E Notes: See Appendix for reconciliation of Adjusted EBITDA to the nearest GAAP measure Numbers presented represent midpoint of range for 2020E See Appendix for reconciliation of Adjusted Net Income to the nearest GAAP measure. Assumes tax rate of 25%; the results of Finance of America Commercial are included as part of the net income attributable to Finance of America Equity Capital LLC |
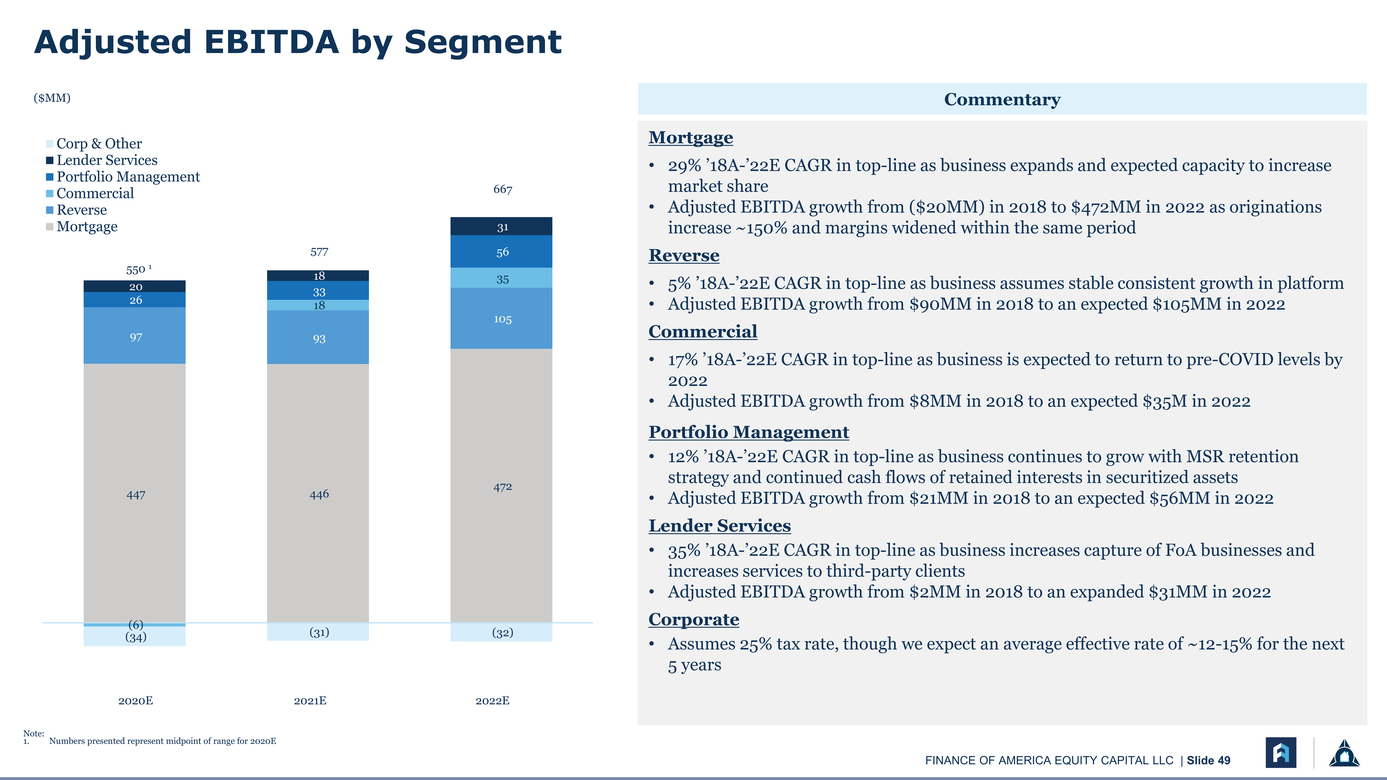 |
($MM) Corp & Other Mortgage Commentary Lender Services Portfolio Management Commercial Reverse Mortgage 550 1 20 26 577 18 33 18 667 31 56 35 105 29% ’18A-’22E CAGR in top-line as business expands and expected capacity to increase market share Adjusted EBITDA growth from ($20MM) in 2018 to $472MM in 2022 as originations increase ~150% and margins widened within the same period Reverse 5% ’18A-’22E CAGR in top-line as business assumes stable consistent growth in platform Adjusted EBITDA growth from $90MM in 2018 to an expected $105MM in 2022 9793 447446472 (6) (34)(31)(32) Commercial 17% ’18A-’22E CAGR in top-line as business is expected to return to pre-COVID levels by 2022 Adjusted EBITDA growth from $8MM in 2018 to an expected $35M in 2022 Portfolio Management 12% ’18A-’22E CAGR in top-line as business continues to grow with MSR retention strategy and continued cash flows of retained interests in securitized assets Adjusted EBITDA growth from $21MM in 2018 to an expected $56MM in 2022 Lender Services 35% ’18A-’22E CAGR in top-line as business increases capture of FoA businesses and increases services to third-party clients Adjusted EBITDA growth from $2MM in 2018 to an expanded $31MM in 2022 Corporate 2020E2021E2022E 2020E2021E2022E Note: 1.Numbers presented represent midpoint of range for 2020E |
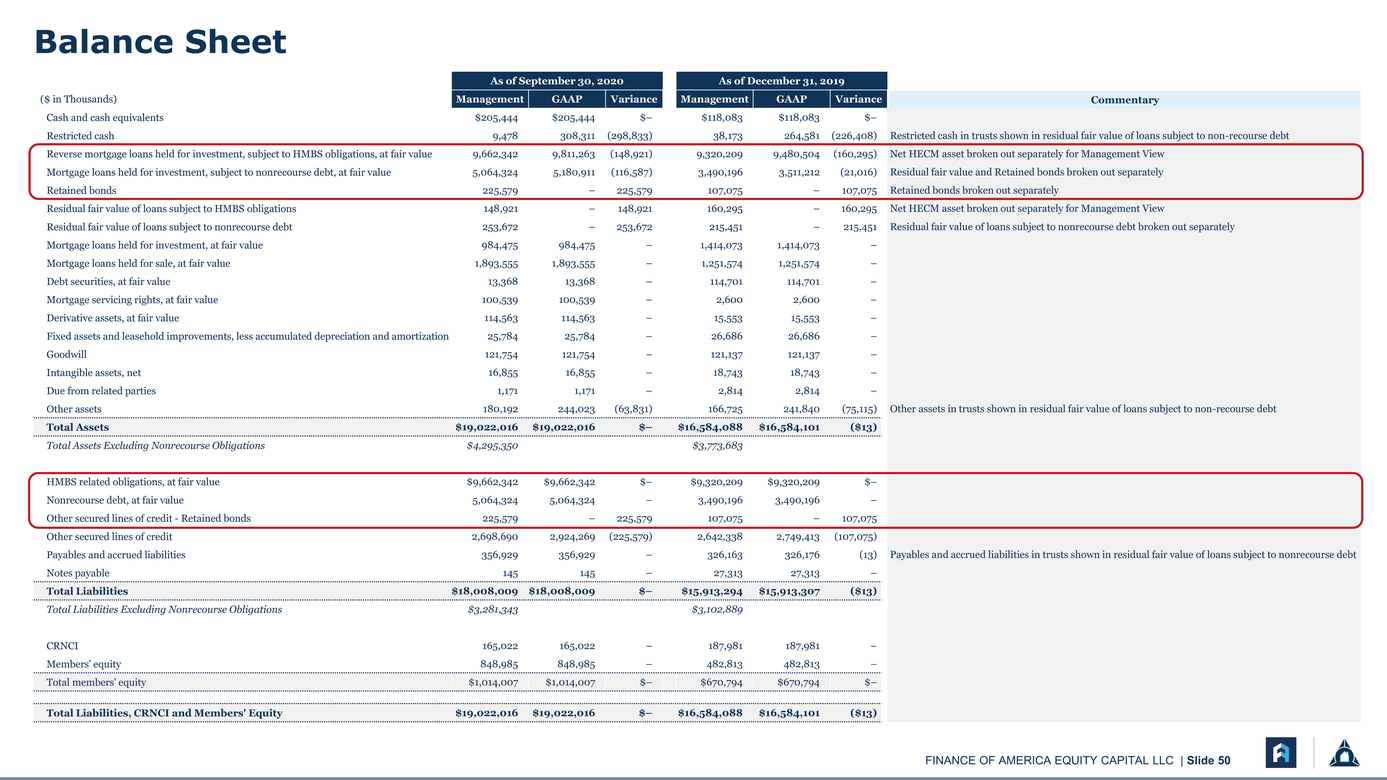 |
Balance Sheet As of September 30, 2020As of December 31, 2019 ($ in Thousands)ManagementGAAPVarianceManagementGAAPVariance Commentary |
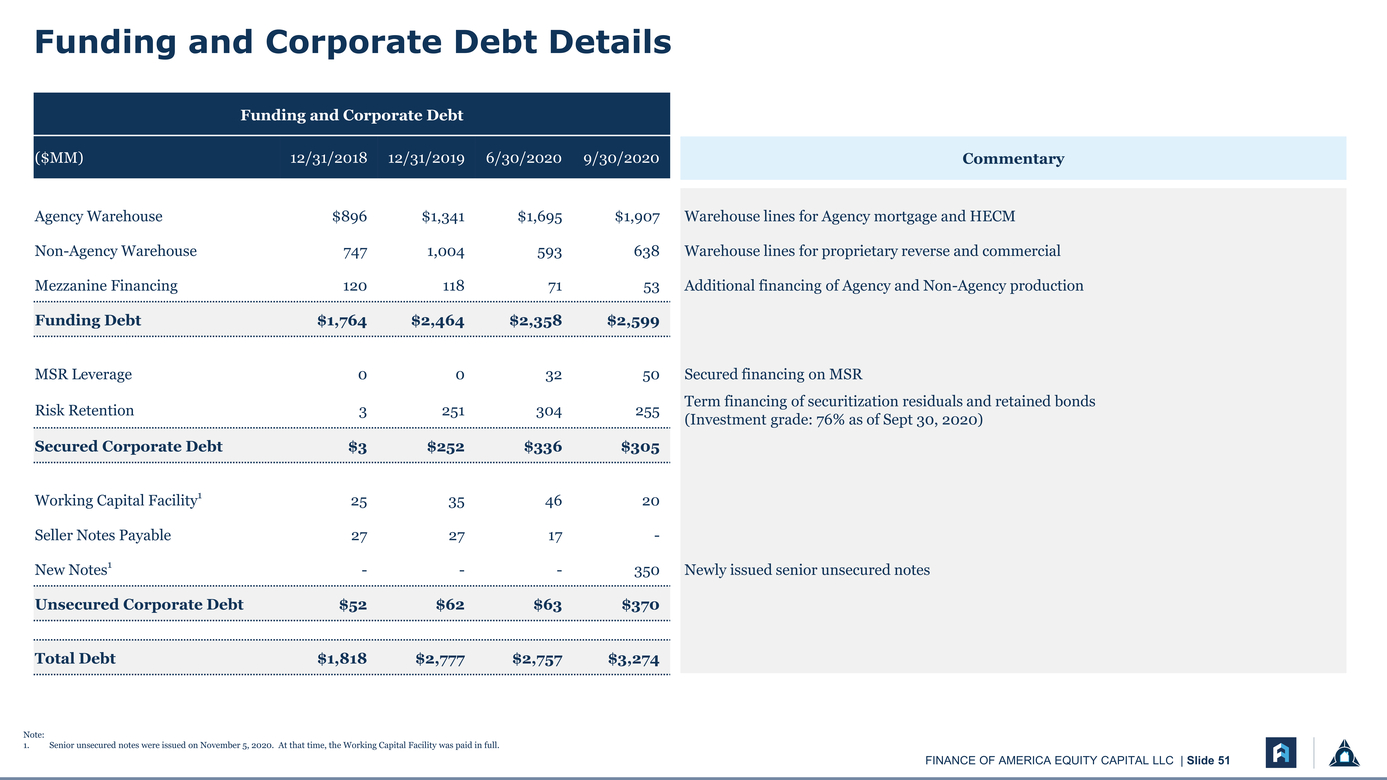 |
Commentary Note: Senior unsecured notes were issued on November 5, 2020. At that time, the Working Capital Facility was paid in full. |
 |
5 Model Drivers |
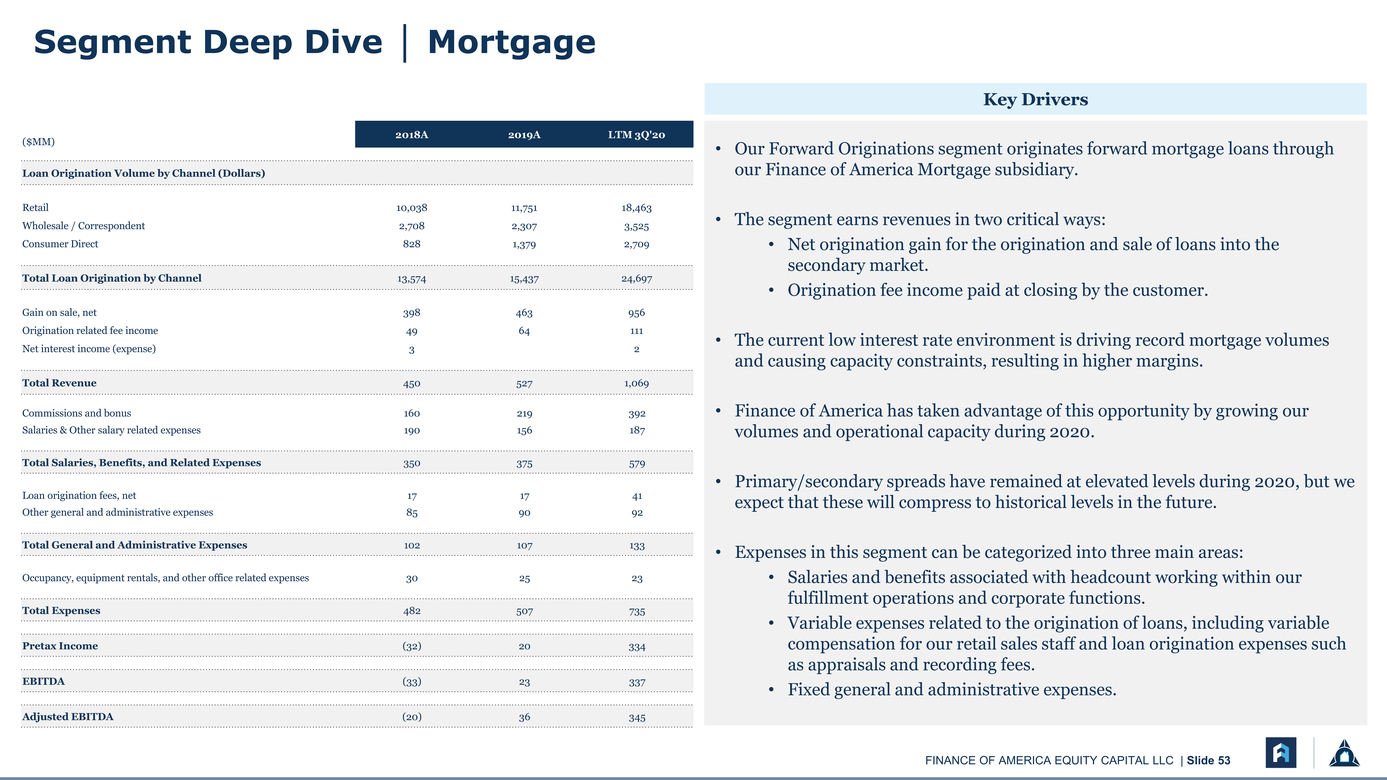 |
($MM) 2018A 2019A LTM 3Q'20 Loan Origination Volume by Channel (Dollars) Retail 10,038 11,751 18,463 Wholesale / Correspondent 2,708 2,307 3,525 Consumer Direct 828 1,379 2,709 Total Loan Origination by Channel 13,574 15,437 24,697 Gain on sale, net 398 463 956 Origination related fee income 49 64 111 Net interest income (expense) 3 2 Total Revenue 450 527 1,069 The segment earns revenues in two critical ways: Net origination gain for the origination and sale of loans into the secondary market. Origination fee income paid at closing by the customer. The current low interest rate environment is driving record mortgage volumes and causing capacity constraints, resulting in higher margins. |
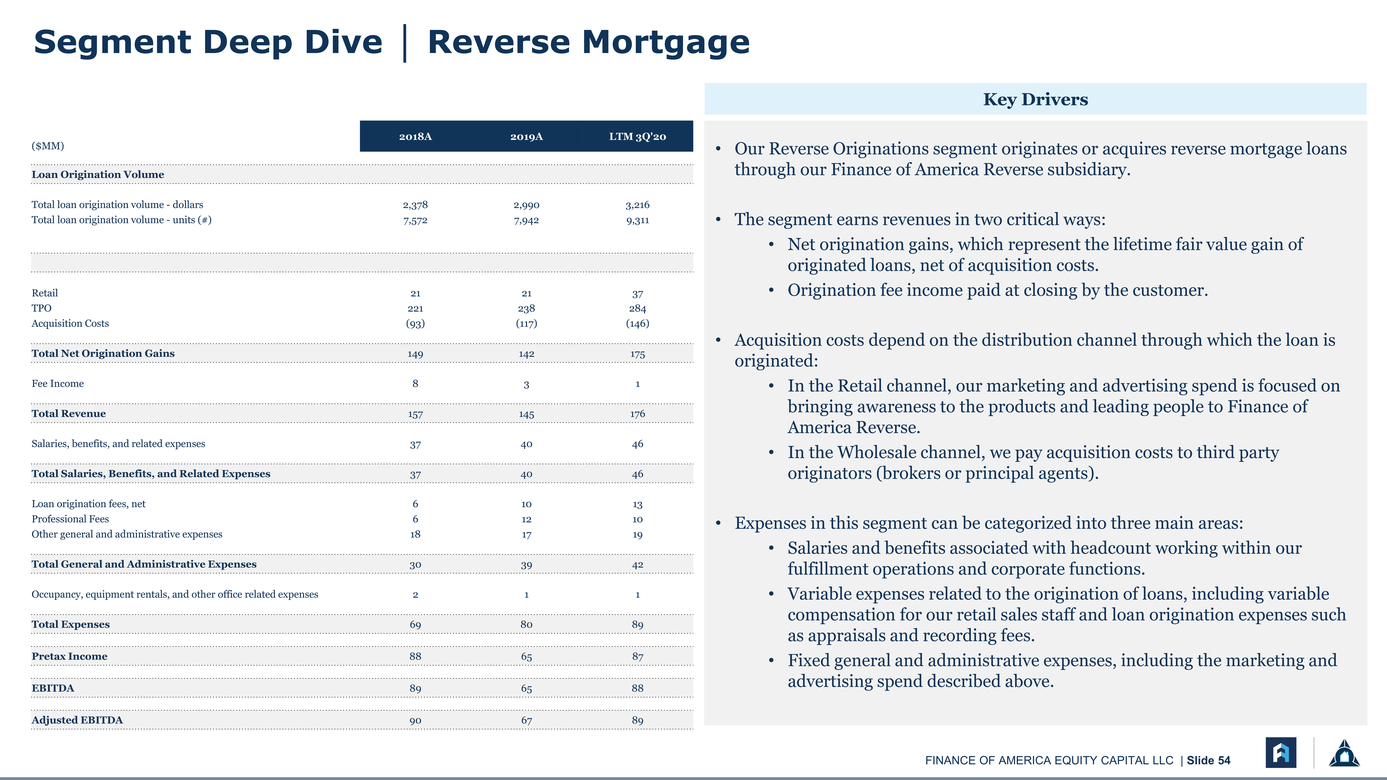 |
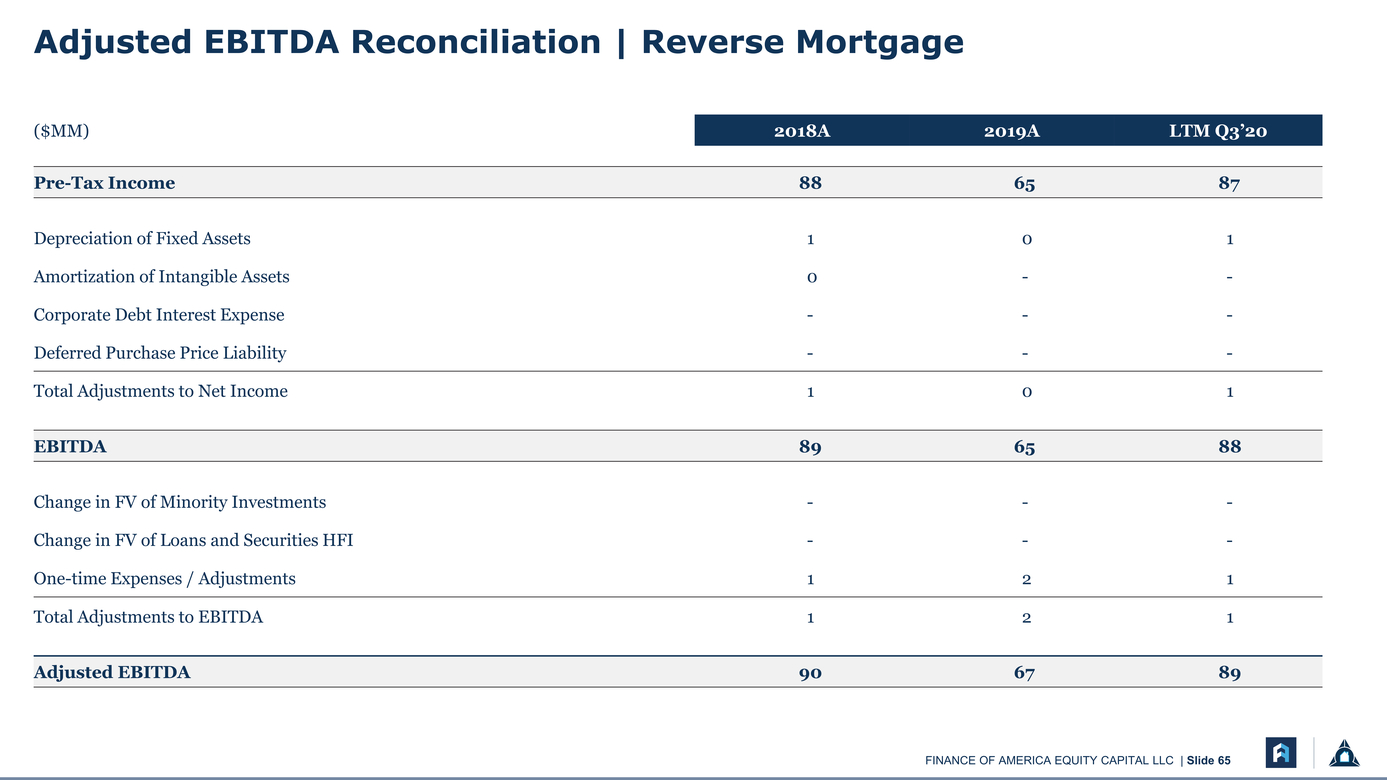
($MM) 2018A 2019A LTM 3Q'20 Loan Origination Volume Total loan origination volume - dollars 2,378 2,990 3,216 Total loan origination volume - units (#) 7,572 7,942 9,311 Retail 21 21 37 TPO 221 238 284 Acquisition Costs (93) (117) (146) Total Net Origination Gains 149 142 175 Fee Income 8 3 1 Total Revenue 157 145 176 Salaries, benefits, and related expenses 37 40 46 Total Salaries, Benefits, and Related Expenses 37 40 46 Loan origination fees, net 6 10 13 Professional Fees 6 12 10 Other general and administrative expenses 18 17 19 Total General and Administrative Expenses 30 39 42 Occupancy, equipment rentals, and other office related expenses 2 1 1 Total Expenses 69 80 89 Pretax Income 88 65 87 EBITDA 89 65 88 Adjusted EBITDA 90 67 89 Our Reverse Originations segment originates or acquires reverse mortgage loans through our Finance of America Reverse subsidiary. The segment earns revenues in two critical ways: Net origination gains, which represent the lifetime fair value gain of originated loans, net of acquisition costs. Origination fee income paid at closing by the customer. Acquisition costs depend on the distribution channel through which the loan is originated: In the Retail channel, our marketing and advertising spend is focused on bringing awareness to the products and leading people to Finance of America Reverse. In the Wholesale channel, we pay acquisition costs to third party originators (brokers or principal agents). Expenses in this segment can be categorized into three main areas: Salaries and benefits associated with headcount working within our fulfillment operations and corporate functions. Variable expenses related to the origination of loans, including variable compensation for our retail sales staff and loan origination expenses such as appraisals and recording fees. Fixed general and administrative expenses, including the marketing and advertising spend described above. |
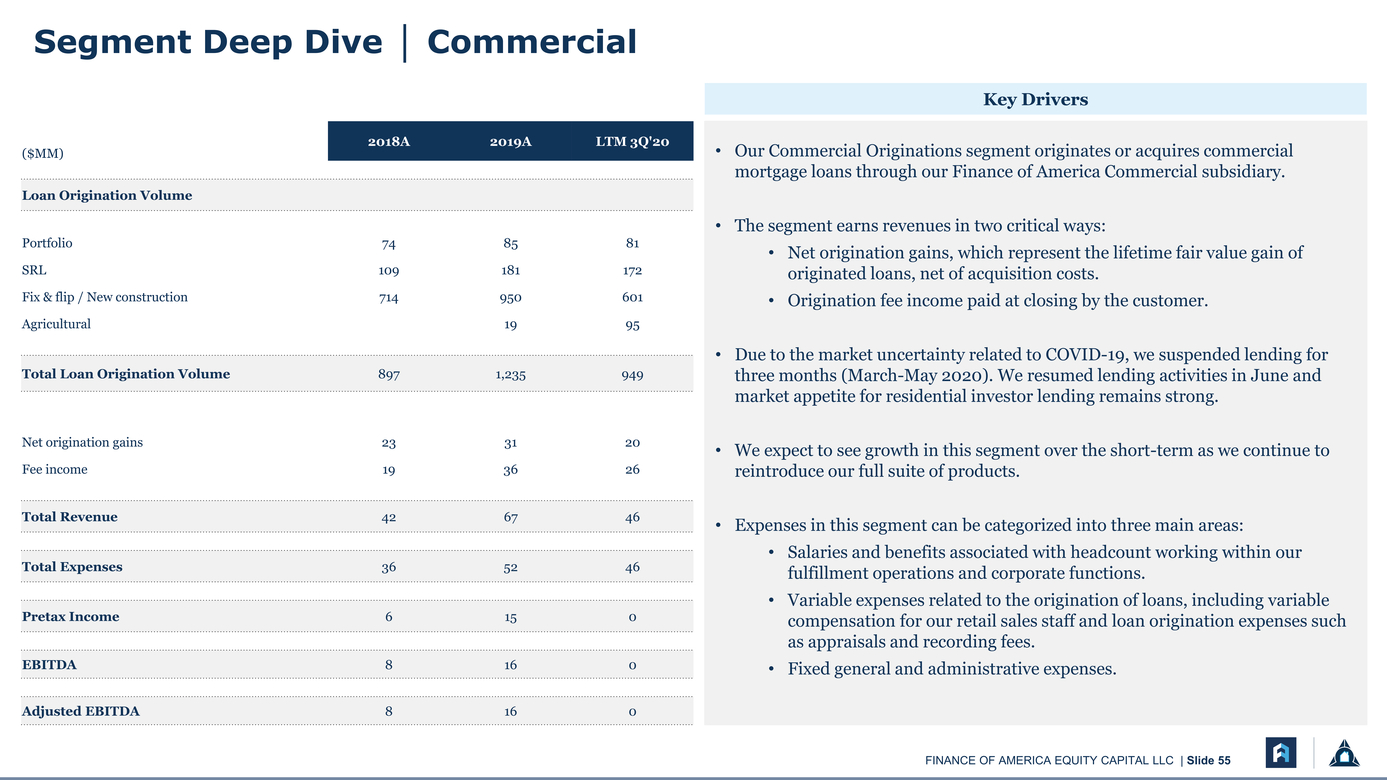 |
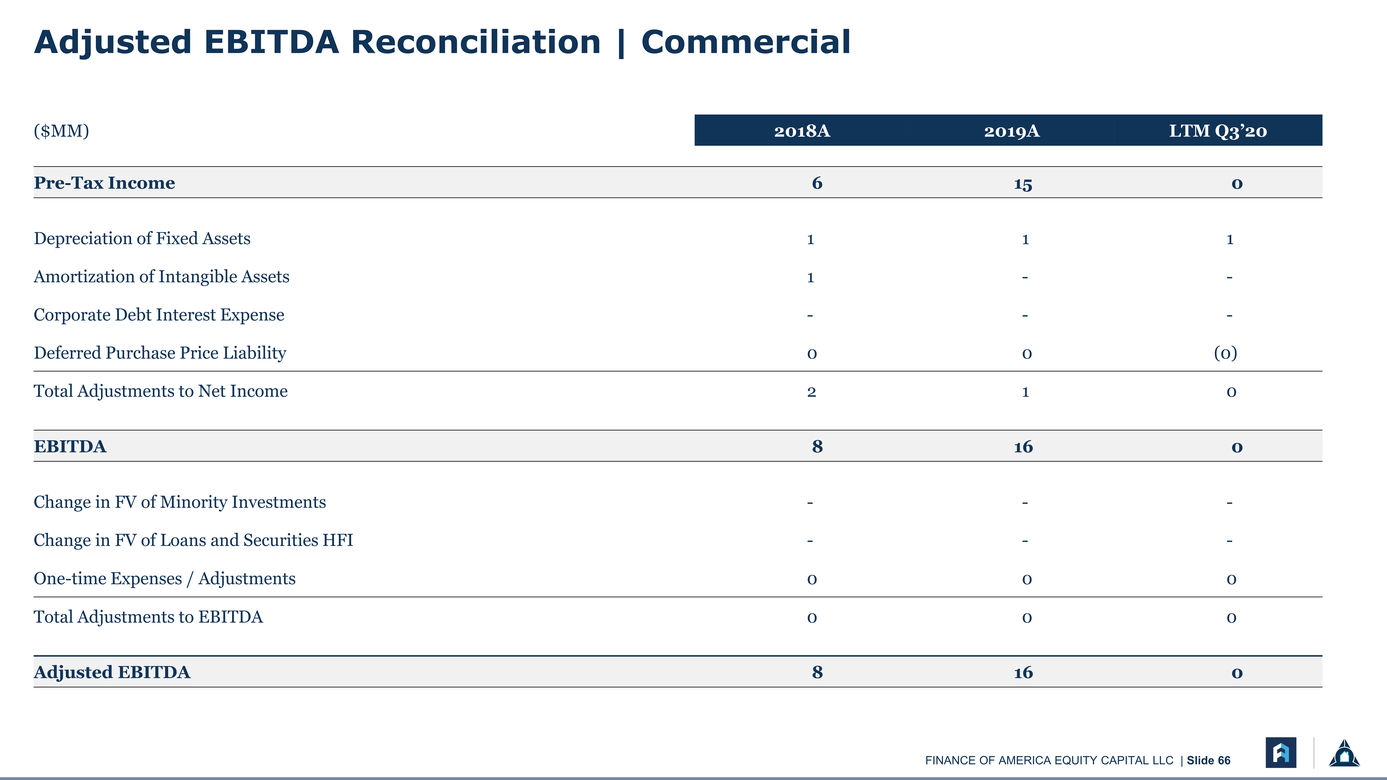
($MM) 2018A 2019A LTM 3Q'20 Loan Origination Volume Portfolio 74 85 81 SRL 109 181 172 Fix & flip / New construction 714 950 601 Agricultural 19 95 Total Loan Origination Volume 897 1,235 949 Net origination gains 23 31 20 Fee income 19 36 26 Total Revenue 42 67 46 Total Expenses 36 52 46 Pretax Income 6 15 0 EBITDA 8 16 0 Adjusted EBITDA 8 16 0 Our Commercial Originations segment originates or acquires commercial mortgage loans through our Finance of America Commercial subsidiary. The segment earns revenues in two critical ways: Net origination gains, which represent the lifetime fair value gain of originated loans, net of acquisition costs. Origination fee income paid at closing by the customer. Due to the market uncertainty related to COVID-19, we suspended lending for three months (March-May 2020). We resumed lending activities in June and market appetite for residential investor lending remains strong. We expect to see growth in this segment over the short-term as we continue to reintroduce our full suite of products. Expenses in this segment can be categorized into three main areas: Salaries and benefits associated with headcount working within our fulfillment operations and corporate functions. Variable expenses related to the origination of loans, including variable compensation for our retail sales staff and loan origination expenses such as appraisals and recording fees. Fixed general and administrative expenses. |
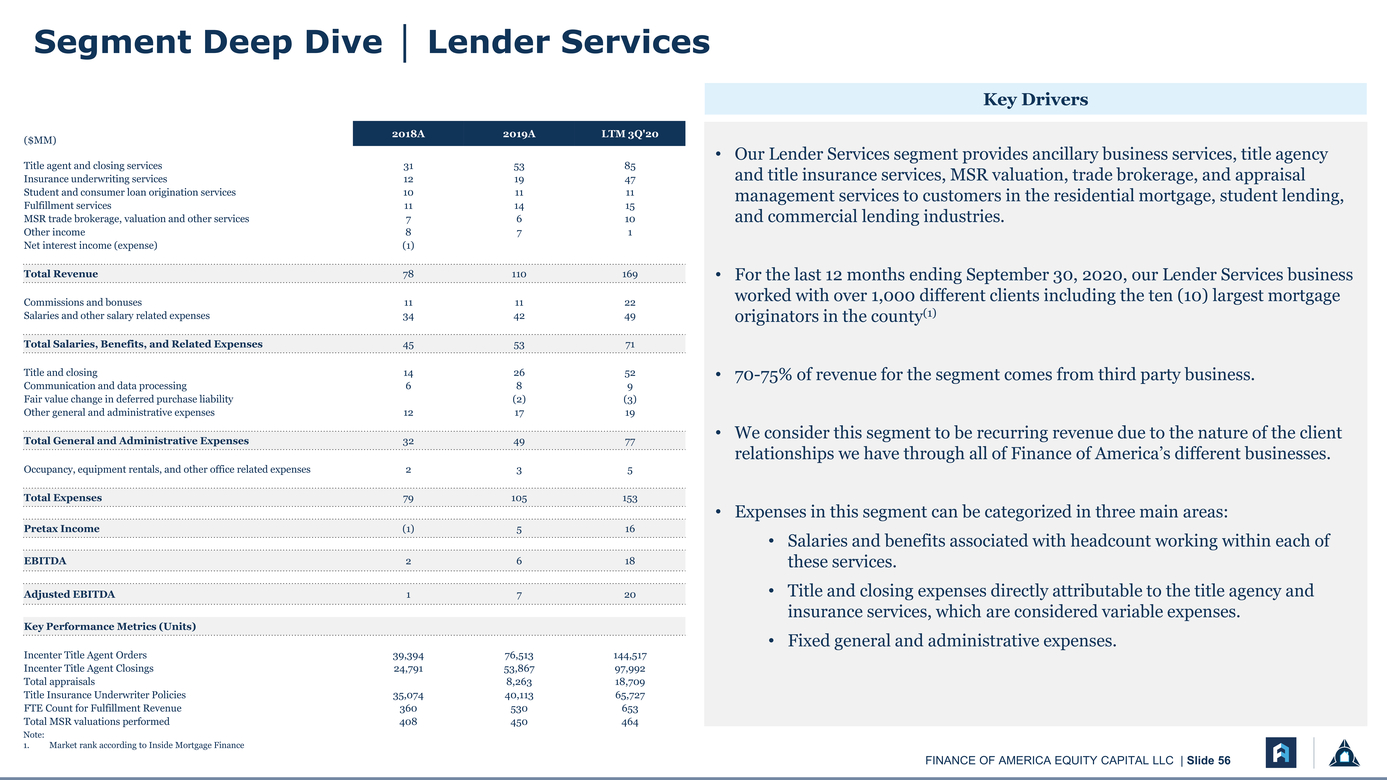 |
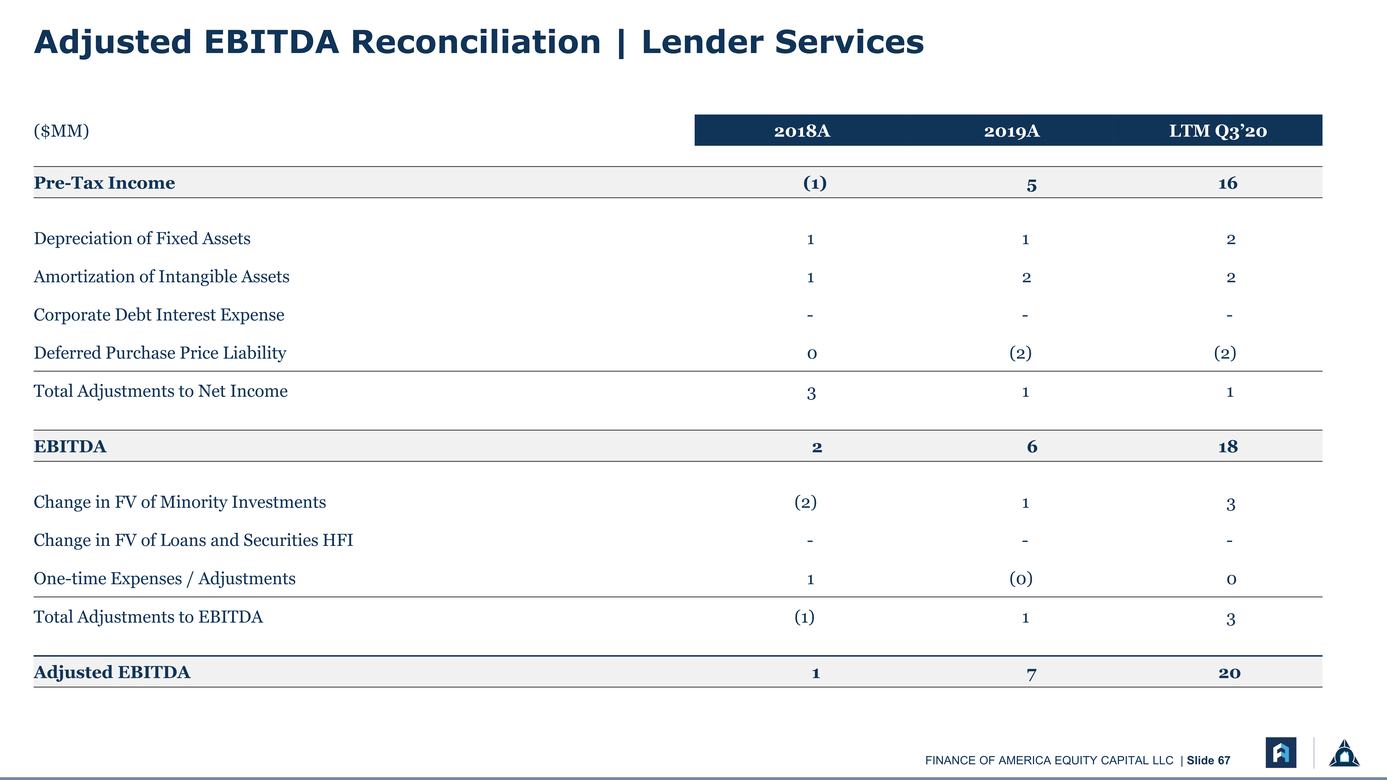
($MM) 2018A 2019A LTM 3Q'20 Title agent and closing services 31 53 85 Insurance underwriting services 12 19 47 Student and consumer loan origination services 10 11 11 Fulfillment services 11 14 15 MSR trade brokerage, valuation and other services 7 6 10 Other income 8 7 1 Net interest income (expense) (1) Total Revenue 78 110 169 Commissions and bonuses 11 11 22 Salaries and other salary related expenses 34 42 49 Total Salaries, Benefits, and Related Expenses 45 53 71 Title and closing 14 26 52 Communication and data processing 6 8 9 Fair value change in deferred purchase liability (2) (3) Other general and administrative expenses 12 17 19 Total General and Administrative Expenses 32 49 77 Occupancy, equipment rentals, and other office related expenses 2 3 5 Total Expenses 79 105 153 Pretax Income (1) 5 16 EBITDA 2 6 18 Adjusted EBITDA 1 7 20 Key Performance Metrics (Units) Incenter Title Agent Orders 39,394 76,513 144,517 Incenter Title Agent Closings 24,791 53,867 97,992 Total appraisals 8,263 18,709 Title Insurance Underwriter Policies 35,074 40,113 65,727 FTE Count for Fulfillment Revenue 360 530 653 Total MSR valuations performed 408 450 464 Our Lender Services segment provides ancillary business services, title agency and title insurance services, MSR valuation, trade brokerage, and appraisal management services to customers in the residential mortgage, student lending, and commercial lending industries. For the last 12 months ending September 30, 2020, our Lender Services business worked with over 1,000 different clients including the ten (10) largest mortgage originators in the county(1) 70-75% of revenue for the segment comes from third party business. We consider this segment to be recurring revenue due to the nature of the client relationships we have through all of Finance of America’s different businesses. Expenses in this segment can be categorized in three main areas: Salaries and benefits associated with headcount working within each of these services. Title and closing expenses directly attributable to the title agency and insurance services, which are considered variable expenses. Fixed general and administrative expenses. Note: Market rank according to Inside Mortgage Finance |
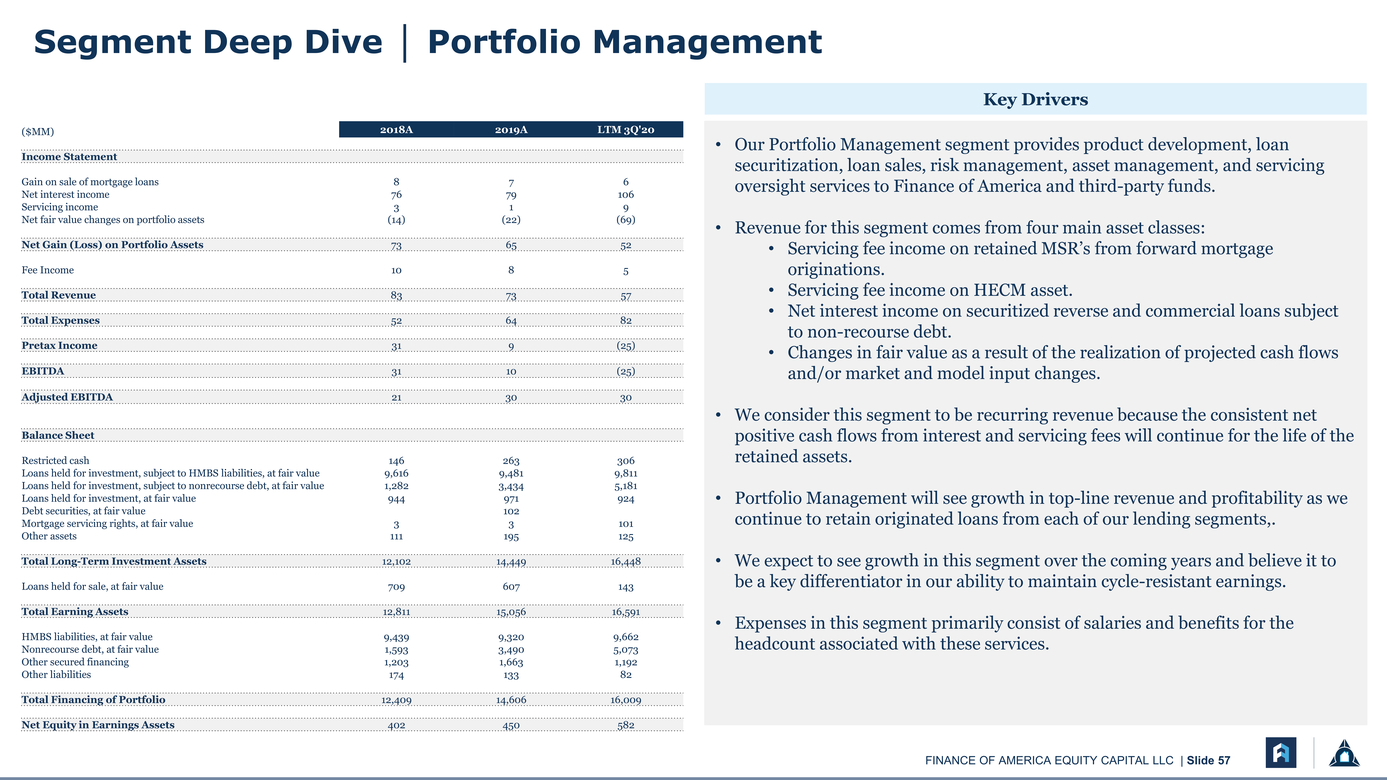 |
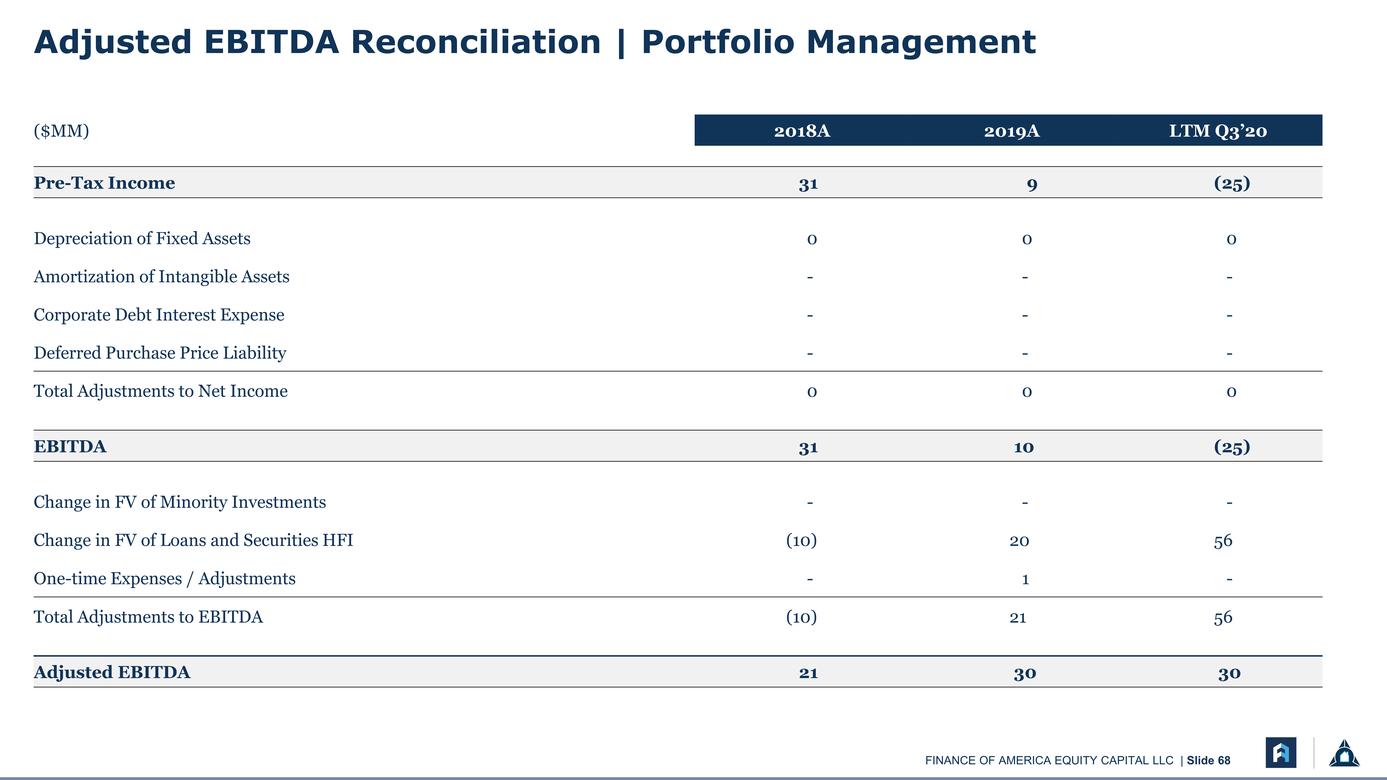
($MM) 2018A 2019A LTM 3Q'20 Income Statement Gain on sale of mortgage loans 8 7 6 Net interest income 76 79 106 Servicing income 3 1 9 Net fair value changes on portfolio assets (14) (22) (69) Net Gain (Loss) on Portfolio Assets 73 65 52 Fee Income 10 8 5 Total Revenue 83 73 57 Total Expenses 52 64 82 Pretax Income 31 9 (25) EBITDA 31 10 (25) Adjusted EBITDA 21 30 30 Balance Sheet Restricted cash 146 263 306 Loans held for investment, subject to HMBS liabilities, at fair value 9,616 9,481 9,811 Loans held for investment, subject to nonrecourse debt, at fair value 1,282 3,434 5,181 Loans held for investment, at fair value 944 971 924 Debt securities, at fair value 102 Mortgage servicing rights, at fair value 3 3 101 Other assets 111 195 125 Total Long-Term Investment Assets 12,102 14,449 16,448 Loans held for sale, at fair value 709 607 143 Total Earning Assets 12,811 15,056 16,591 HMBS liabilities, at fair value 9,439 9,320 9,662 Nonrecourse debt, at fair value 1,593 3,490 5,073 Other secured financing 1,203 1,663 1,192 Other liabilities 174 133 82 Total Financing of Portfolio 12,409 14,606 16,009 Net Equity in Earnings Assets 402 450 582 Our Portfolio Management segment provides product development, loan securitization, loan sales, risk management, asset management, and servicing oversight services to Finance of America and third-party funds. Revenue for this segment comes from four main asset classes: Servicing fee income on retained MSR’s from forward mortgage originations. Servicing fee income on HECM asset. Net interest income on securitized reverse and commercial loans subject to non-recourse debt. Changes in fair value as a result of the realization of projected cash flows and/or market and model input changes. We consider this segment to be recurring revenue because the consistent net positive cash flows from interest and servicing fees will continue for the life of the retained assets. Portfolio Management will see growth in top-line revenue and profitability as we continue to retain originated loans from each of our lending segments,. We expect to see growth in this segment over the coming years and believe it to be a key differentiator in our ability to maintain cycle-resistant earnings. Expenses in this segment primarily consist of salaries and benefits for the headcount associated with these services. |
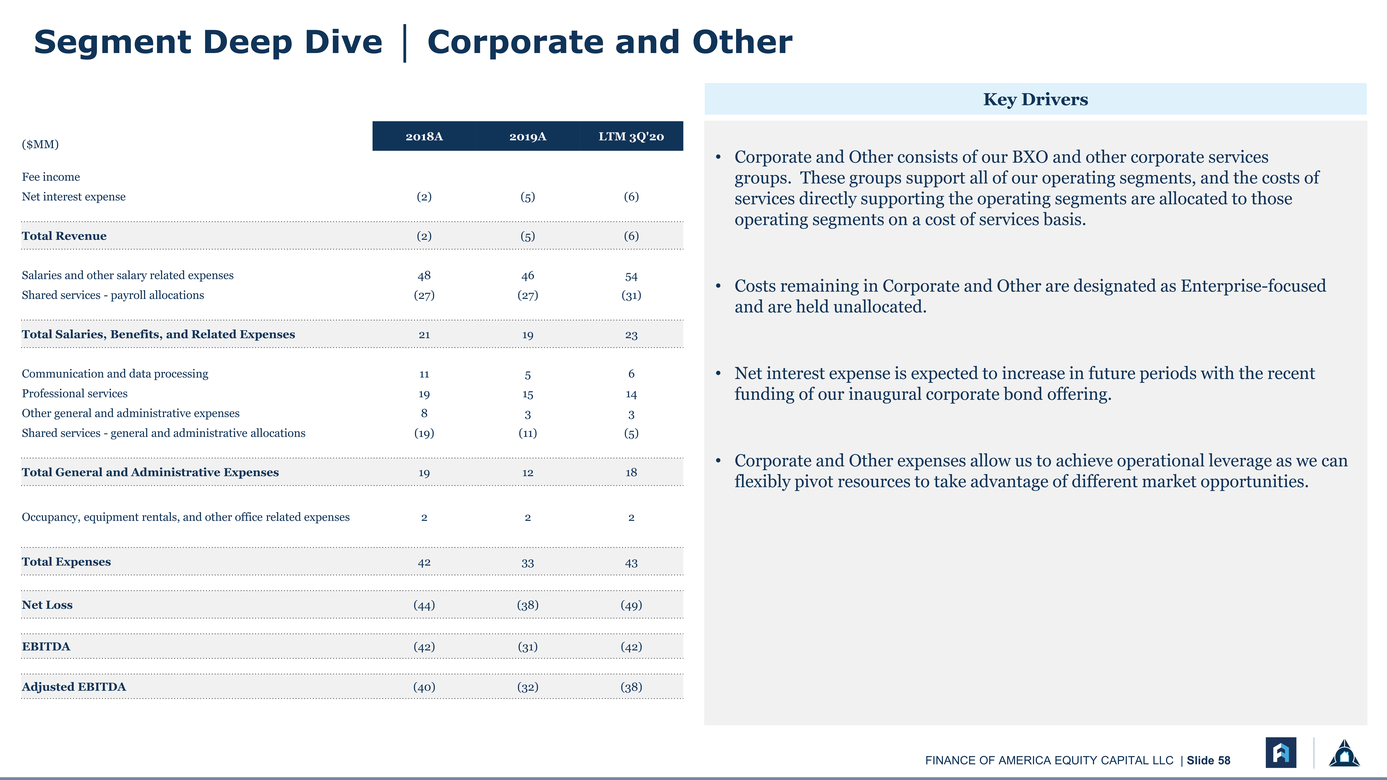 |
($MM) 2018A 2019A LTM 3Q'20 Fee income Net interest expense (2) (5) (6) Total Revenue (2) (5) (6) Salaries and other salary related expenses 48 46 54 Shared services - payroll allocations (27) (27) (31) Total Salaries, Benefits, and Related Expenses 21 19 23 Communication and data processing 11 5 6 Professional services 19 15 14 Other general and administrative expenses 8 3 3 Shared services - general and administrative allocations (19) (11) (5) Total General and Administrative Expenses 19 12 18 Occupancy, equipment rentals, and other office related expenses 2 2 2 Total Expenses 42 33 43 Net Loss (44) (38) (49) EBITDA (42) (31) (42) Adjusted EBITDA (40) (32) (38) Corporate and Other consists of our BXO and other corporate services groups. These groups support all of our operating segments, and the costs of services directly supporting the operating segments are allocated to those operating segments on a cost of services basis. Costs remaining in Corporate and Other are designated as Enterprise-focused and are held unallocated. Net interest expense is expected to increase in future periods with the recent funding of our inaugural corporate bond offering. Corporate and Other expenses allow us to achieve operational leverage as we can flexibly pivot resources to take advantage of different market opportunities. |
 |
6 Transaction Overview & Valuation Considerations |
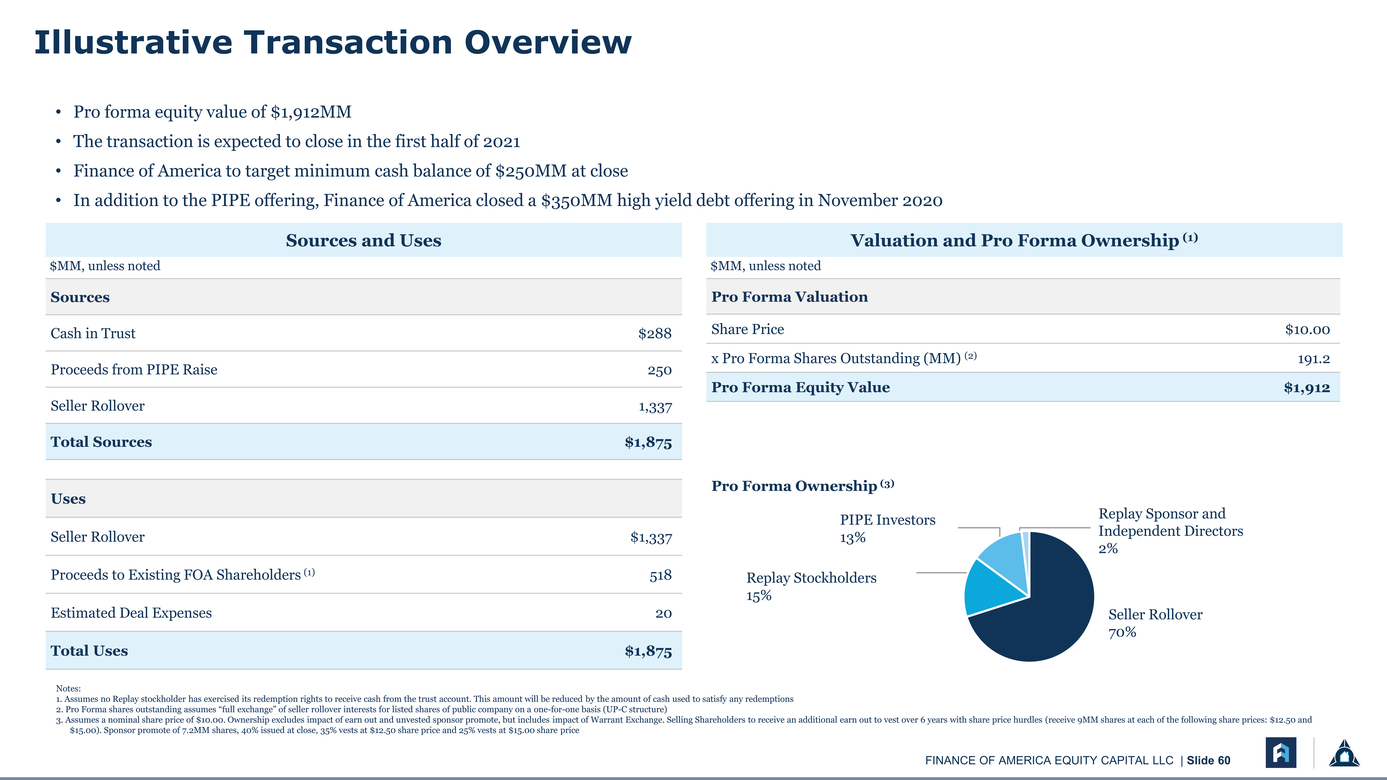 |
Illustrative Transaction Overview Pro forma equity value of $1,912MM The transaction is expected to close in the first half of 2021 Finance of America to target minimum cash balance of $250MM at close In addition to the PIPE offering, Finance of America closed a $350MM high yield debt offering in November 2020 Sources and UsesValuation and Pro Forma Ownership (1) $MM, unless noted$MM, unless noted Pro Forma Valuation Share Price $10.00 x Pro Forma Shares Outstanding (MM) (2) 191.2 Pro Forma Equity Value $1,912 Cash in Trust$288 Proceeds from PIPE Raise250 Seller Rollover1,337 Total Sources$1,875 Uses Seller Rollover $1,337 Proceeds to Existing FOA Shareholders (1) 518 Estimated Deal Expenses 20 Total Uses $1,875 PIPE Investors 13% Replay Stockholders 15% Replay Sponsor and Independent Directors 2% Seller Rollover 70% Notes: Assumes no Replay stockholder has exercised its redemption rights to receive cash from the trust account. This amount will be reduced by the amount of cash used to satisfy any redemptions Pro Forma shares outstanding assumes “full exchange” of seller rollover interests for listed shares of public company on a one-for-one basis (UP-C structure) Assumes a nominal share price of $10.00. Ownership excludes impact of earn out and unvested sponsor promote, but includes impact of Warrant Exchange. Selling Shareholders to receive an additional earn out to vest over 6 years with share price hurdles (receive 9MM shares at each of the following share prices: $12.50 and $15.00). Sponsor promote of 7.2MM shares, 40% issued at close, 35% vests at $12.50 share price and 25% vests at $15.00 share price |
 |
Appendix |
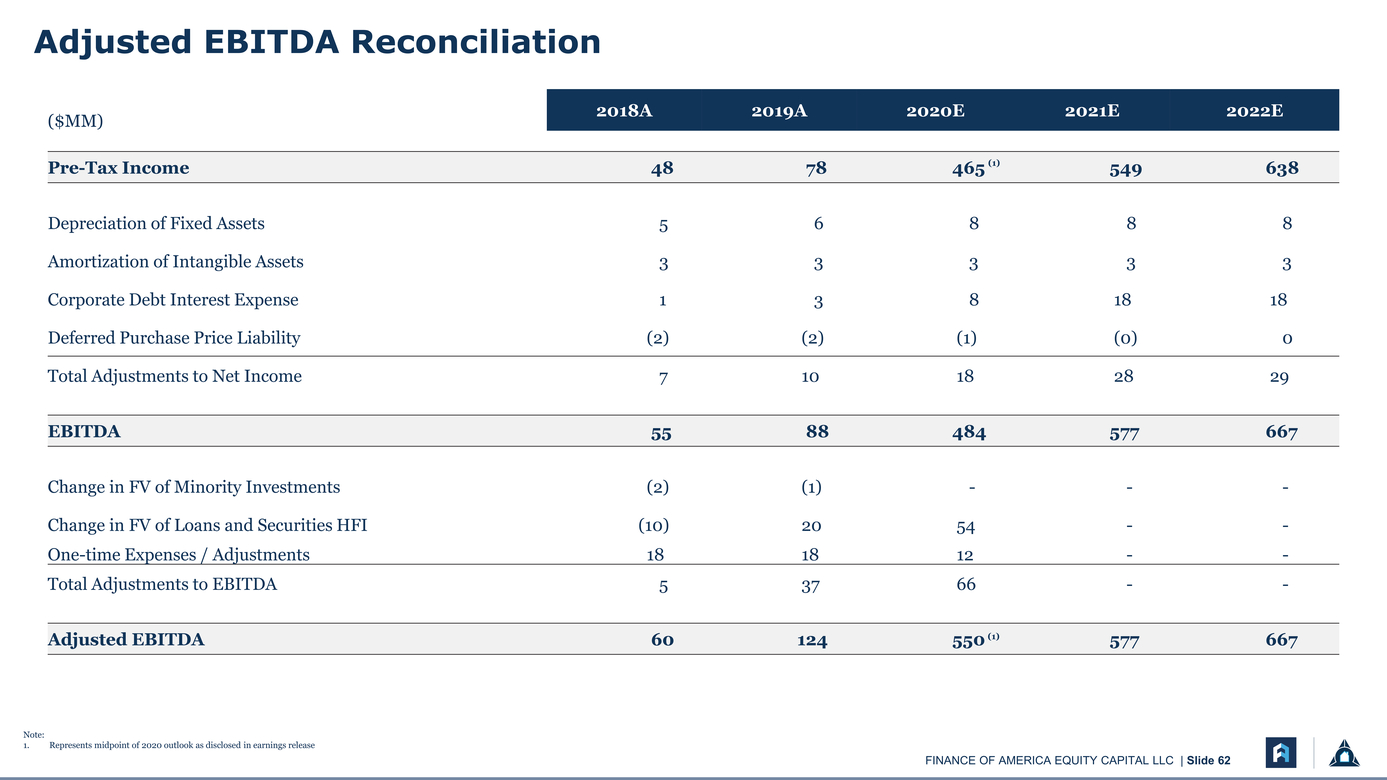 |
($MM)2018A2019A2020E2021E2022E One-time Expenses / Adjustments181812--Total Adjustments to EBITDA53766--Adjusted EBITDA60124550 (1) 577667 |
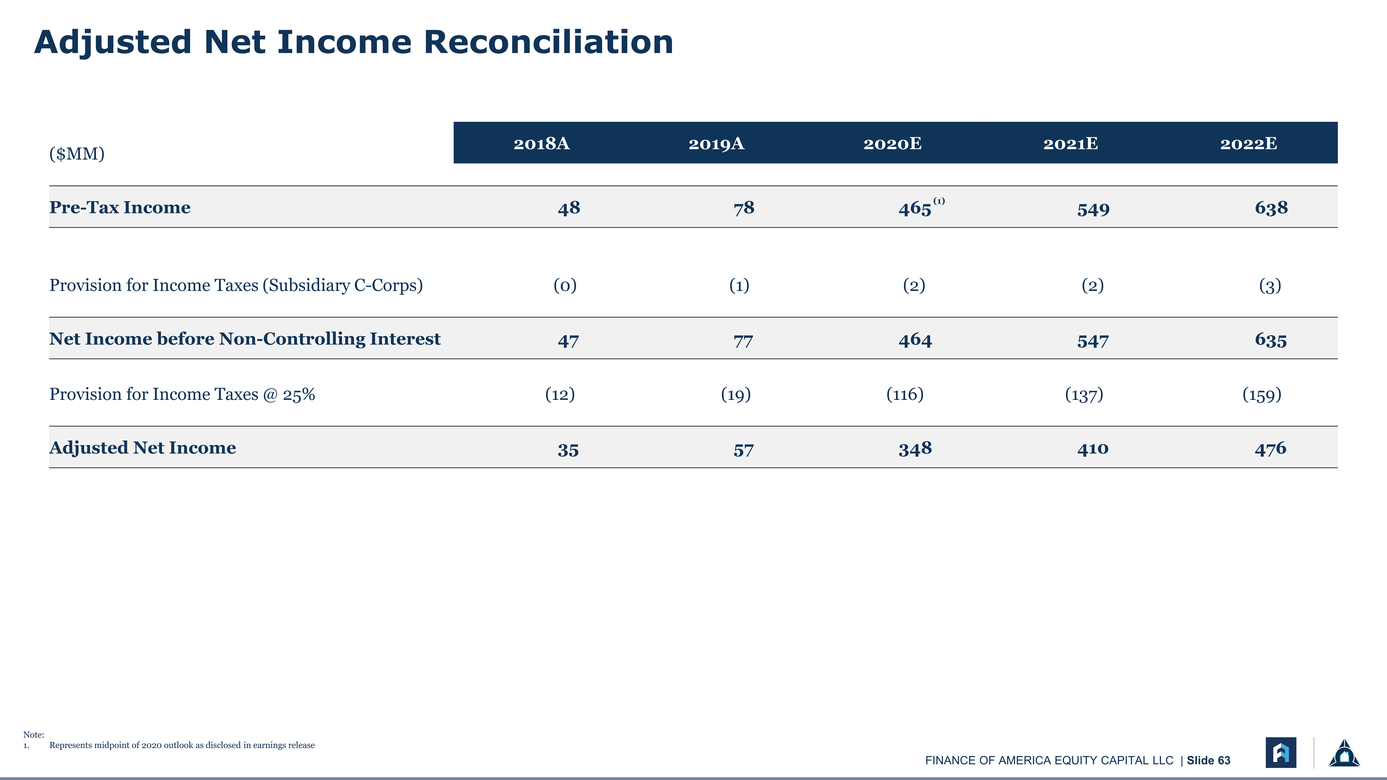 |
($MM)2018A2019A2020E2021E2022E Pre-Tax Income4878465 (1) 549638 |
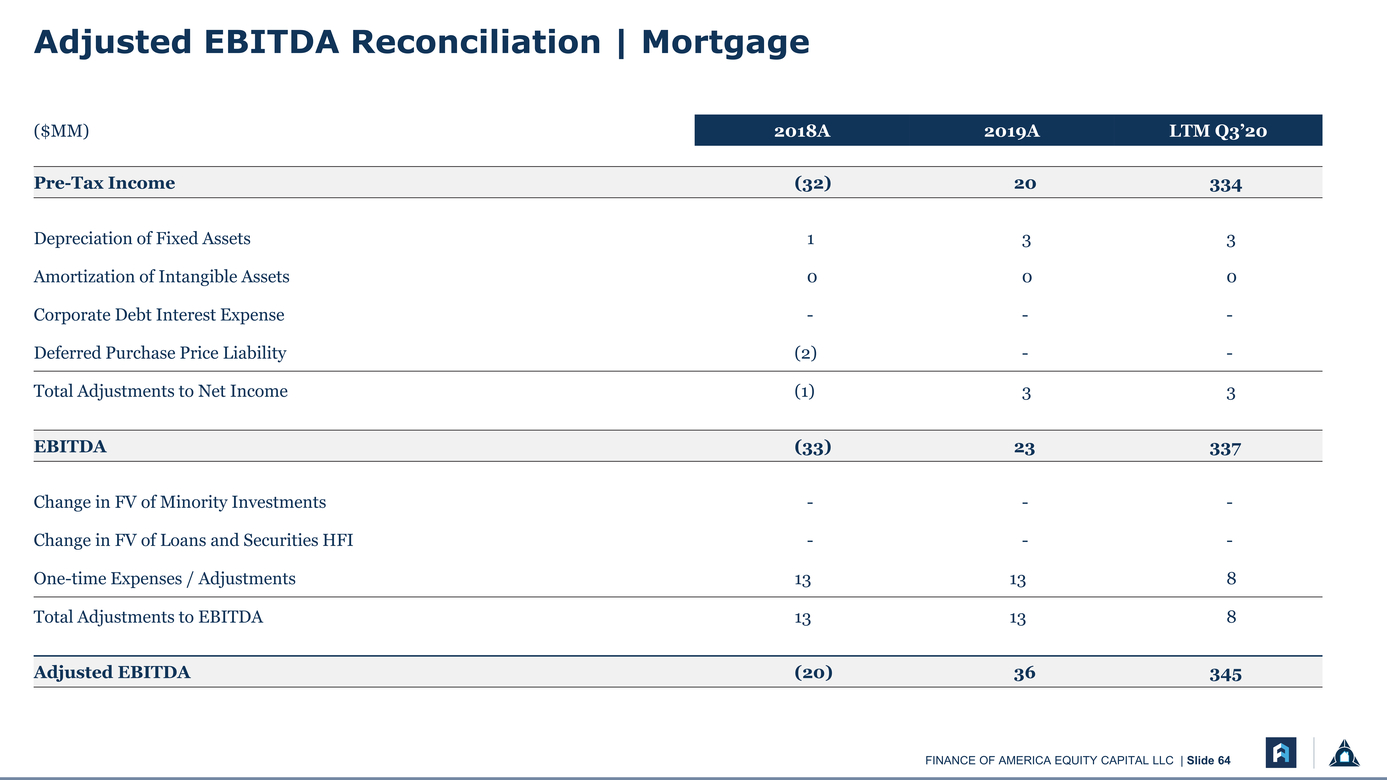 |
Adjusted EBITDA(20)36345 |
 |
[LOGO] |
 |
[LOGO] |
 |
[LOGO] |
 |
[LOGO] |
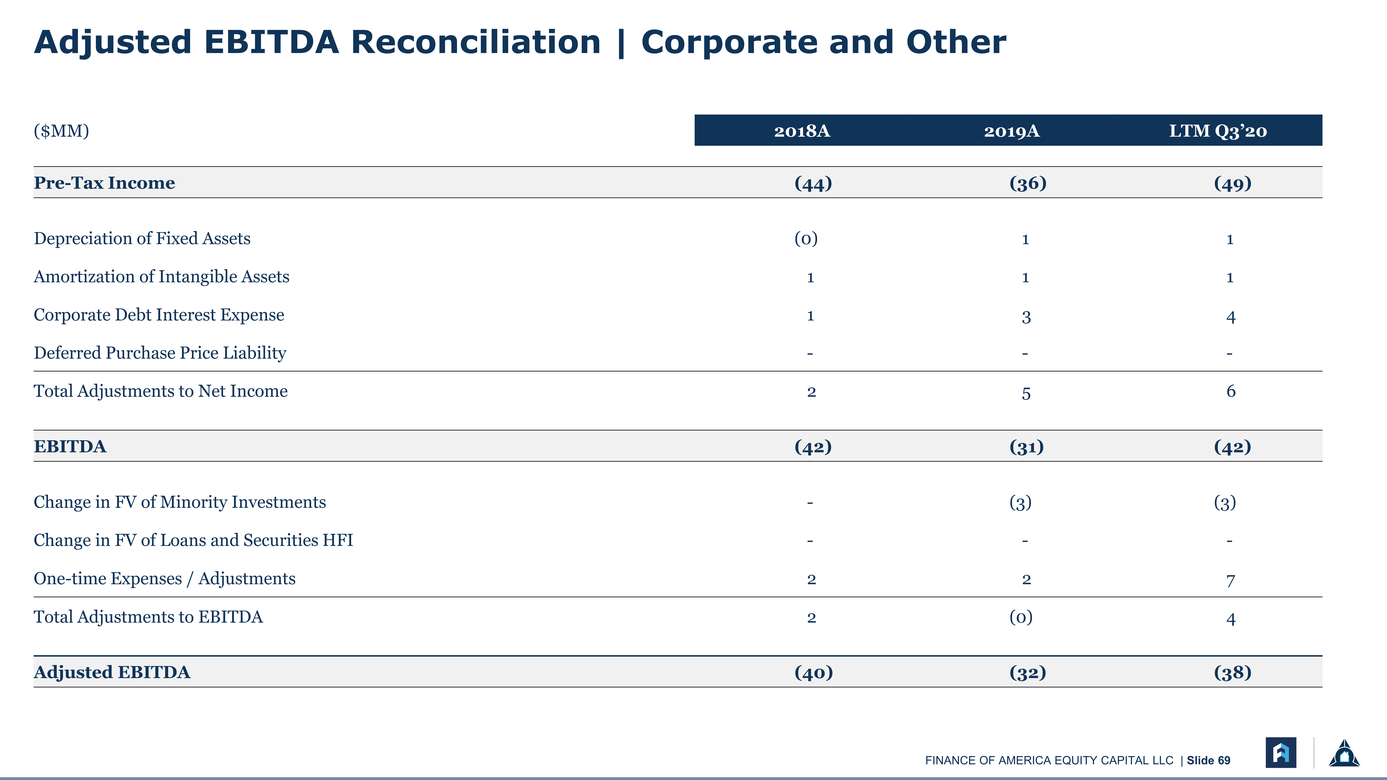 |
Adjusted EBITDA(40)(32)(38) |
Important Information About the Proposed Business Combination and Where to Find It
In connection with the proposed business combination, a registration statement on Form S-4 (the “Form S-4”) has been filed by Finance of America Companies Inc., a newly-formed holding company (“New Pubco”), with the U.S. Securities and Exchange Commission (“SEC”) that includes a preliminary proxy statement of Replay Acquisition that also constitutes a preliminary prospectus of New Pubco. Replay Acquisition, Finance of America and New Pubco urge investors, stockholders and other interested persons to read the Form S-4, including the preliminary proxy statement/prospectus and amendments thereto and, when available, the definitive proxy statement/prospectus and documents incorporated by reference therein, as well as other documents filed with the SEC in connection with the proposed business combination, as these materials will contain important information about Finance of America, Replay Acquisition, and the proposed business combination. Such persons can also read Replay Acquisition’s Annual Report on Form 10-K for the fiscal year ended December 31, 2019, for a description of the security holdings of Replay Acquisition’s officers and directors and their respective interests as security holders in the consummation of the proposed business combination. When available, the definitive proxy statement/prospectus will be mailed to Replay Acquisition’s stockholders as of a record date to be established for voting on the proposed business combination. Shareholders will also be able to obtain copies of such documents, without charge, once available, at the SEC’s website at www.sec.gov, or by directing a request to: Replay Acquisition Corp., 767 Fifth Avenue, 46th Floor, New York, New York 10153, or info@replayacquisition.com. These documents, once available, can also be obtained, without charge, at the SEC’s web site (http://www.sec.gov).
Participants in the Solicitation
Replay Acquisition, Finance of America, New Pubco and their respective directors, executive officers and other members of their management and employees, under SEC rules, may be deemed to be participants in the solicitation of proxies of Replay Acquisition’s shareholders in connection with the proposed business combination. Investors and security holders may obtain more detailed information regarding the names, affiliations and interests of Replay Acquisition’s directors and executive officers in Replay Acquisition’s Annual Report on Form 10-K for the fiscal year ended December 31, 2019, which was filed with the SEC on March 25, 2020. Information regarding the persons who may, under SEC rules, be deemed participants in the solicitation of proxies of Replay Acquisition’s shareholders in connection with the proposed business combination is set forth in the proxy statement/prospectus for the proposed business combination. Information concerning the interests of Replay Acquisition’s and Finance of America’s participants in the solicitation, which may, in some cases, be different than those of Replay Acquisition’s and Finance of America’s equity holders generally, is set forth in the proxy statement/prospectus relating to the proposed business combination.
Forward-Looking Statements
This press release includes “forward-looking statements” within the meaning of the “safe harbor” provisions of the United States Private Securities Litigation Reform Act of 1995. Replay Acquisition’s and Finance of America’s actual results may differ from their expectations, estimates, and projections and, consequently, you should not rely on these forward-looking statements as predictions of future events. Words such as “expect,” “estimate,” “project,” “budget,” “forecast,” “anticipate,” “intend,” “plan,” “may,” “will,” “could,” “should,” “believes,” “predicts,” “potential,” “continue,” and similar expressions (or the negative versions of such words or expressions) are intended to identify such forward-looking statements. These forward-looking statements include, without limitation, Replay Acquisition’s and Finance of America’s expectations with respect to future performance and anticipated financial impacts of the proposed business combination, the satisfaction or waiver of the closing conditions to the proposed business combination, and the timing of the completion of the proposed business combination.
These forward-looking statements involve significant risks and uncertainties that could cause the actual results to differ materially, and potentially adversely, from those expressed or implied in the forward-looking statements. Most of these factors are outside Replay Acquisition’s and Finance of America’s control and are difficult to predict. Factors that may cause such differences include, but are not limited to: (1) the occurrence of any event, change, or other circumstances that could give rise to the termination of the definitive transaction agreement (the “Agreement”); (2) the outcome of any legal proceedings that may be instituted against Replay Acquisition, New Pubco and/or Finance of America following the announcement of the Agreement and the transactions contemplated therein; (3) the inability to complete the proposed business combination, including due to failure to obtain approval of the shareholders of Replay Acquisition, certain regulatory approvals, or satisfy other conditions to closing in the Agreement; (4) the occurrence of any event, change, or other circumstance that could give rise to the termination of the Agreement or could otherwise cause the transaction to fail to close; (5) the impact of COVID-19 on Finance of America’s business and/or the ability of the parties to complete the proposed business combination; (6) the inability to obtain or maintain the listing of New Pubco’s shares of common stock on the New York Stock Exchange following the proposed business combination; (7) the risk that the proposed business combination disrupts current plans and operations as a result of the announcement and consummation of the proposed business combination; (8) the ability to recognize the anticipated benefits of the proposed business combination, which may be affected by, among other things, competition, the ability of Finance of America to grow and manage growth profitably, and retain its key employees; (9) costs related to the proposed business combination; (10) changes in applicable laws or regulations; and (11) the possibility that Finance of America, Replay Acquisition or New Pubco may be adversely affected by other economic, business, and/or competitive factors. The foregoing list of factors is not exclusive. Additional information concerning certain of these and other risk factors is contained in Replay Acquisition’s most recent filings with the SEC and in the Form S-4, including the preliminary proxy statement/prospectus filed in connection with the proposed business combination and, when available, the definitive proxy statement/prospectus. All subsequent written and oral forward-looking statements concerning Replay Acquisition, Finance of America or New Pubco, the transactions described herein or other matters and attributable to Replay Acquisition, Finance of America, New Pubco or any person acting on their behalf are expressly qualified in their entirety by the cautionary statements above. Readers are cautioned not to place undue reliance upon any forward-looking statements, which speak only as of the date made. Each of Replay Acquisition, Finance of America and New Pubco expressly disclaims any obligations or undertaking to release publicly any updates or revisions to any forward-looking statements contained herein to reflect any change in their expectations with respect thereto or any change in events, conditions, or circumstances on which any statement is based, except as required by law.
No Offer or Solicitation
This press release is not a proxy statement or solicitation of a proxy, consent, or authorization with respect to any securities or in respect of the proposed business combination and shall not constitute an offer to sell or a solicitation of an offer to buy the securities of Replay Acquisition, New Pubco or Finance of America, nor shall there be any sale of any such securities in any state or jurisdiction in which such offer, solicitation, or sale would be unlawful prior to registration or qualification under the securities laws of such state or jurisdiction. No offer of securities shall be made except by means of a prospectus meeting the requirements of Section 10 of the Securities Act of 1933, as amended, or exemptions therefrom.